What Data Center Traffic to Log and Monitor
Table of Contents
What Data Center Traffic to Log and Monitor
The types of data center traffic you should log and monitor,
the tools you can use to analyze the traffic, and how to best utilize
them.
The Palo Alto Networks next-generation firewall creates
some logs by default, while you need to configure logging for other
traffic. The best practice is to log all data center traffic and
monitor the logs for unexpected applications, users, traffic, and
behaviors.
By default, the firewall logs traffic that matches explicitly
configured Security policy rules and does not log traffic that matches
the predefined intrazone-default (allows traffic with a source and
destination in the same zone) and interzone-default (the last rule
in the rulebase, which denies traffic that matches no preceding
rules) rules at the bottom of the rulebase.
When you create a Security policy rule, by default the firewall
logs the traffic at the end of the session:
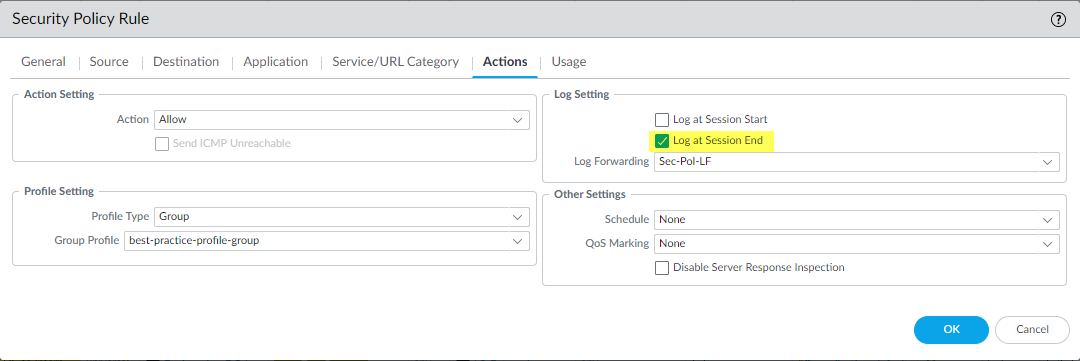
However, the firewall does not forward logs by default and does
not apply Security profiles by default. The preceding example shows
the best practice of forwarding logs to the appropriate log servers
and administrators and applying best practice Security profiles.
The best practice for most traffic is to Log at Session End because
applications often change throughout the lifespan of a session. For example, the initial
App-ID for a session may be web-browsing, but after the firewall processes a few
packets, the firewall may find a more specific App-ID for the application and change the
App-ID. There are several use cases for logging traffic at the start of a session,
including long-lived tunnel sessions such as GRE tunnels (you can't see active sessions
in the ACC unless you both Log at Session Start and
Log at Session End), when you need information from the start
of the session for troubleshooting, and to gain visibility into Operational
Technology/Industrial Control Systems (OT/ICS) sessions, which are also long-lived
sessions.
Logging the traffic records information about traffic that
a rule allows and traffic that a rule denies or drops (rule violations),
so the firewall provides valuable information regardless of how
the it treats the traffic. Rule violations highlight potential attacks
or allow rules that need to be adjusted to allow a legitimate business
application.
When you examine blocked traffic in logs, differentiate between
traffic that the firewall blocked as a protective event before any
systems have been compromised, such as blocking an application that
isn’t allowed, and traffic that the firewall blocked as a post-compromise
event, for example, an attempt by malware that is already on a data
center server to contact an external server to download more malware
or exfiltrate data.
The firewall provides a wealth of monitoring tools, logs, and
log reports with which to analyze your network:
- provides traffic, threat, User-ID, and many other log types, including Unified logs, which show multiple log types on one screen so you don’t have to look at different types of logs separately. When a magnifying glass icon is part of the summary, you can click it to drill down into the log entry.
- provides predefined reports that you can view and the ability to create report groups composed of predefined and custom reports. For example, you can review traffic activity or take baseline measurements to understand the bandwidth usage and traffic flow in each data center segment by zone or interface.
- provides the ability to create customized reports so that you can view information about block rules, allow rules, or any other subject of interest.
- enables you to take packet captures of traffic that traverses the firewall’s management interface and network interfaces.
- The Application Command Center ( ACC) provides widgets that display an interactive, graphical summary of the applications, users, URLs, threats, and content traversing the network. For example, you can review and evaluate the applications on the network ( ) to see if there are any changes in the application or if the application exhibits threat behaviors. If you see unexpected applications in the list, evaluate how to handle those applications.Another good way to use ACC information is to help identify compromised user accounts and host systems. Analyze threats along with the usernames associated with the threats using the widget and then use the threat logs to isolate the exact issue.
- The Dashboard ( Dashboard) provides widgets that display general firewall information and up to 10 of the most recent entries in the threat, configuration, and system logs.
- Use Panorama to monitor firewall health and baseline new devices, to compare performance metrics, and to track firewall performance after an event such as a commit, a software upgrade, content updates, rule changes, the addition of new applications, etc. If performance deviates from a device’s baseline, you can view and troubleshoot manually or automatically open a ticket for investigation.
- On Panorama or on an individual firewall, use the policy rule hit counter to analyze changes to the rulebase. For example, when you add a new application, before you allow that application’s traffic on the network, add the allow rule to the rulebase. If traffic hits the rule and increments the counter, it indicates traffic that matches the rule may already be on the network even though you haven’t activated the application, or that you need to tune the rule. Another example is replacing port-based rules with application-based rules by placing the application-based rule before the port-based rule and noting if any traffic hits the port-based rule. If traffic hits the port-based rule, then you need to tune the application-based rule to catch that traffic.In conjunction with the policy rule hit counter, check the and the widgets to see if traffic on non-standard ports caused the unexpected rule hits.The key to using the policy rule hit counter is to reset the counter when you make a change, such as introducing a new application or changing a rule’s meaning. Resetting the hit counter ensures that you see the result of the change, not results that include the change and events that happened before the change.