Cloud NGFW for AWS
Publish and View Custom Metrics in AWS CloudWatch
Table of Contents
Publish and View Custom Metrics in AWS CloudWatch
Publish custom metrics in AWS CloudWatch for your Cloud NGFW for AWS
resource
| Where Can I Use This? | What Do I Need? |
|---|---|
|
|
Cloud NGFW for AWS publishes custom metrics in AWS CloudWatch to help you monitor your
Cloud NGFW's health, performance, and usage patterns. With these additional metrics
you can assess the overall health of your Cloud NGFW resources, identify performance
bottlenecks and detect anomalies. These metrics are numerical values describing
aspects of a Cloud NGFW at a particular time. Collected every 5 minutes, metrics are
useful for alerting due to their frequent sampling.
The
CloudWatch log group, S3 bucket, CloudWatch namespace and the Kinesis stream
should be precreated in the CloudFormation template (CFT).
Metrics are collected every 5 minutes. All
metrics are published to one namespace. CloudWatch stores your metrics, so that
you can access historical information for an added perspective on how your Cloud
NGFW resources are performing. You can also set alarms that watch for certain
thresholds, and send notifications or take actions when those thresholds are
met. For more information, see the Amazon CloudWatch documentation.
The following CloudWatch metrics are supported by the Cloud NGFW resource:
|
Field Name
|
Description
|
|---|---|
|
Dataplane CPU Utilization (%)
|
Monitors dataplane CPU usage and measures the traffic load on the
Cloud NGFW resource.
|
|
Dataplane Packet Buffer Utilization (%)
|
Monitors dataplane buffer usage and measures buffer utilization.
If you have a sudden burst in traffic, monitoring your buffer
utilization allows you to ensure that the firewall does not
deplete the dataplane buffer, which results in dropped
packets.
|
|
Connection per Second
|
Represents the total number of concurrent TCP connections.
|
|
Session throughput Kbps
|
The session throughputis , measured in Kbps.
|
|
Session throughput Pps
|
The session throughputis , measured in Pps.
|
|
Sessions Active
|
Monitors the total number of sessions that are active on the
Cloud NGFW resource. An active session is a session that is in
the flow lookup table for which packets will be inspected and
forwarded, as required by policy.
|
|
Session Utilization (%)
|
Monitors the TCP, UDP, ICMP, and SSL sessions that are currently
active and the packet rate, new connection establish rate, and
firewall throughput to determine session utilization.
|
|
BytesIn
|
Number of bytes in the server-to-client direction of the
session.
|
|
BytesOut
|
Number of bytes in the client-to-server direction of the
session.
|
|
PktsIn
|
Number of server-to-client packets for the session.
|
|
PktsOut
|
Number of client-to-server packets for the session.
|
To publish CloudWatch Metrics:
- Log in to your Cloud NGFW resource.Select NG Firewalls.Select Log Settings.Under Metrics, specify the following:
- CloudWatch Namespace. This field represents the location on AWS where the metrics are collected.CloudWatch Metric. Select the metrics you want to monitor. See the table above for supported metrics.Click Save.
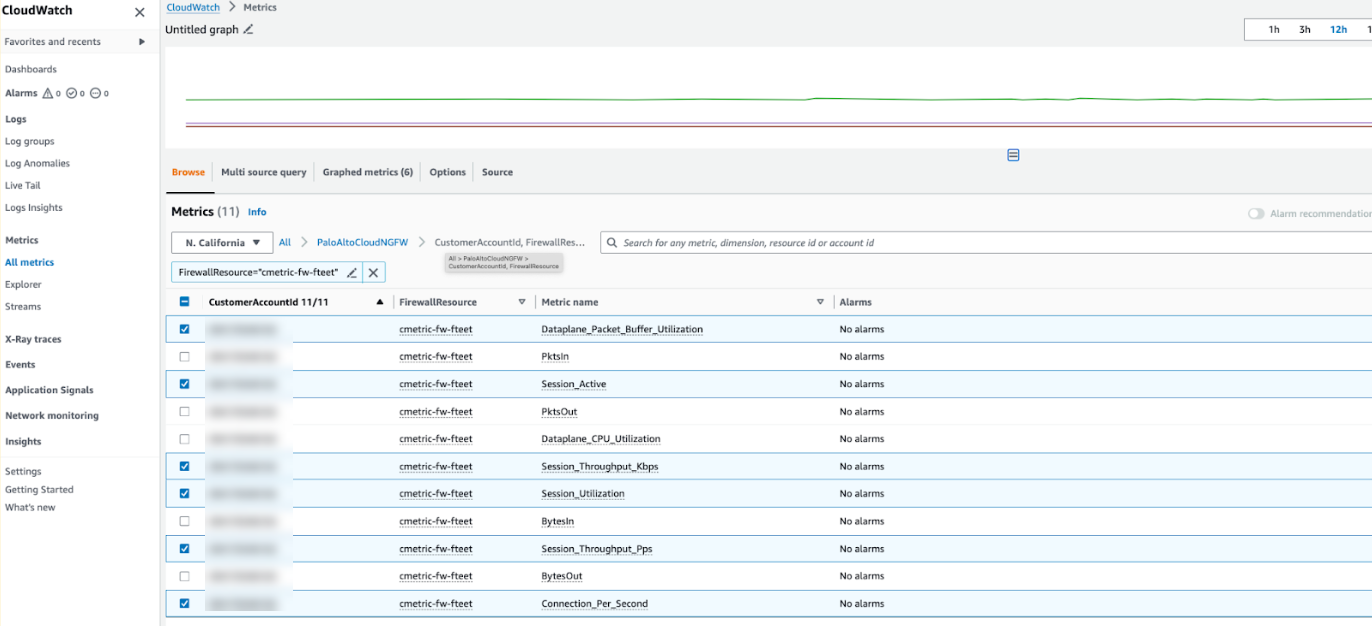
![]() A sample output of metrics displayed in an account resembles:
A sample output of metrics displayed in an account resembles:![]()