GlobalProtect
View and Collect GlobalProtect App Logs
Table of Contents
View and Collect GlobalProtect App Logs
View details about remote end user issues in the GlobalProtect
app logs.
| Where Can I Use This? | What Do I Need? |
|---|---|
|
|
You have two options for collecting GlobalProtect™
app logs from the end users’ endpoints:
- Collect logs—End users must manually collect the GlobalProtect app logs. They can also control the number of rotating log files maintained on Windows and macOS endpoints. For more information, see Configure GlobalProtect App Log File Count.
- Report an issue—End users report an issue directly to Strata Logging Service to which the administrator can access when they experience unusual behavior such as poor network performance or a connection is not established with the portal and gateway.In order for the GlobalProtect app to send troubleshooting logs, diagnostic logs, or both to Strata Logging Service for further analysis, you must configure the GlobalProtect portal to enable the configure the app log collection settings on the GlobalProtect portal.Additionally, you can you configure the HTTPS-based destination URLs that can contain IP addresses or fully qualified domain names of the web servers/resources that you want to probe, and to determine issues such as latency or network performance on the end user’s endpoint.
Use the following
steps to view or collect GlobalProtect logs:
- Launch the GlobalProtect app.From the status panel, open the settings dialog ().
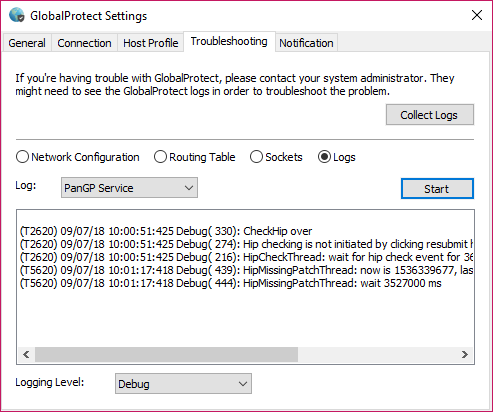
![]() Select Settings.From the GlobalProtect Settings panel, select Troubleshooting.Select either Debug or Dump from the Logging Level drop-down.(Optional—Windows only) View your GlobalProtect logs:
Select Settings.From the GlobalProtect Settings panel, select Troubleshooting.Select either Debug or Dump from the Logging Level drop-down.(Optional—Windows only) View your GlobalProtect logs:- Select Logs.Choose a Log type.Start viewing logs.
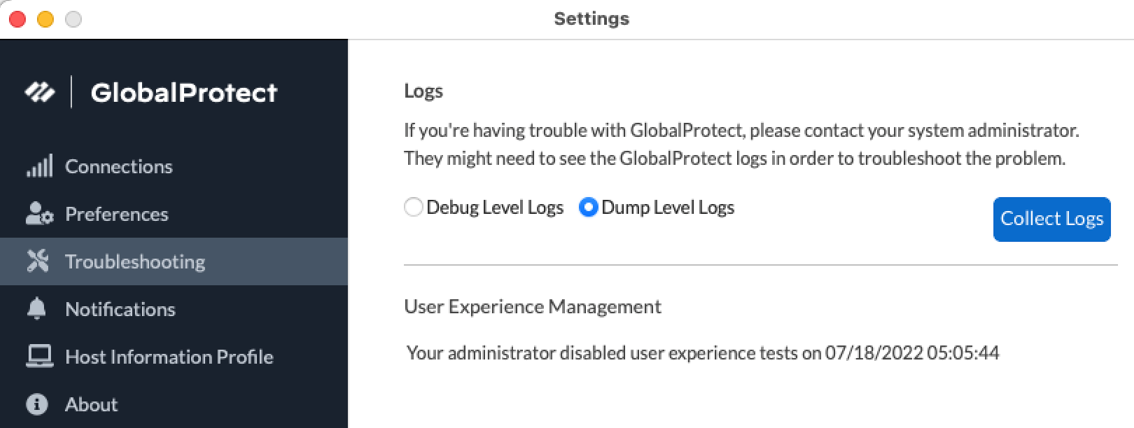
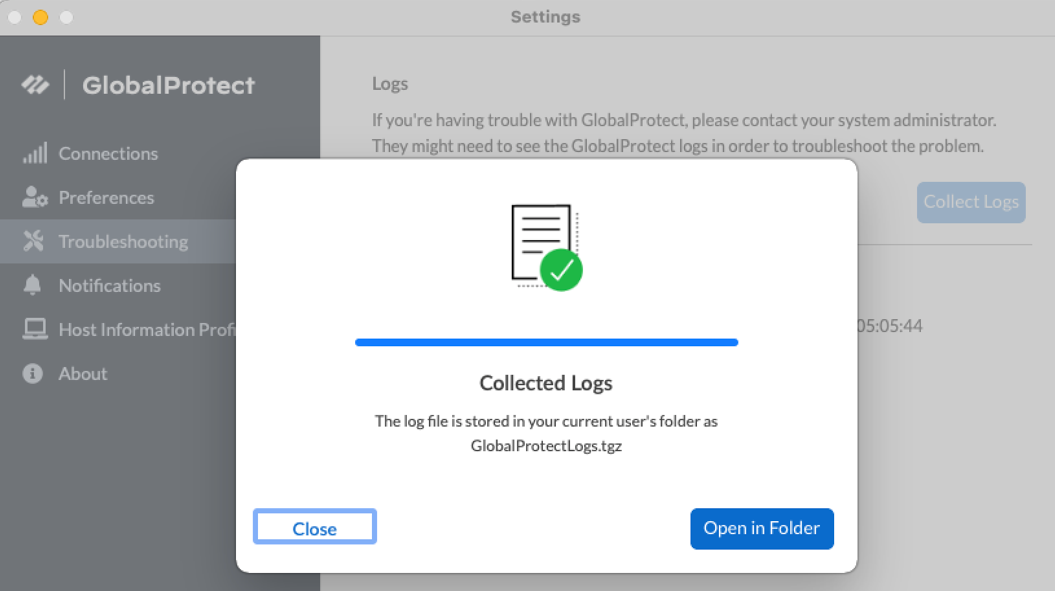
![]() (Optional) Collect Logs to send to your GlobalProtect administrator for troubleshooting.
(Optional) Collect Logs to send to your GlobalProtect administrator for troubleshooting.![]()
![]()