Next-Generation Firewall
ACC Widgets
Table of Contents
ACC Widgets
The widgets on each tab are interactive; you can set
the ACC
Filters and drill down into the details for each table or
graph, or customize the widgets included in the tab to focus on
the information you need. For details on what each widget displays,
see Widget
Descriptions.

Widgets | ||
|---|---|---|

| View | You can sort the data by bytes, sessions, threats,
count, content, URLs, malicious, benign, files, applications, data,
profiles, objects, users. The available options vary by widget. |

| Graph | The graphical display options are treemap, line
graph, horizontal bar graph, stacked area graph, stacked bar graph,
and map. The available options vary by widget; the interaction experience also
varies with each graph type. For example, the widget for Applications
using Non-Standard Ports allows you to choose between a treemap
and a line graph. To drill down into the display, click into the
graph. The area you click into becomes a filter and allows you to
zoom into the selection and view more granular information on the selection. |

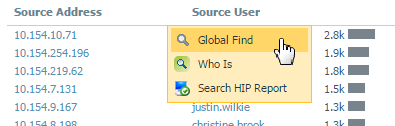
| Table | The detailed view of the data used to render
the graph is provided in a table below the graph. You can interact
with the table in several ways:
|

| Actions | 


|