Prisma SD-WAN
Prisma SD-WAN Clarity Reports
Table of Contents
Prisma SD-WAN Clarity Reports
Learn about the different Prisma SD-WAN Clarity reports.
| Where Can I Use This? | What Do I Need? |
|---|---|
|
|
The WAN Clarity Report is auto-generated weekly and
provides aggregate views of ingress and egress traffic distribution, 90th percentile
bandwidth utilization across circuits, WAN utilization over a threshold, heat maps, top
applications, clients, servers, client and server pairs, and undefined domains for the
entire week and separately for periods of high utilization.
Download the entire reports package or view the reports from the Prisma SD-WAN controller, allowing for week-over-week trend comparisons,
as well as comparisons across sites and circuits.
The WAN Clarity Report is available for immediate use as a
licensed license service. Contact the Prisma SD-WAN sales team to enable the
license. The reports include,
- WAN Clarity Branch Reports
- WAN Clarity Data Center Reports
- WAN Clarity Aggregate On-Demand Bandwidth Reports
WAN Clarity Branch Reports
Let us learn about the branch reports in the WAN Clarity Reports.
The following are the descriptions of
branch reports in the WAN Clarity Reports.
- Traffic Distribution
- Utilization Quadrant
- Utilization over Threshold
- Heatmap
- Hotspots
- Top N
- Application Volume per Circuit
Traffic Distribution
The Traffic Distribution report
helps administrators understand utilization across different WAN
path types at an AppFabric-level. This report provides a quick overview
of traffic distribution across the AppFabric, ensuring traffic meets the
aggregate path policy objectives.

The sample
chart above lists traffic distribution for a global enterprise for
the week of July 5, 2021. This enterprise’s objective of using more
of their public WAN circuit types (e.g., broadband Internet) versus
their private WAN circuits (e.g., MPLS) is being met at an aggregate
level. The following Utilization Quadrant report
will help identify which sites and circuits an administrator will
focus on next.
Utilization Quadrant
The Utilization Quadrant report
offers a visual synopsis of circuit utilization for all sites. The
report plots 90th percentile utilization for every circuit across
the AppFabric, in both ingress and egress directions. The quadrant
highlights circuits whose 90th percentile utilization is above 50%
of the provisioned capacity in either the ingress or egress direction,
thereby making it a candidate for further investigation.
For
example, if a particular site and circuit show up week after week,
it may warrant adjustments to the circuit capacity. However, to
assess whether the high utilization in a specific circuit is carrying
business-critical traffic and occurs during business-impacting hours,
you may use the next set of reports to clarify the utilization.

The sample
chart above summarizes utilization over a week for a global enterprise.
13 circuits stand out based on their utilization at the 90th percentile.
One site and circuit to review further is the MPLS circuit at Chicago
that seems to stand out for its egress utilization. The Utilization
Over Threshold report in the next section will provide
more clarity as to the days and minutes when the MPLS circuit was
highly utilized.
Utilization Over Threshold
The Utilization Over Threshold reports
provides any site and circuit present in the three quadrants of the
Utilization Quadrant report, representing greater than 50% utilization
(at the 90th percentile). This report provides a daily aggregate
of minutes when a circuit operates over the defined utilization
threshold. For the initial WAN Clarity Reports release, the threshold
set is 70%. This report supplements the Quadrant report as it informs
administrators of the days and the duration when a particular circuit
exceeded that threshold.

The
sample chart above displays the total minutes when the Chicago MPLS
circuit operated at or above 70% of the provisioned bandwidth. The
majority of the high utilization is during the workweek and in the
egress direction. However, to understand when the hotspots occurred
during those days, review the Heatmap report
described in the next section.
Heatmap
The Heatmap reports
provide any site and circuit present in the three quadrants of the
Utilization Quadrant report, representing greater than 50% utilization
(at the 90th percentile). The report provides context to the day's
hours (site local time) when the high utilization occurs. If the
observed contention happens during business hours, an assessment
of provisioned capacity may be warranted. The heatmap also sheds
light on abnormal bandwidth-consumption behavior outside of regular
business hours.

The sample
chart above shows the bandwidth consumption trend for the MPLS circuit
in Chicago for one week. This chart is interesting as many more
egress activities post business hours (after 1600 hours) than during
business hours. This may not be anomalous if scheduled software
upgrades, backup replication jobs, etc., typically happen after
business hours.
However, there is also a good bit of contention
between 2021-07-05 and 2021-07-11 during regular business hours.
Suppose this trend is observed week after week. In that case, the
network administrator should reassess the provisioned bandwidth
on this circuit or rewrite application policies to load-balance
traffic across multiple paths. The following set of Hotspot reports
will help identify which traffic contributes to the heavy load during
these periods
Hotspots
The Hotspot reports
provide each site and circuit with a corresponding Heatmap report
for granular insight into the circuits at the hotspots' time. The
reports provide a list of applications, undefined domains, destination
IPs, source IPs, and source and destination IP pairs observed during
the hotspots.
A hotspot is any period when the circuit utilization
in either the ingress or egress direction is above 70% of the provisioned bandwidth.
The charts generated for each hotspot report displays the top 10,
and a companion CSV file is available within the package that provides
all of the data for each hotspot report. The charts are generated
for the top 10 largest sites by volume. You can preview these charts.
| Hotspot Report | Description |
|---|---|
| Hotspots: Applications | Provides clarity as to which applications
contribute to the hotspots. The report gives insight into whether
business-relevant applications are consuming bandwidth during hotspots. This
information can be instrumental in ensuring that the appropriate
QoS and Path policies are applied in the future to guarantee that
business-critical applications are serviced first, with non-business-relevant
applications potentially offloaded to alternate paths. If business-critical
applications contribute to the hotspots week after week, reassess
if the circuit capacity may be oversubscribed. 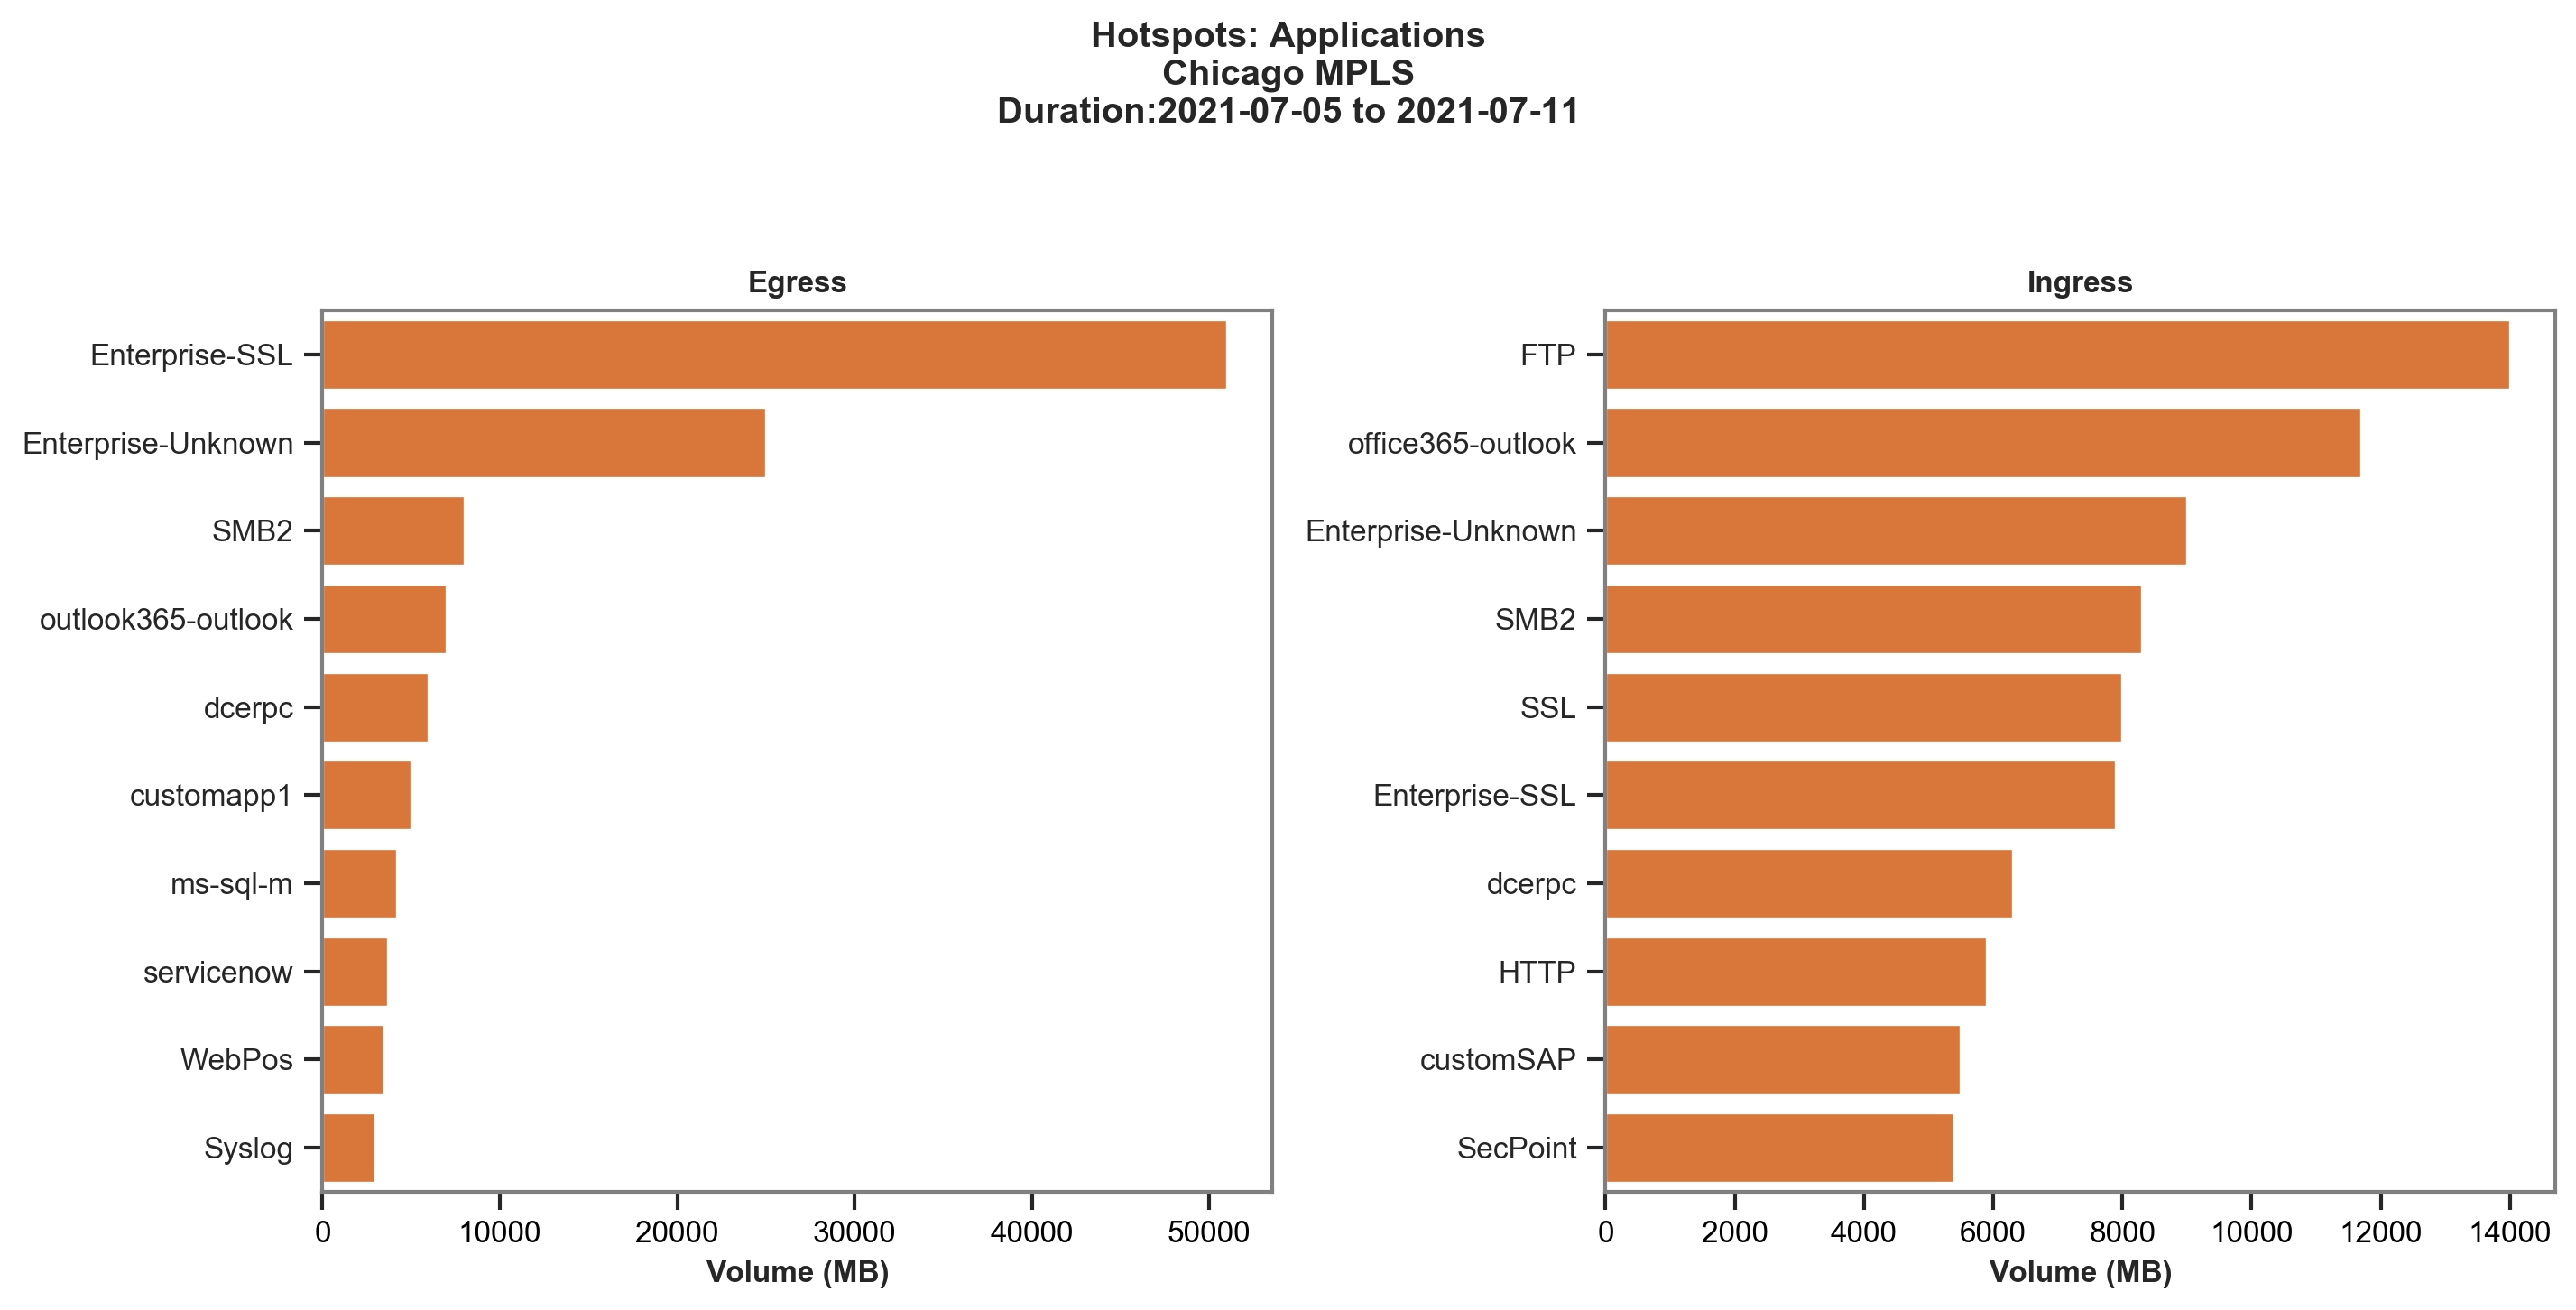
The
sample chart above lists the top 10 applications accessed during
hotspots on the MPLS link at Chicago for one week. One of the takeaways
from this report is the amount of traffic matching enterprise SSL
and enterprise-unknown applications, which are generic catch-all
applications for flows destined to enterprise prefixes: SSL and
non-SSL (and non-HTTP), respectively. The next set of reports
around undefined domains and destination IPs can help clarify which
enterprise FQDNs and IPs have the highest traffic to see if they
are candidates for custom application creation. |
| Hotspots: Destination IPs | Based on the hotspots identified in the
heatmap, the Hotspots: Destination IPs report clarify which destination
IP addresses contributed to the hotspots. This report is useful
to correlate with the Hotspots: Application report, especially when the
top application is a generic one like enterprise-unknown. With
these destination IP addresses, you will have enough information
to create a custom application so that they can apply unique QoS,
path, or security policies to these flows as needed, or at a minimum,
define an application for purposes of utilization tracking and performance. 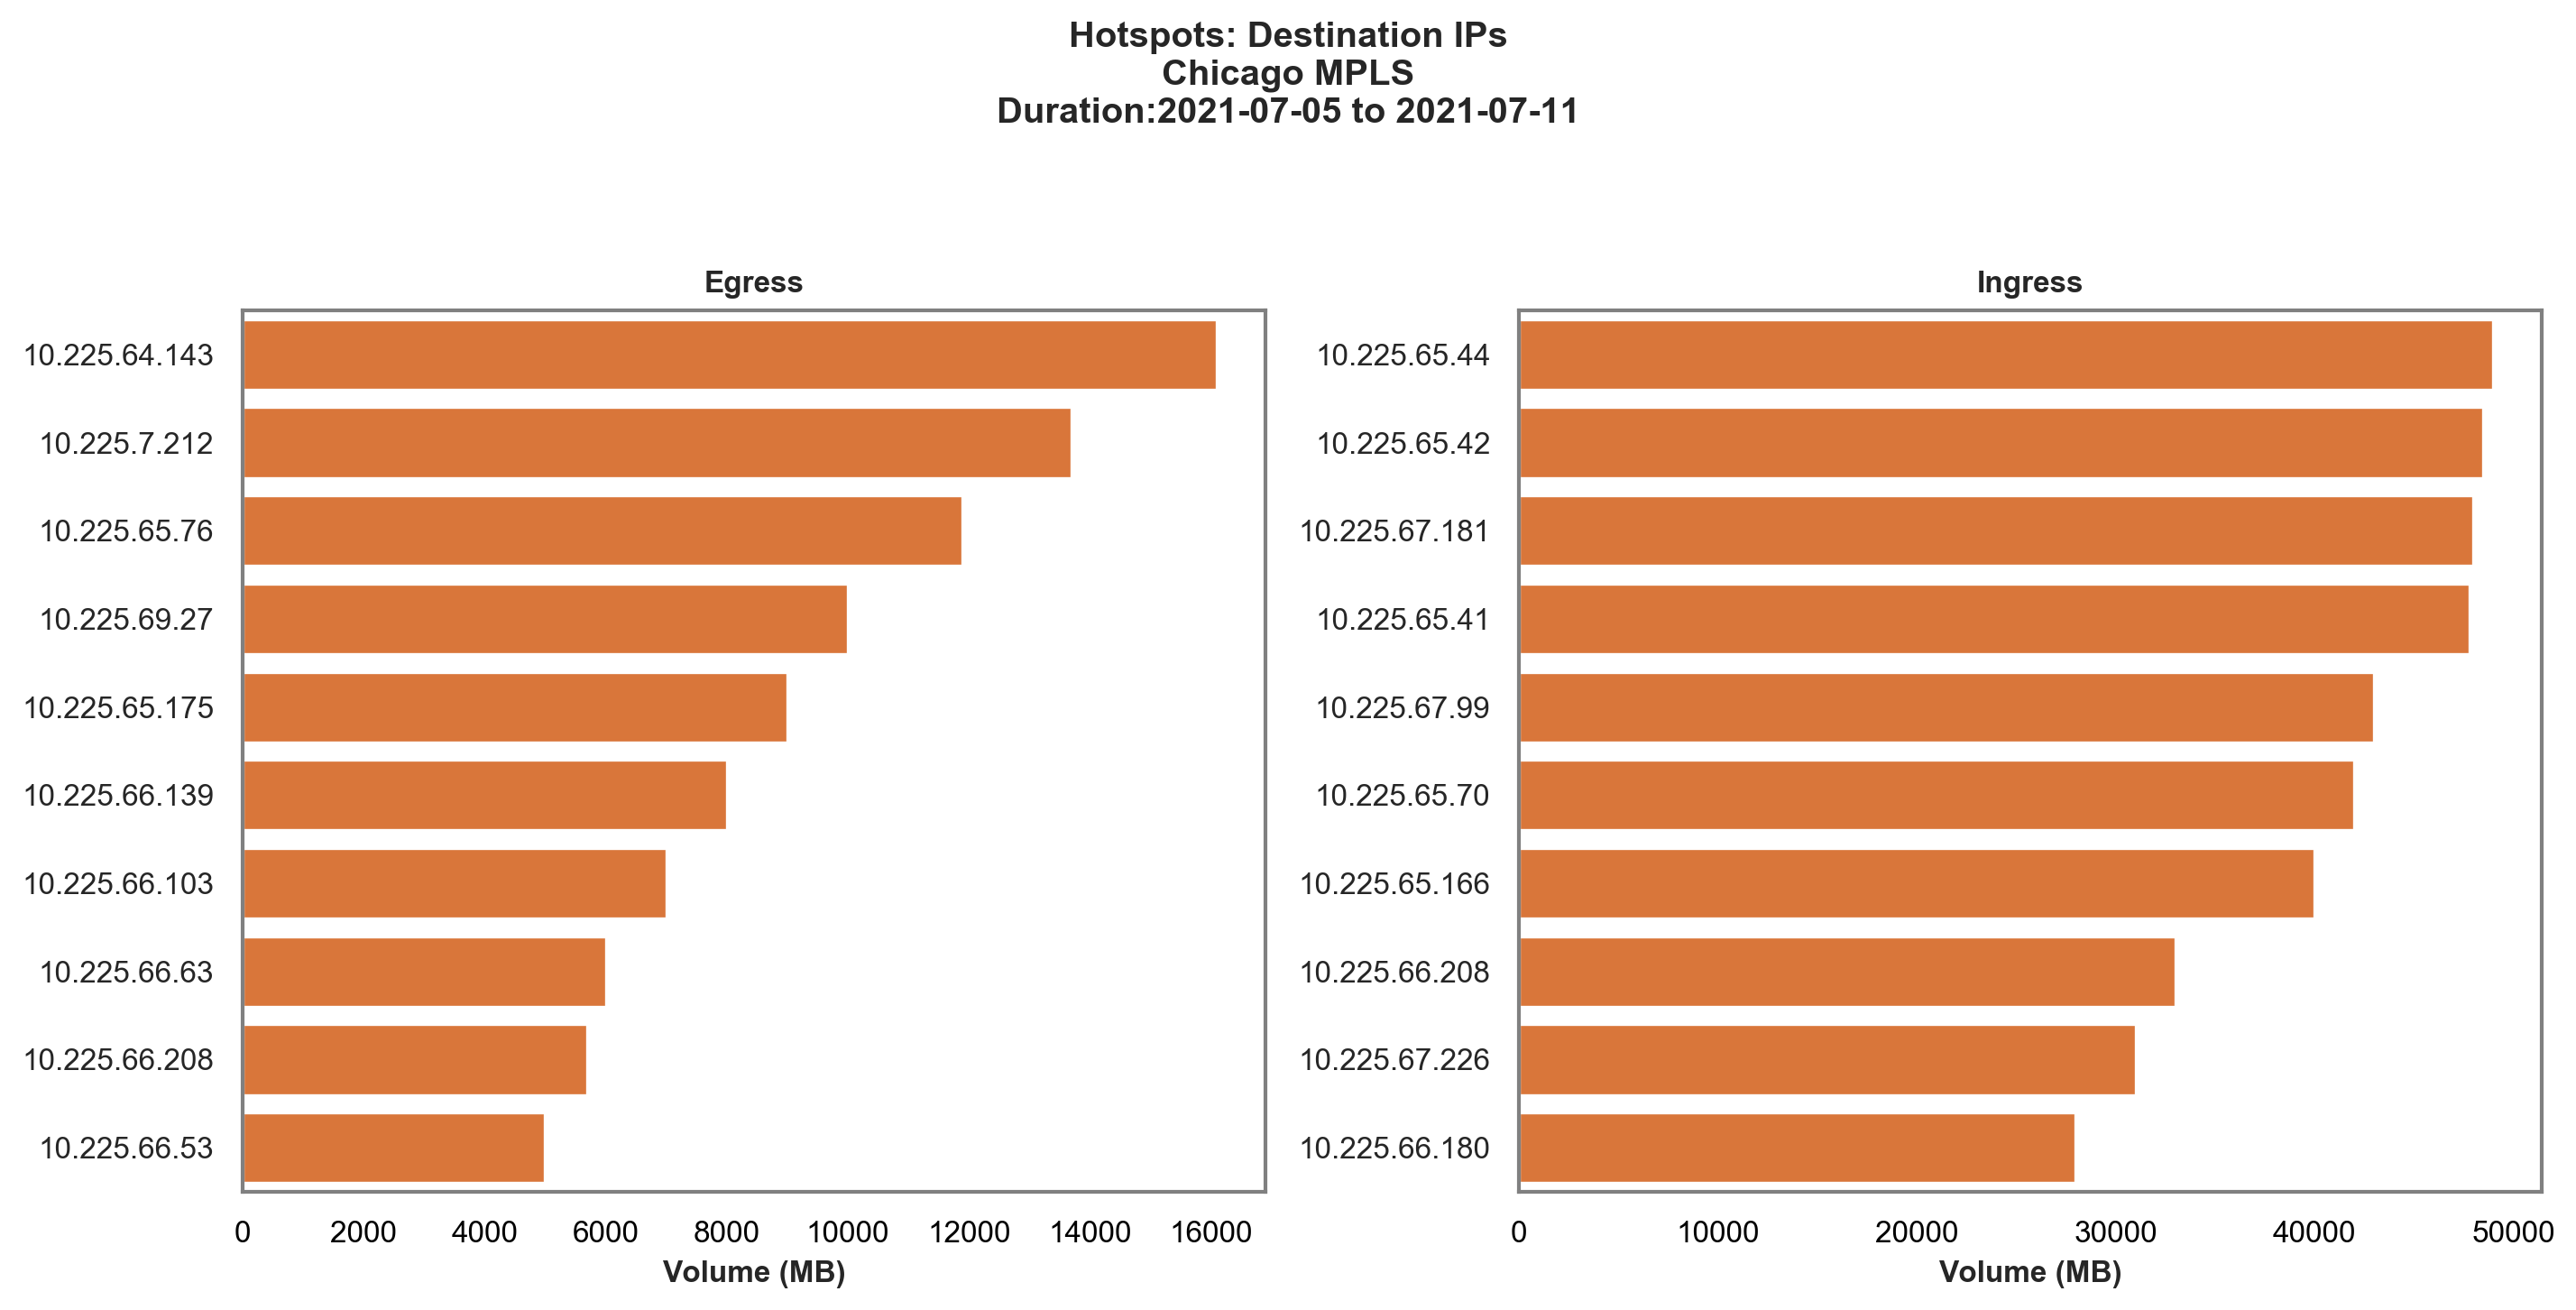
The
sample chart above lists the top 10 destination IP addresses accessed
when the MPLS link in Chicago was hot. |
| Hotspots: Undefined Domains | Lists the HTTP and SSL undefined domains
that you may observe during the hotspots. As these domains currently
do not map to any system or previously defined custom application signatures,
you may not be able to service them appropriately. Instead, you
may observe the domains match the flow of the generic application
signatures of enterprise-SSL, enterprise-HTTP, HTTP, or SSL. This
report is useful to correlate with the Hotspots: Application report,
especially when the top application is a generic one like enterprise-http
or enterprise-ssl. With these domains, an administrator will have
enough information to create a custom L7 application definition
and apply unique QoS, path, or security policies to these flows
as needed, or at a minimum, define an application for purposes of
utilization tracking and performance. 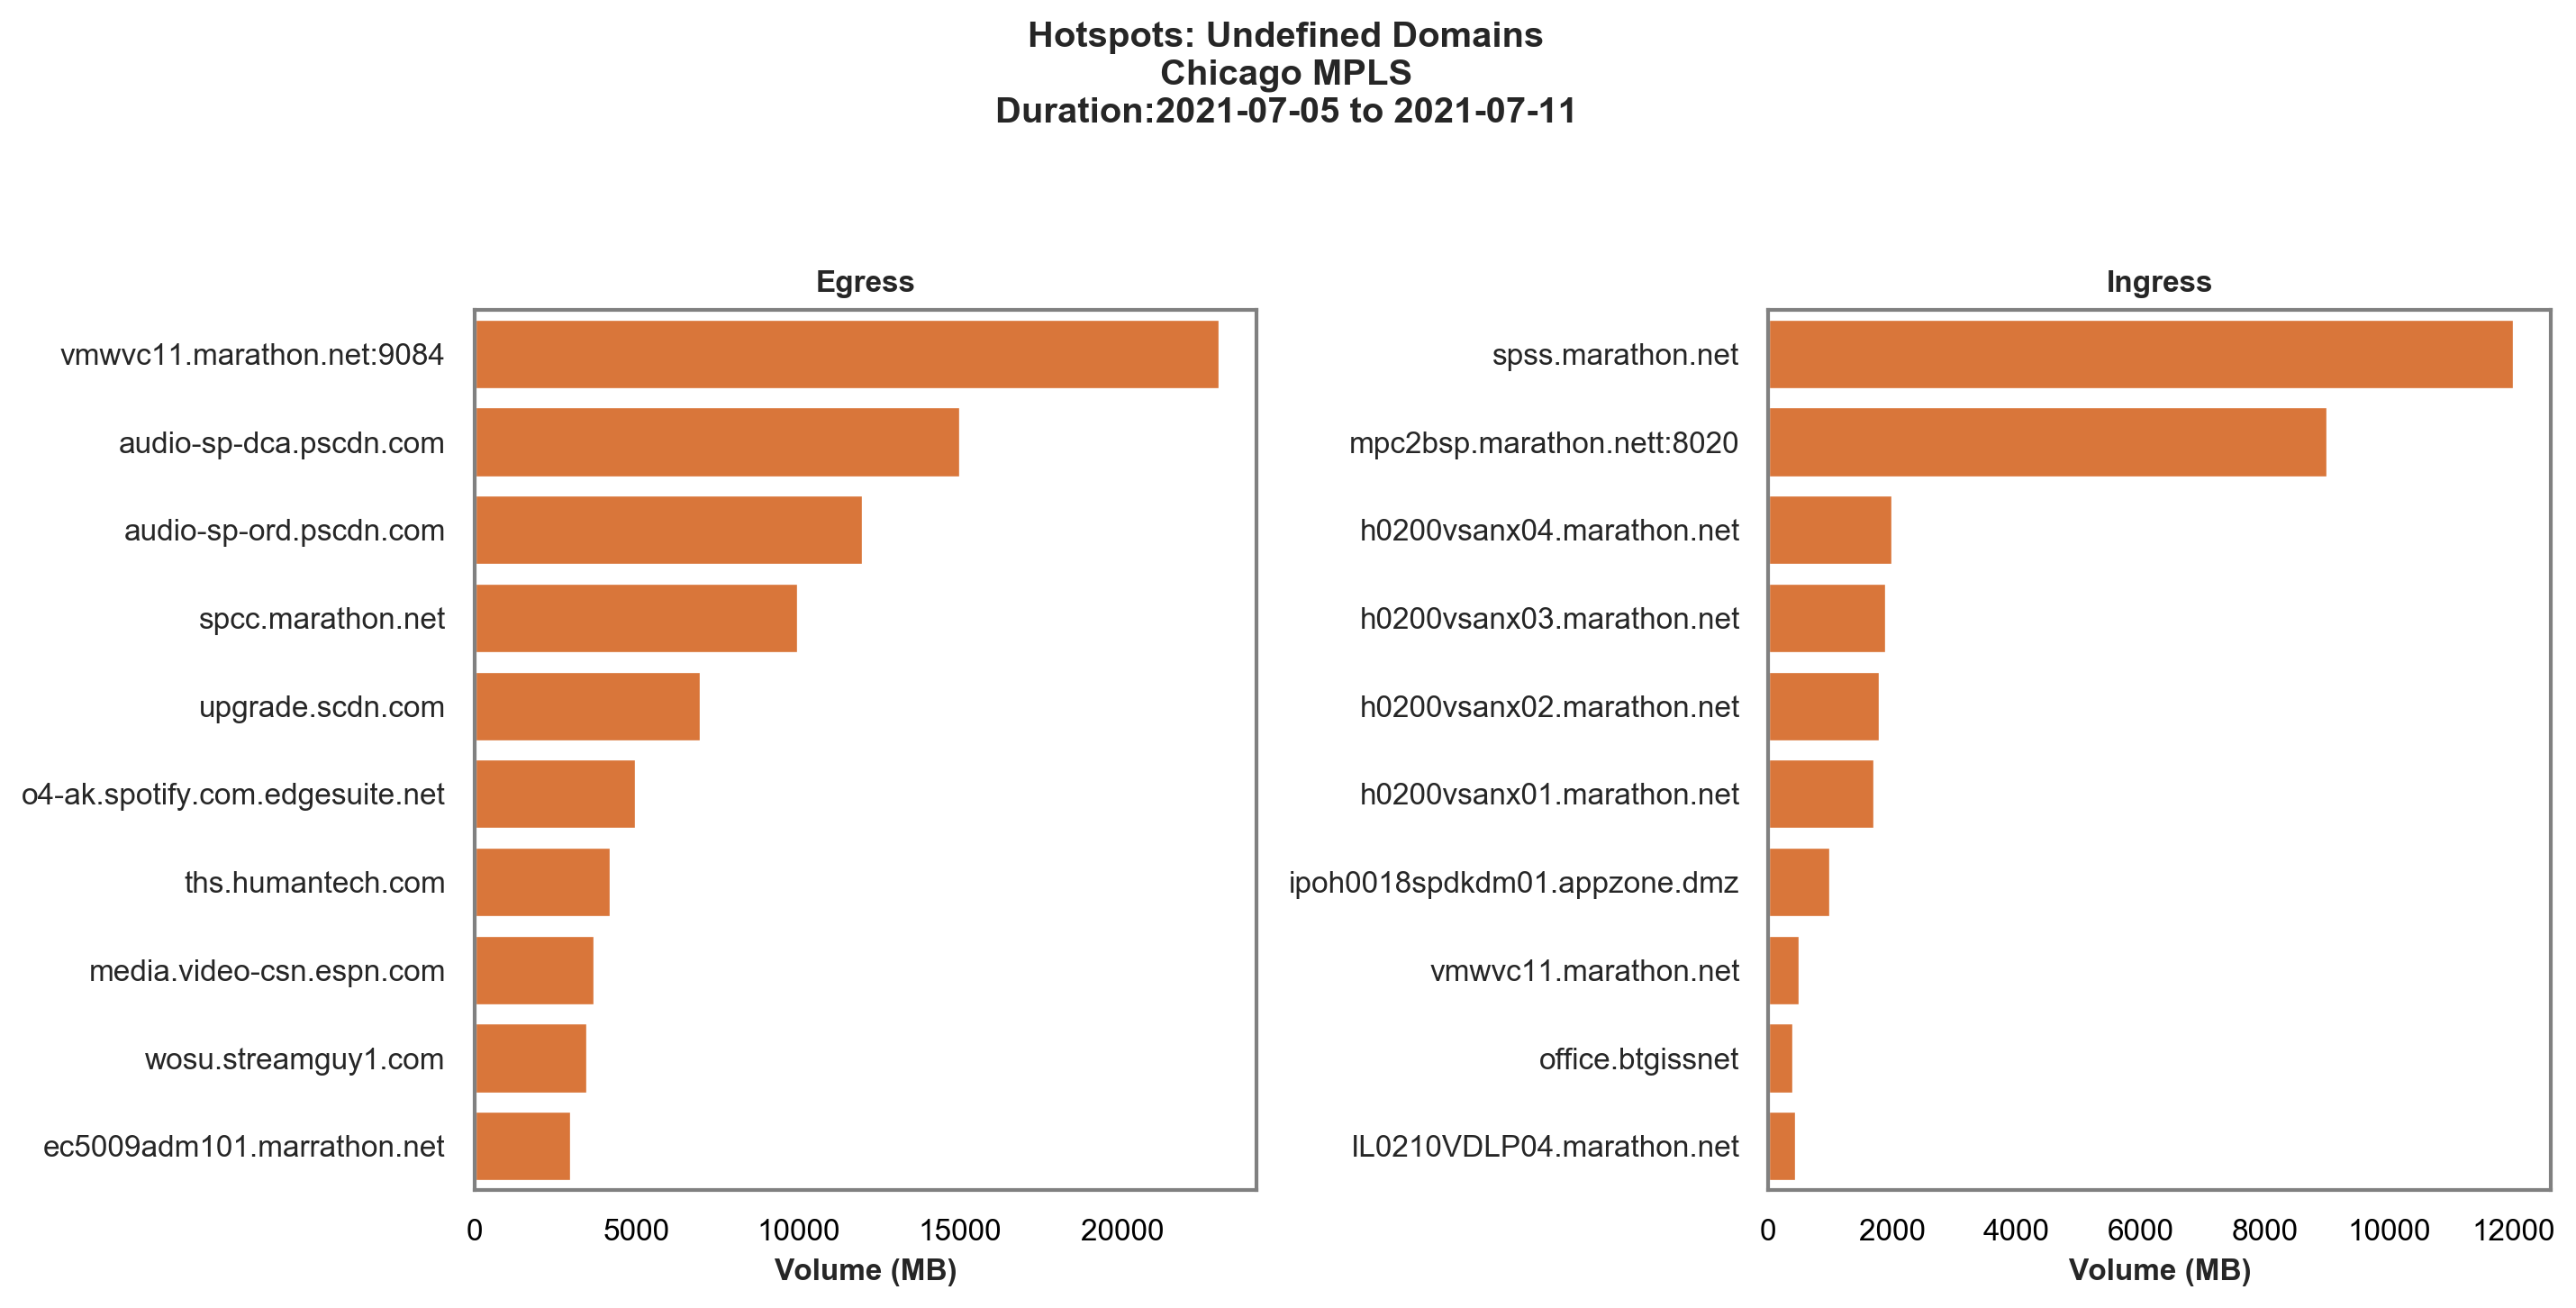
The
sample chart above lists the top 10 domains accessed when the MPLS
link in Chicago was experiencing a hotspot in either the ingress
or egress direction. |
| Hotspots: Source IPs | Helps you understand the consumption from
an end user’s perspective. It sheds light on the top bandwidth consumers
from a source IP perspective during the observed hotspot periods. This
information can help filter out sources that may contribute to the
unnecessary load on the circuit. For example, a server that is unscheduled
to run backup replication jobs during regular business hours. 
The
sample chart above lists the IP addresses of the top 10 users who
were active when the MPLS link in Chicago was experiencing a hotspot
in either the ingress or egress direction. |
| Hotspots: Source IP – Destination IP Pairs | While the previous Hotspot reports provided
visibility into the most-active origin and endpoints when the link
was hot, this report, Hotspots: Source IPs and Destination IPs,
lists the most active source-destination IP pairs. This report
helps determine if the same set of source and destination IP pairs
contribute to the contention week after week. 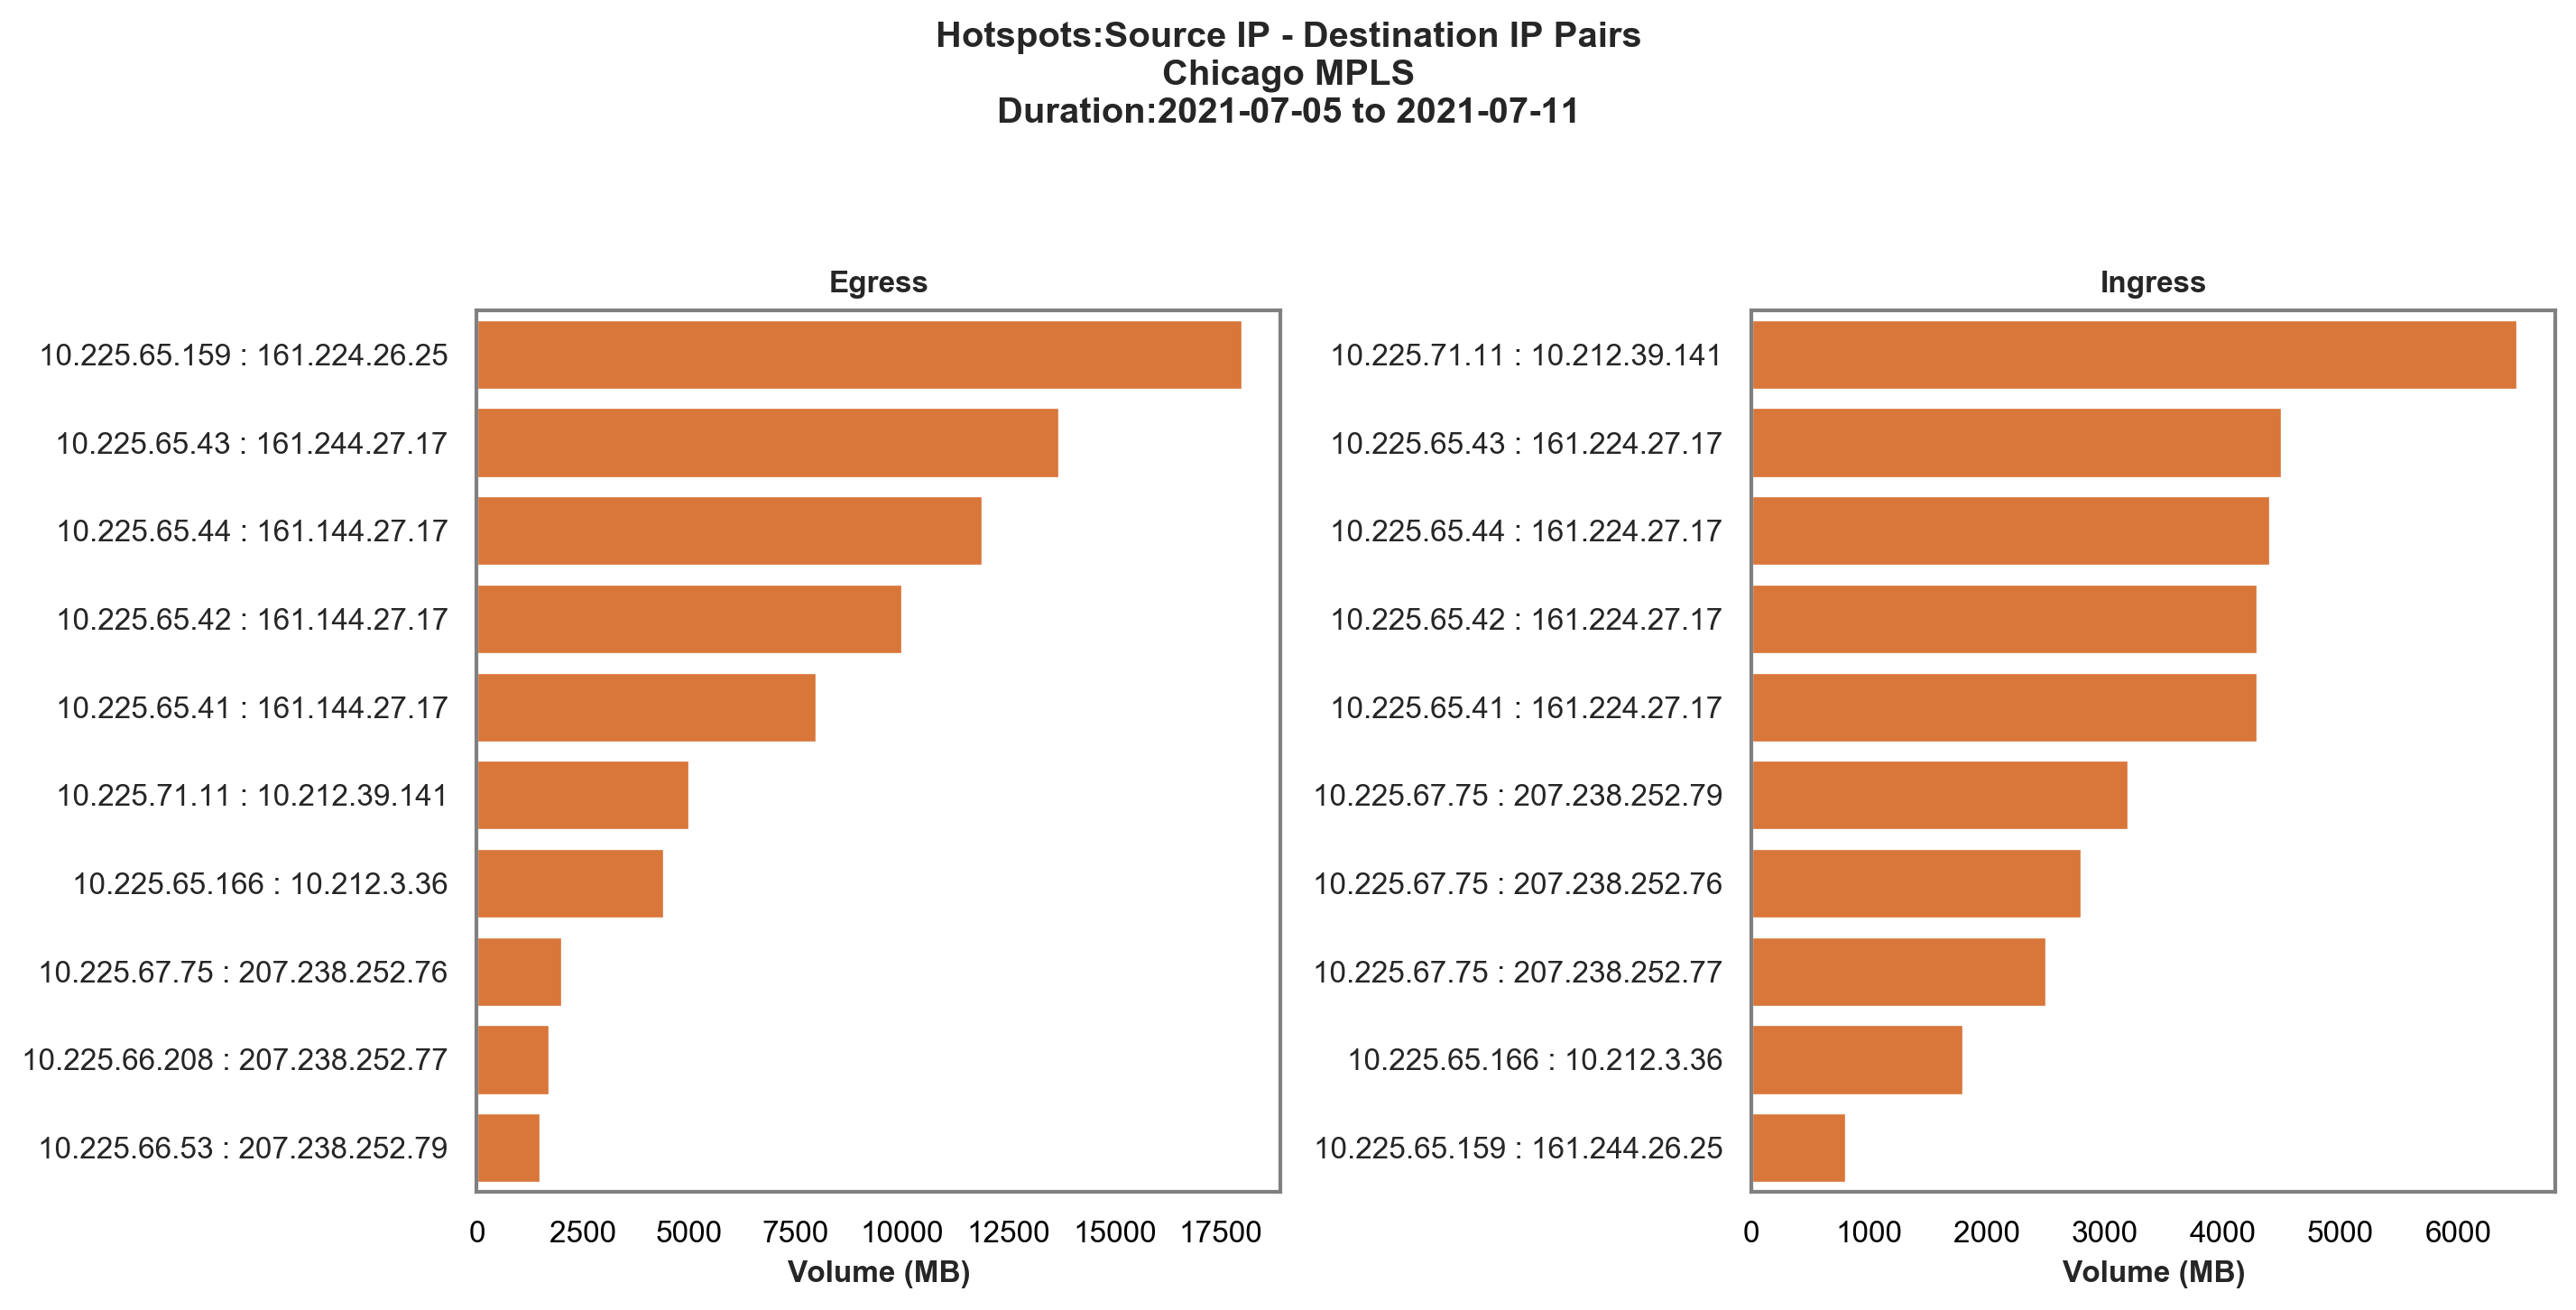
The
sample chart above lists the top 10 source and destination IP pairs
that were active when the MPLS link in Chicago was experiencing
a hotspot in either the ingress or egress direction. |
Top N
Top N reports are a set of reports
that provide insight into the top applications, source IPs, destination IPs,
source and destination IP pairs, and undefined domains for the entire
week. You may view these reports at a site level. They include a
chart listing the top 10 of each category and a companion CSV file
with information about all the contributors in that specific category.
The charts are generated for the top 10 largest sites by volume.
You can preview these charts. You can use insights from this report
to understand site-specific trends and turn them into actions such
as changing path policies, changing application priorities, and
reassessing the provisioned bandwidth for over-subscribed and under-utilized
circuits.
Unlike the Hotspots report,
which only looks at flows that traversed the network during periods
of hotspots, the Top N reports study flow and application data for
the entire week to determine which applications, users, and domains contribute
the most to high bandwidth utilization.
As shown in the previous
sections, sample reports for the Chicago branch for the same week
are listed below.
| Top N Report | Description |
|---|---|
| Top N: Applications | Lists the top applications for the entire
week and is not limited to hotspots. You may generate this report
per site, unlike the Hotspots Application report,
which is specific to periods of hotpots (utilization over 70%) on
a particular circuit. 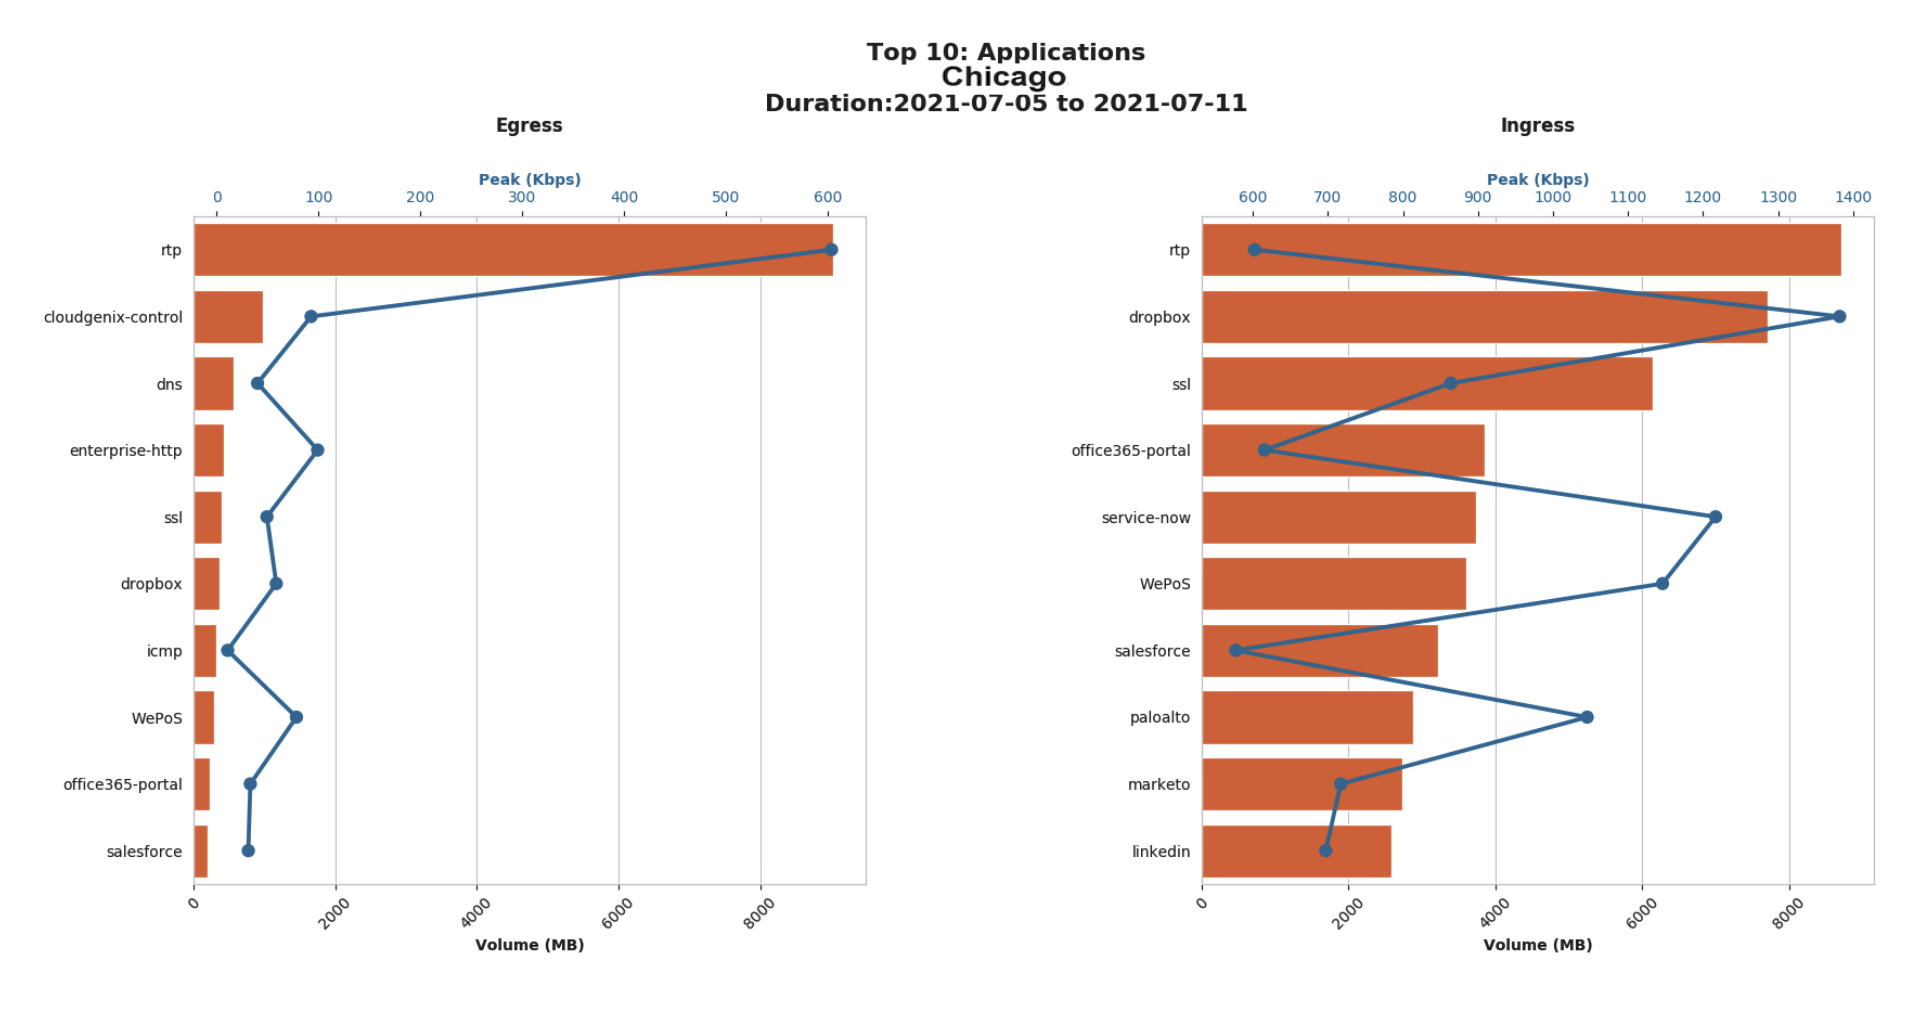
The
sample chart above lists the top 10 applications for Chicago across
all circuits for the week. Note that a similar set of applications
are listed for the Hotspot: Applications chart for the Chicago MPLS
circuit. This indicates that further refinement of application definitions
is required, with possible path, QoS, and security policies. |
| Top N: Source IPs | Lists the top source IPs for the entire
week and is not limited to hotspots. You may generate this report
per site, unlike the Hotspots Source IP report,
which is specific to periods of hotpots (utilization over 70%) on
a particular circuit. 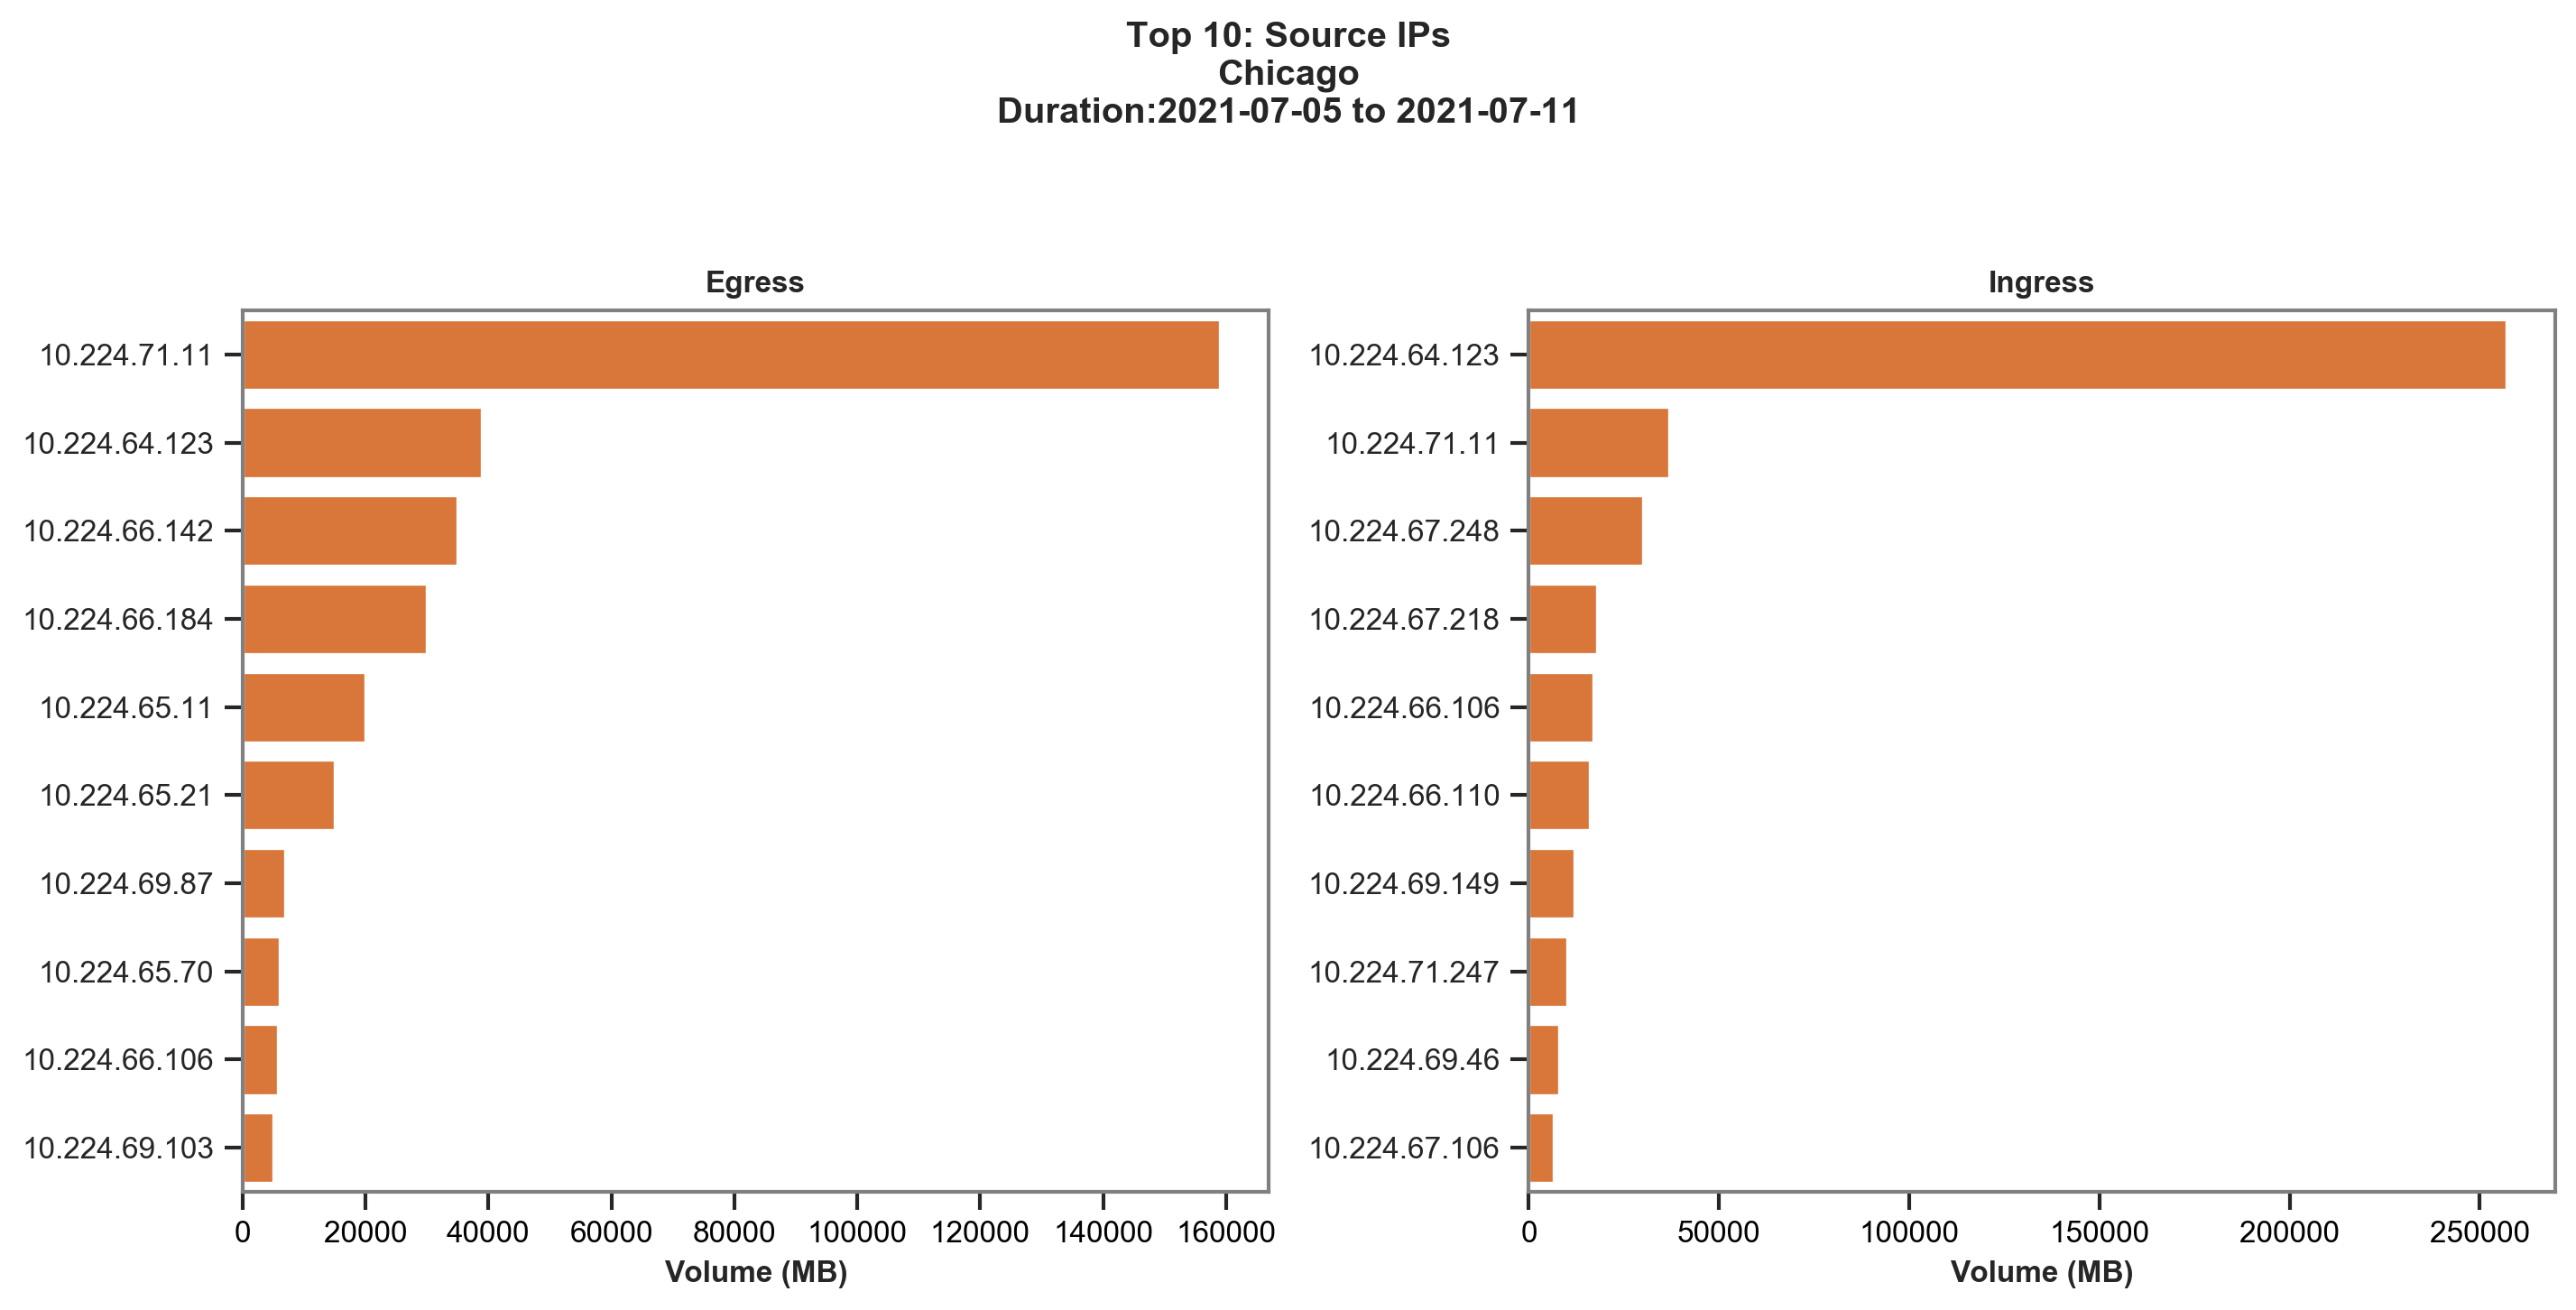
The
report above was generated for Chicago for the same duration as
the Hotspots Source IP report, as shown in an earlier section. Note
that top users for the week vary from the top users during hotspots.
Suppose there is an overlap with the Hotspots Source IP report.
In that case, a possible conclusion could be that the end user experience
was impacted, which could have affected Application SLAs. |
| Top N: Destination IPs | Lists the top destination IPs for the entire
week and is not limited to hotspots. You may generate this report
per site, unlike the Hotspots Destination IP report, which
is specific to periods of hotpots (utilization over 70%) on a particular
circuit. This report helps understand the destination of
most traffic during the week. One potential use case for this information
could be the flagging of anomalous or ill-intended destination IPs. 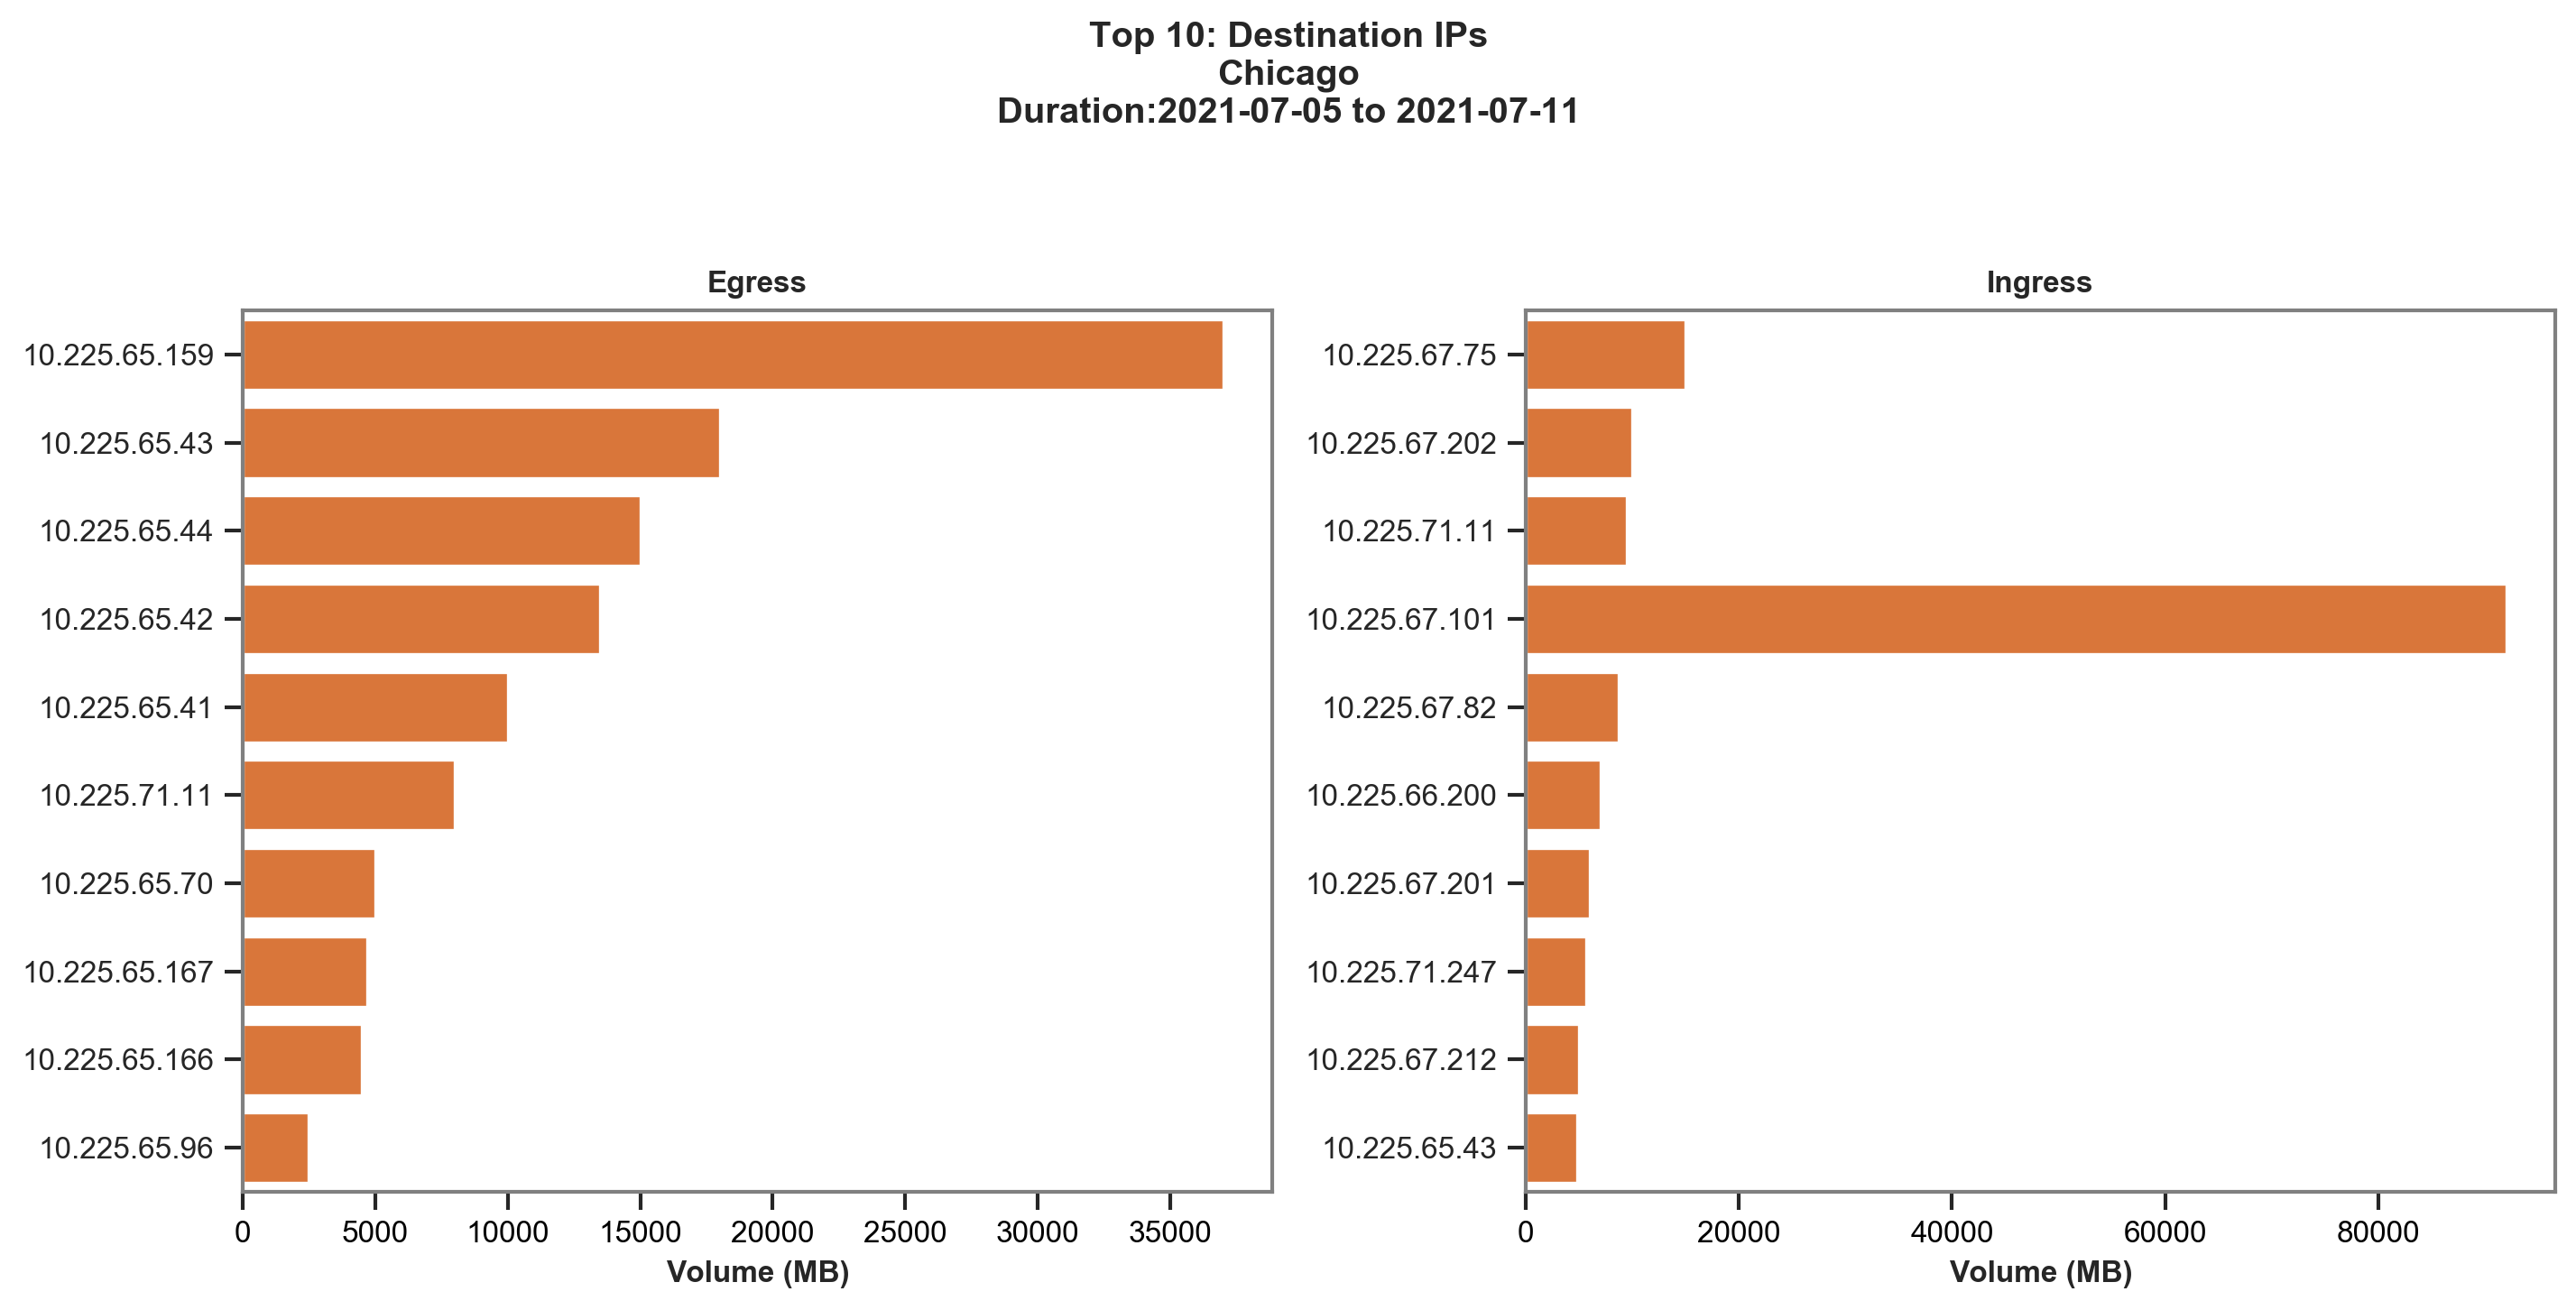
The
report above lists the top 10 destination IP addresses for the Chicago
branch for the same duration as analyzed in the Hotspots Destination
IPs report in the earlier section. Notice there are some overlapping
IP addresses between the two reports, which could prompt an administrator
to create one or more custom applications to track performance and
utilization for these highly utilized destination IP addresses. |
| Top N: Undefined Domains | Lists the top HTTP and SSL domains accessed
per site during the week. These domains currently do not map to
any system or previously defined custom application signatures,
and therefore may not be appropriately serviced. Instead, you may observe
these domains in flows that match the generic application signatures
of enterprise-SSL, enterprise-HTTP, HTTP, or SSL. This report
helps identify missing domains for existing custom applications
or indicates a need to create new custom applications. 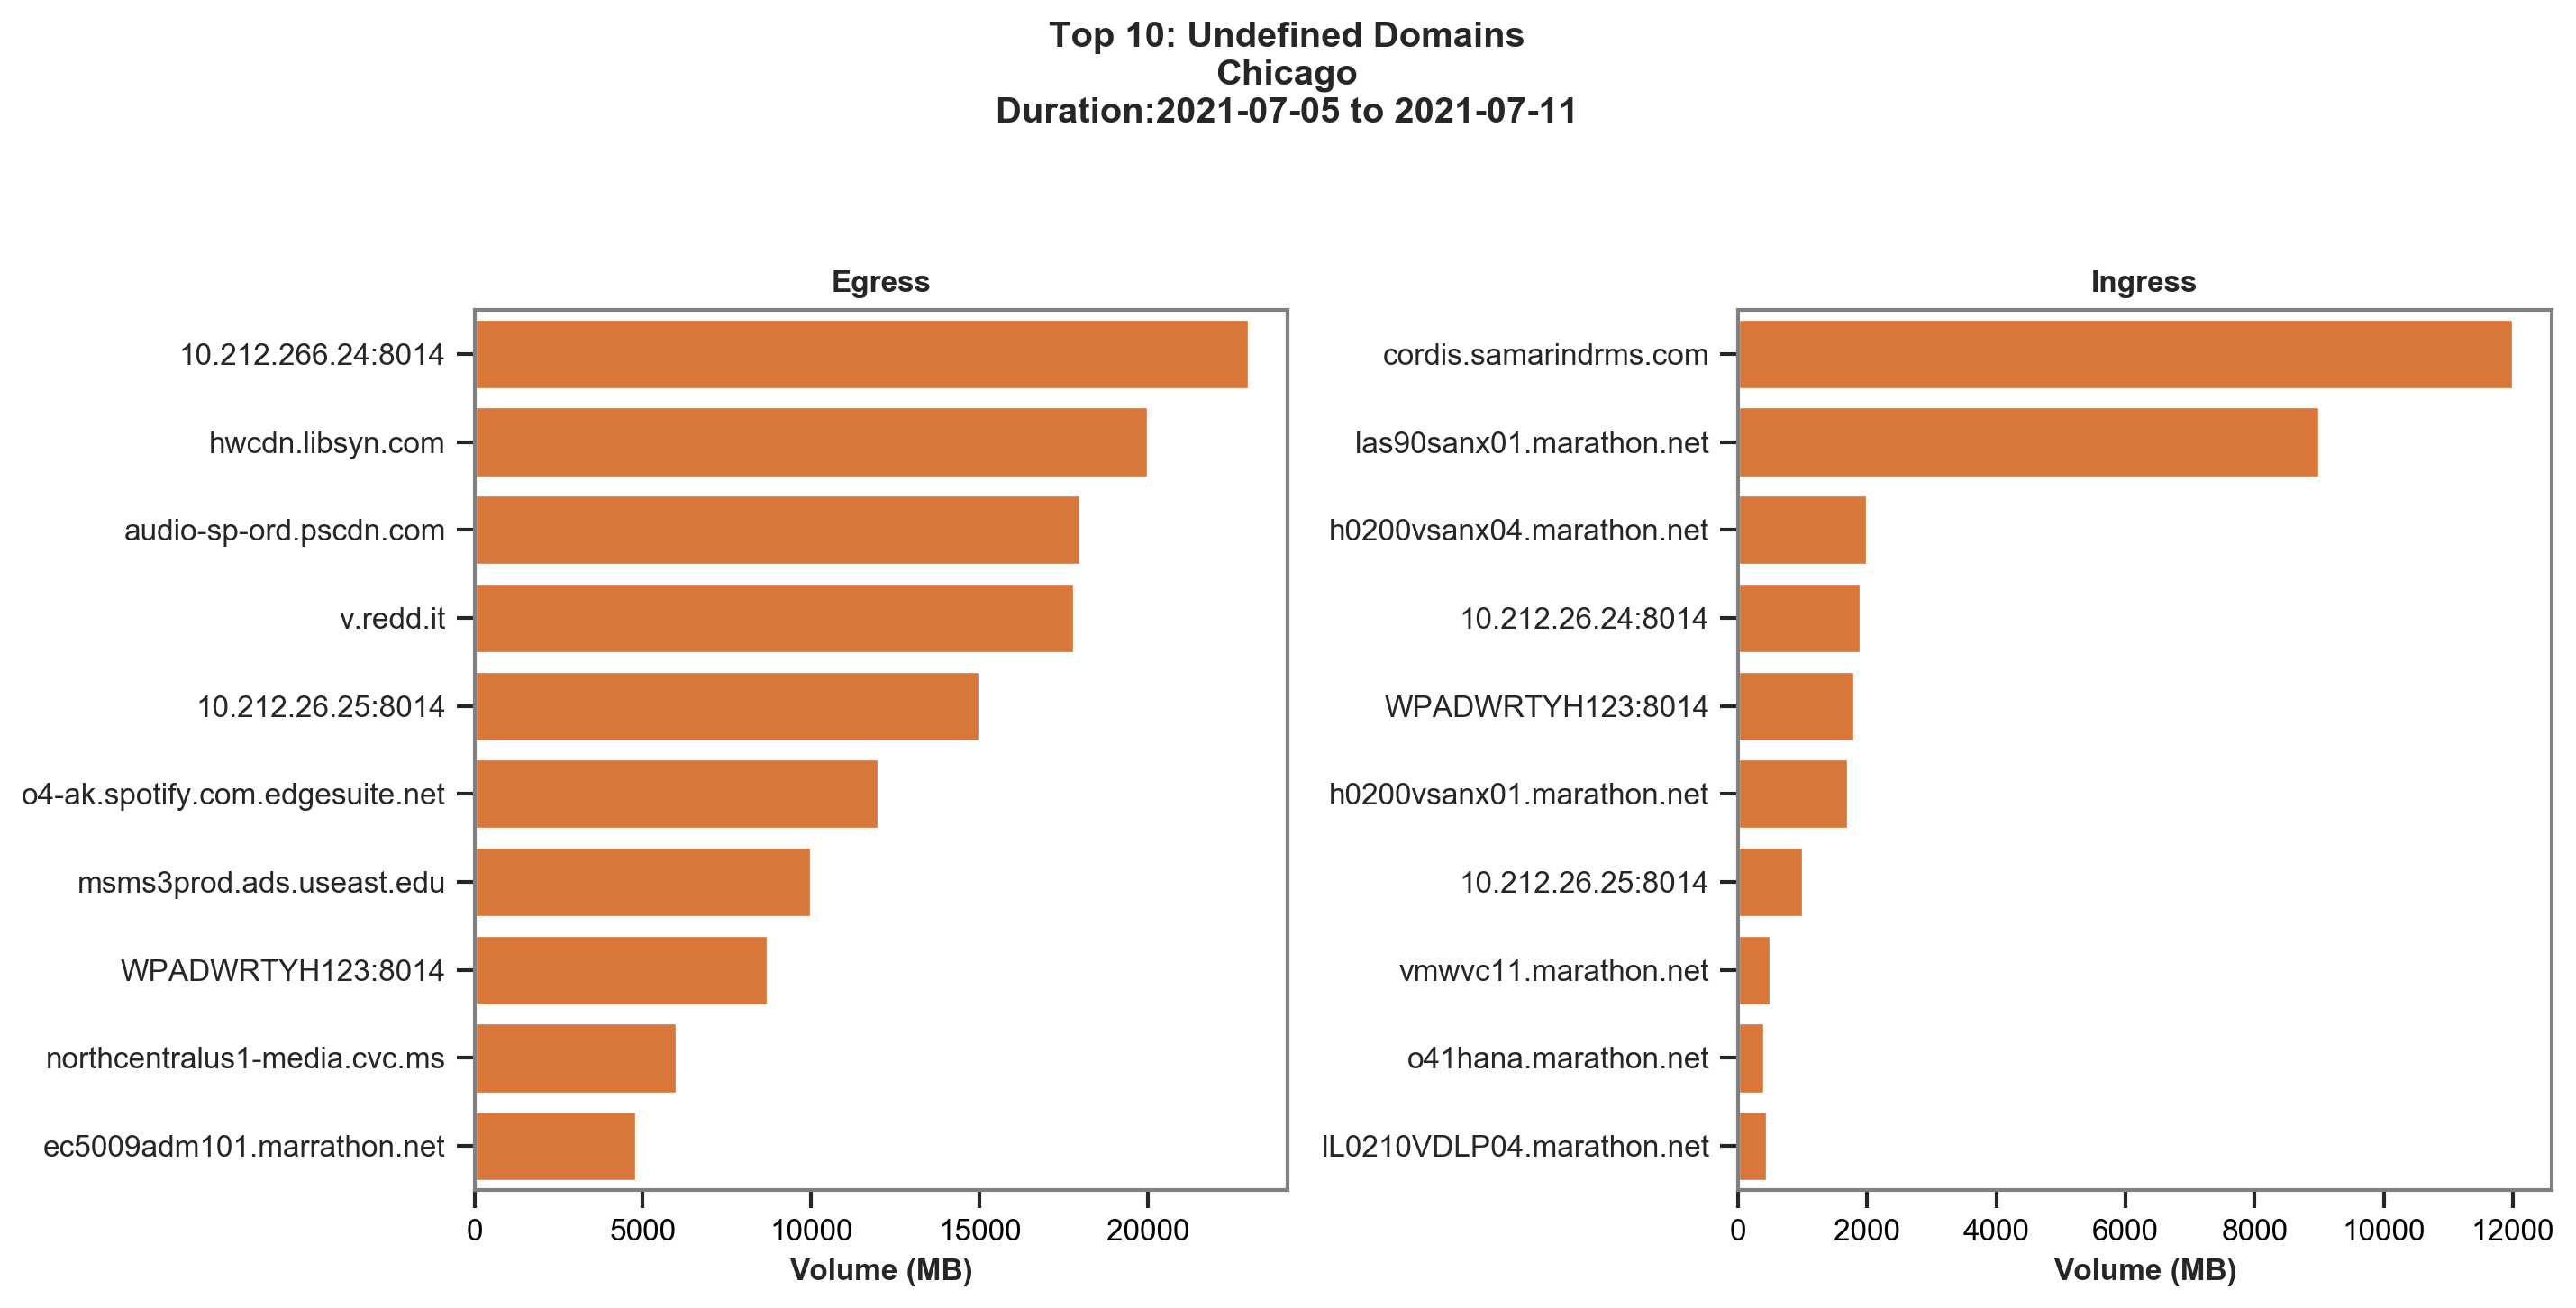
The
image above lists the top 10 domains at the Chicago branch. If significant
traffic to 10.212.26.24 is observed week after week, an administrator
should assess if this domain belongs to an existing application.
If not, it is recommended that a custom application be created for
this domain to appropriate tracking and policy treatment. |
Application Volume per Circuit
The Application Volume per
Circuit reports list the total volume of application
data transferred per circuit and provide this information in a CSV
file format. The report helps understand how traffic is shaped and
how application traffic is load-balanced across different available
paths.
This data helps redefine path policy. A significant
use case is studying application data on metered links. If applications
other than mission-critical applications are visible on these links,
they can cause unnecessary tariffs on these metered links. An application policy
for these links can be re-written to remove the metered link as
a possible option in such an event.
WAN Clarity Data Center Reports
Learn about the WAN Clarity Data Center reports.
The Data Center reports
provide an insight into utilization trends from a Data Center perspective.
Similar to the branch reports, these reports identify top applications,
source IP addresses, destination IP addresses, source-destination
IP address pairs, and undefined domains along with top branches. You
can generate this set of reports for hotspots observed in the data
center.
It is important to note that a hotspot definition
for a data center differs from that for a branch. While for branches,
utilization over 70% of configured bandwidth is considered a hotspot,
for a data center, you may consider 90th percentile utilization
as a hotspot. It, therefore, becomes imperative that you accurately
set the circuit bandwidth allocations at the data center. These
reports provide an approximation of the utilization trends as the
reports generated only consider overlay paths.
In summary, the WAN Clarity Report generates every week to help
you understand how the circuits in the Prisma SD-WAN AppFabric can
be utilized from an entire fabric, site, circuit, application, and
user perspective. These reports provide actionable insights that
you can use for capacity planning, path policy adjustments, QoS
policy adjustments, and enforcement of proper use of network resources
by the end-user community.
The following sections describe the data center reports in the
WAN Clarity Reports in more detail.
Traffic Distribution
The Traffic Distribution report helps administrators
understand traffic volume distribution to all the data centers in
the AppFabric. These reports help understand traffic flow from branches,
applications, and top applications from top branches to and from
the data centers in the form of Sankey charts. These reports deliver
an HTML report with Sankey charts for the top 10 contenders and
a CSV file with the entire dataset.
Traffic
Distribution: Top Applications Report
Provides details
into the flow of application traffic to and from all the data centers
in the AppFabric. It provides visibility into the top 10 ingress
and egress applications by volume.

The
HTML report also provides an insight into top applications by total
volume across all the DCs in the form of a Combined Egress and Ingress
traffic report.

In
the examples above, there is only a single data center: DC1. The
data flow label above the data center block indicates traffic flow,
either to or from that data center.
In the case of multiple
DCs, you may decipher the traffic volume going to each of the data
centers from the flow stream's thickness. The supplemental CSV can
help understand the accurate distribution of application traffic
volume across the data centers.

See
the sample report below:


Traffic
Distribution: Top Branches Report
Provides details into
the flow of branch traffic to all the data centers in the AppFabric.
It provides visibility into the top 10 ingress and egress flows
from branches by volume and a combined summary report.


Traffic
Distribution: Top Applications from Top Branches
Provides
details into the top 10 applications emerging from the top 10 branches
to all the data centers in the AppFabric. The report provides visibility
into top ingress and egress branches and the top applications' flow
by volume emerging from these branches.


Circuit Utilization
The Circuit Utilization report
provides the utilization summary for all DC circuits on both the
ingress and egress directions. The circuit utilization report consists
of raw data packaged in CSV files that have information on circuit utilization
data and percentile utilization. The report package also contains
an HTML report for each DC circuit.
The HTML report contains
a series of topics that shed light on the bandwidth utilization,
observed hotspots, branches, applications, source IPs, destination
IPs, and unknown domains contributing to those hotspots. We classify
a circuit to be hot when the utilization is at the 90th percentile.
The report provides a summary of the circuit configuration and bandwidth
utilization in the form of provisioned bandwidth, median utilization,
and 90th percentile utilization.
The Circuit Utilization report
summarizes the circuit configuration and bandwidth utilization in
the form of provisioned bandwidth, median utilization, and 90th
percentile utilization.

The
table above is from a report for DC1 - Circuit, where the 90th percentile
utilization is at 5.33595% of the provisioned bandwidth, indicating
that the circuit is not contentious and possibly overprovisioned.
The
Circuit Utilization report then plots the utilization trend for
the past week in an interactive chart that can zoom in and study
the trend in detail. It also marks the 90th percentile utilization
and highlights hotspots in red.

In
the sample report above, the utilization above 53.35951 Mbps, as
mentioned in the table, is highlighted in red as possible hotspots.
The
circuit utilization report then highlights the top branches, applications,
source IPs (branch IPs for ingress reports), destination IPs (branch
IPs for egress reports), IP pairs, and undefined domains contributing
to the hotspot. The sample reports below highlight the top contributors
to the hotspots for DC1 – Circuit 1.
Hotspot Reports
The Hotspot reports
generated for every DC site circuit give us visibility into the
circuit’s 90th percentile utilization. The reports provide a list
of branches, applications, undefined domains, destination IPs, source
IPs, and source and destination IP pairs observed during the hotspots.
| Hotspot Report | Description |
|---|---|
| Hotspot: Top Branches | Highlights the traffic volume contributed
by the top 10 branches during the hotspot observed on the DC circuit. Use
data from this report to redefine data center transit features under
path policies for branches. Top branch transmitting traffic
on this circuit when utilization is above the 90th percentile is
shown below: 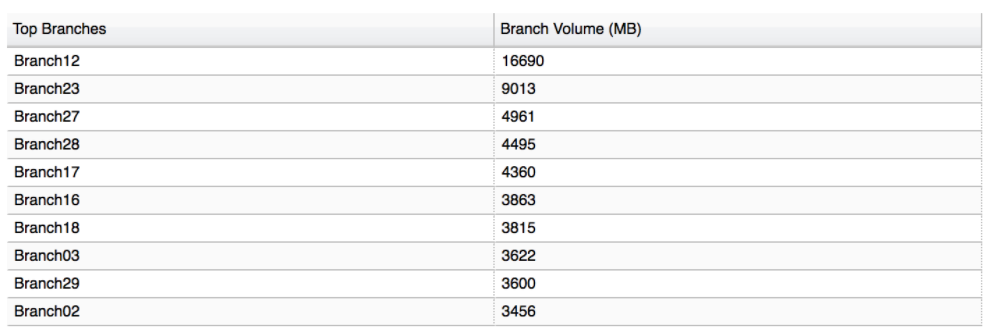
|
| Hotspot: Top Apps | Highlights the top 10 applications contributing
to the hotspot observed on the DC circuit over the course of the week. Use
data from this report to redefine path policies for applications
that may directly offload to the internet. This report can also
help network administrators redefine application priority to apply
the right QoS to frequently used applications. Top applications
receiving traffic on this circuit when the utilization is above
the 90th percentile is shown below: 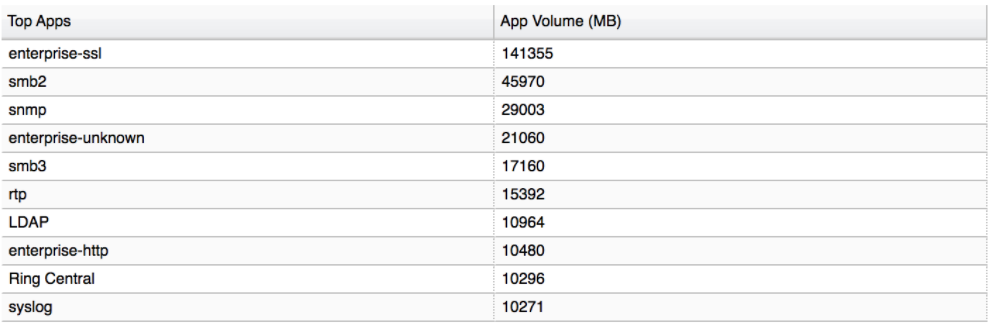
|
| Hotspot: Top Undefined Domains | Highlights the top 10 undefined defined
domains contributing to the hotspot observed on the DC circuit over
the week. Use data from this report to redefine existing custom applications
or create new custom applications. Top undefined domains discovered
for apps http, ssl, enterprise-http, and enterprise-ssl, receiving
traffic on this circuit when utilization is above the 90th percentile
is shown below: 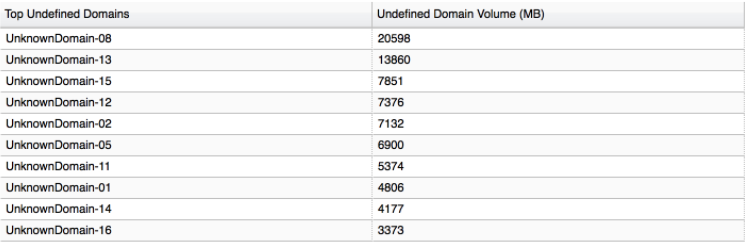
|
| Hotspot: Top Source IPs | Highlights the top 10 source IPs contributing
to the hotspot observed on the DC circuit over the week. For the
Ingress direction, these IPs are the Branch IPs. 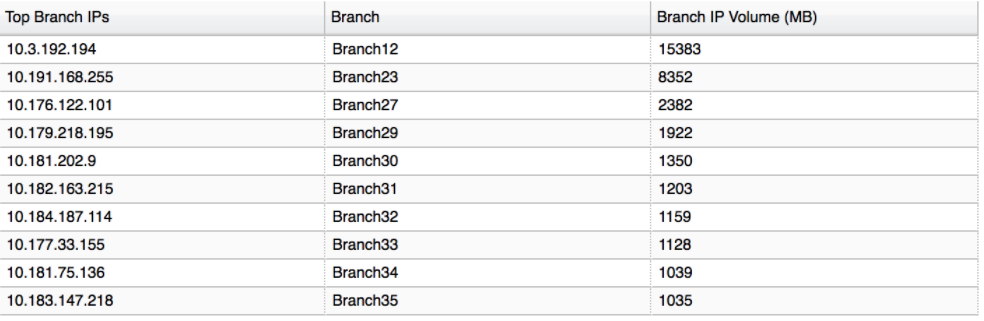
For
the egress direction, these IPs may identify as source IPs, i.e.,
indicating the origin being the data center. 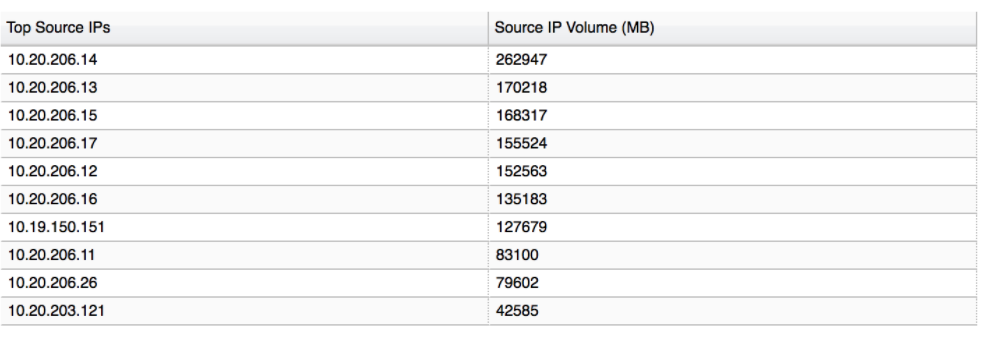
Use
data from this report to identify top contributors to the hotspot
on the DC circuit and establish proper network resource enforcement. |
| Hotspot: Top Destination IPs | Highlights the top 10 destination IPs contributing
to the hotspot observed on the DC circuit over the week. 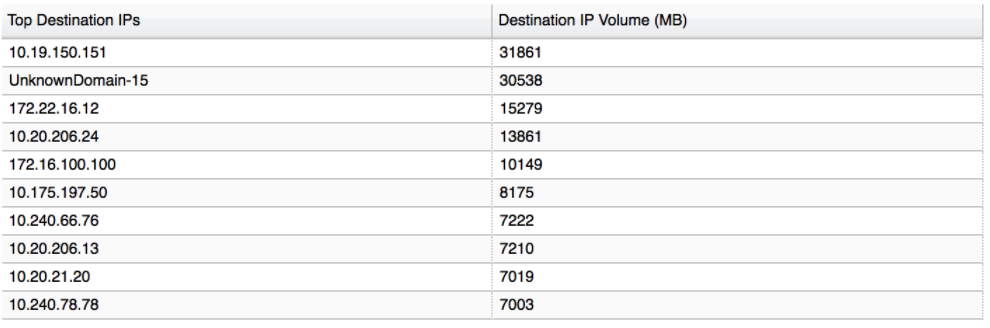
For
the egress direction, these IPs are the Branch IPs, indicating the
flow termination are branches in the App-Fabric. 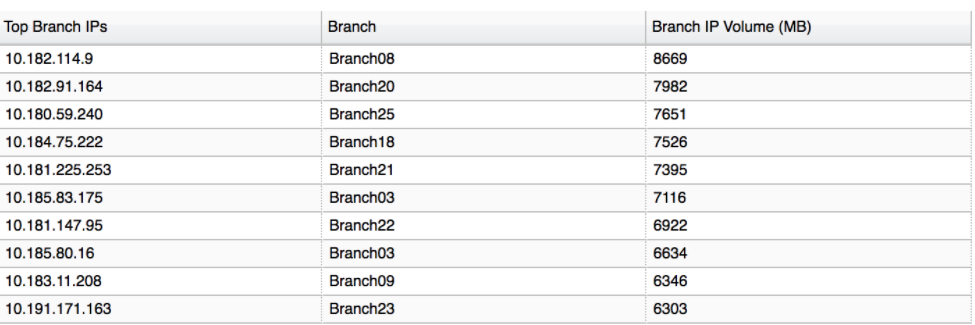
Use
data from this report to identify top contributors to the hotspot
on the DC circuit and establish proper network resource enforcement. |
| Hotspot: Top IP Pairs | Highlights the top 10 source and destination
IP pairs contributing to the hotspot observed on the DC circuit
over the week. 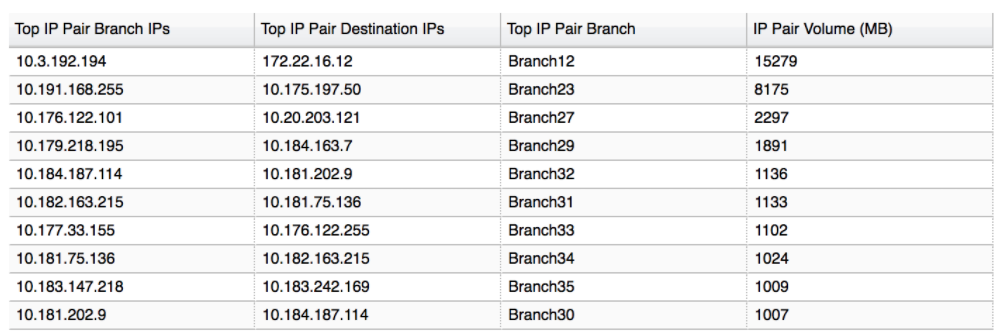
|
The Circuit Utilization report is generated
for both ingress and egress directions for each data center circuit.
It can assess utilization trends, refine path and QoS policies, and
identify users who are misusing network resources, enabling the
network administrators to enforce proper use of network resources.
Top N Reports
The Top N reports are
a set of reports that provide insight into the top branches, applications,
source IPs, destination IPs, source and destination IP pairs, and
undefined domains for the entire week. Generate these reports for
each data center in a CSV file with information about all the specific
category contributors.
Use the insights from this report to
understand site-specific trends and turn them into actions such
as changing path policies, changing application priorities, and
reassessing the provisioned bandwidth for over-subscribed and under-utilized
circuits.
Unlike the Hotspots report, which only looks at
flows that traversed the network during periods of hotspots, the
Top N report studies flow and application data for the entire week
to determine which applications, users, and domains contribute the
most to high bandwidth utilization.
WAN Clarity Aggregate On-Demand Bandwidth Reports
Learn about the aggregate on-demand bandwidth utilization reports in Prisma
SD-WAN.
Prisma SD-WAN is
a flexible license-based licensing model that helps enterprises adapt to varying
bandwidth requirements at branch sites caused by increasing cloud adoption, voice/video
applications consumption, and a hybrid workforce that invariably contributes to variable
traffic bursts and consumption.
WAN Clarity aggregate bandwidth reports provide visibility into bandwidth utilization
aggregated across all branches for monitoring and planning purposes.
The bandwidth utilization is measured as follows:
- All the ION devices report the ingress and egress bytes used every one minute.
- These one minute interval readings are combined into contiguous 5-minute blocks.
- The biggest 5-minute block is selected which becomes the basis to report aggregate bandwidth for a specific 24-hour period.
- The utilization is measured based on the total cumulative/aggregate bandwidth (ingress+egress) passing through the ION device across WAN interfaces (ingress/egress) during a designated period of time.
- The information is displayed on a monthly basis.


