Prisma Access Agent
Collect Diagnostics On-Demand
Table of Contents
Collect Diagnostics On-Demand
Learn how to trigger the collection of diagnostics for endpoint troubleshooting
through administrator-initiated on-demand collection.
| Where Can I Use This? | What Do I Need? |
|---|---|
|
|
The endpoint insights feature in Prisma Access Agent supports the on-demand
collection of diagnostics to help troubleshoot agent and endpoint issues. As an
administrator, you can remotely collect comprehensive diagnostic data including
logs, agent status, and system information at any time without any end-user
involvement.
When you trigger a diagnostic session, the system automatically captures a complete
snapshot of the endpoint's current state including tunnel status, gateway
information, session duration, MTU settings, and operating system details. The
system will also simultaneously collect delta logs from the previous 10 minutes to
preserve critical troubleshooting context.
To initiate on-demand diagnostics collection:
- In Strata Cloud Manager, select ConfigurationEndpoint Management.In the Devices table, navigate to the device for which you want to trigger the collection of diagnostics, select the check box next to the device, and select ActionsCollect Diagnostics.
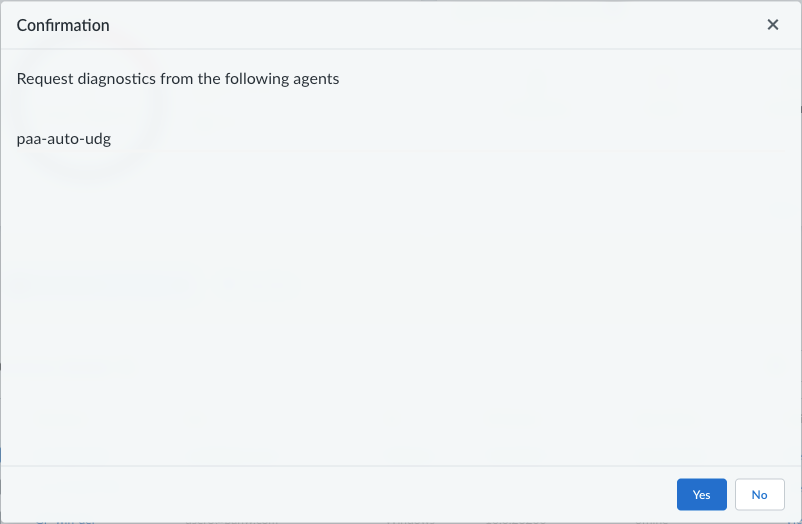
![]() Click Yes in the confirmation dialog.
Click Yes in the confirmation dialog.![]() The Jobs button appears or changes to indicate that the collect diagnostics job has been added to the queue.
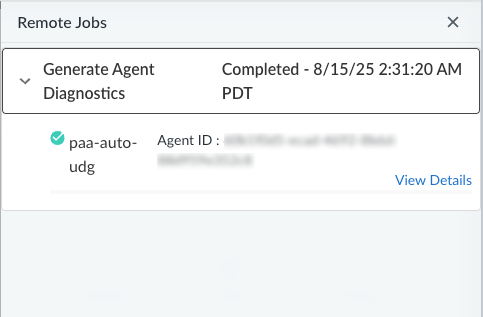
The Jobs button appears or changes to indicate that the collect diagnostics job has been added to the queue.![]() To view the status of the diagnostics collection job, click Jobs. The status of the job appears in the Remote Jobs window.
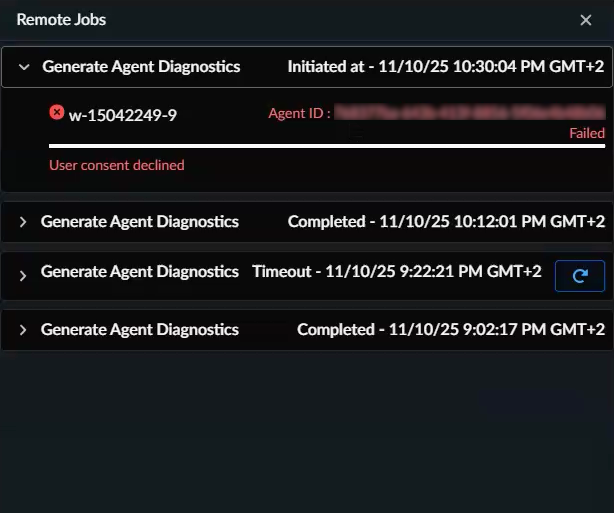
To view the status of the diagnostics collection job, click Jobs. The status of the job appears in the Remote Jobs window.![]() (Prisma Access Agent 25.7) (Panorama managed deployments) If you configured Prisma Access Agent to require user consent for diagnostics collection, the job will begin after the user consents. If the user denies the request, the job fails and the following message appears:
(Prisma Access Agent 25.7) (Panorama managed deployments) If you configured Prisma Access Agent to require user consent for diagnostics collection, the job will begin after the user consents. If the user denies the request, the job fails and the following message appears:![]() Select View Details to open the Insights window for the selected device, where you can view and analyze the diagnostics that you generated.
Select View Details to open the Insights window for the selected device, where you can view and analyze the diagnostics that you generated.


