Prisma Access Agent
View and Analyze Endpoint Insights
Table of Contents
View and Analyze Endpoint Insights
Learn how to access, view, and analyze endpoint insights collected by Prisma Access Agent.
| Where Can I Use This? | What Do I Need? |
|---|---|
|
|
Prisma Access Agent provides valuable endpoint insights to help you
troubleshoot and optimize your Prisma Access Agent deployment. By regularly
reviewing and analyzing the endpoint data, you can proactively identify potential
issues, streamline troubleshooting processes, and maintain optimal performance of
your Prisma Access Agent deployment.
Here's how you can access and analyze the diagnostic information:
- Access diagnostic data.
- In Strata Cloud Manager, select ConfigurationEndpoint Management.In the Devices table, navigate to the device for which you want to view the diagnostics, and select View Details in the Insights column.
![]() View the details of a specific diagnostic.
View the details of a specific diagnostic.- Select a diagnostic from the list of available diagnostics for the device. Each diagnostic contains a unique ID, an indicator of what triggered the diagnostic, and the timestamp when the diagnostic was captured.The following are examples of some possible triggers:
- Admin-Initiated—On-demand diagnostic collection initiated by the administrator
- (Prisma Access Agent 25.7) User-Initiated—On-demand diagnostic collection initiated by the user through user-initiated problem reporting
- Periodic Event—Periodic diagnostic collected once every 24 hours
- (Prisma
Access Agent 26.2) Event
Triggered—Event-triggered diagnostic collection
caused by the following predefined events:
- paa_agent_disabled_by_user—Event-triggered diagnostic collection caused by the user disabling the agent
- paa_connection_long_time_to_connect—Event-triggered diagnostic collection caused by a tunnel taking too long to connect
- paa_connection_ssl_fallback—Event-triggered diagnostic collection caused by tunnel fallback from IPSec to SSL
![]() You can view the diagnostic data in a couple of ways:
You can view the diagnostic data in a couple of ways:- To show the diagnostic data in the Endpoint Management window, select a diagnostics ID from the table.
- To show the diagnostic data in JSON format,
select the check box next to a diagnostics ID in the table and
Download. All the diagnostic data
(except the logs) appears in a new browser tab. From there you
can download the JSON format data to your device by selecting FileSave in the browser. For example:
![]() You can determine how the diagnostic was triggered by checking the event_type parameter. The following values are possible:
You can determine how the diagnostic was triggered by checking the event_type parameter. The following values are possible:- paa_periodic—Periodic diagnostic collection
- paa_on_demand_by_admin—Administrator-triggered diagnostic
- (Prisma Access Agent 25.7) paa_on_demand_by_user—User-triggered diagnostic through user issue reporting. The description of the issue that the user entered appears in the description parameter in the JSON output.
- (Prisma Access Agent 26.2) paa_agent_disabled_by_user—Event-triggered diagnostic collection caused by the user disabling the agent
- (Prisma Access Agent 26.2) paa_connection_long_time_to_connect—Event-triggered diagnostic collection caused by a tunnel taking too long to connect
- (Prisma Access Agent 26.2) paa_connection_ssl_fallback—Event-triggered diagnostic collection caused by tunnel fallback from IPSec to SSL
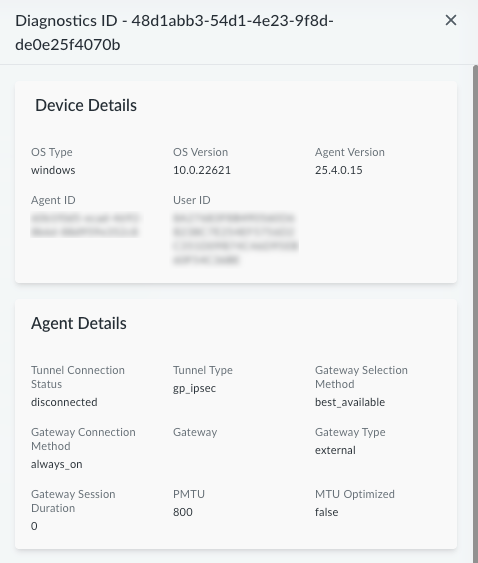
If you choose to view the diagnostic data in Endpoint Management window, you can see the diagnostic information for the device, including Device Details and Agent Details in the following window:![]() The user descriptions for reported issues do not appear in the Device Details or Agent Details. You can view the user descriptions in the diagnostic data in JSON format.Scroll to the Additional Troubleshooting Information section to access the device's Forwarding Profile Config.
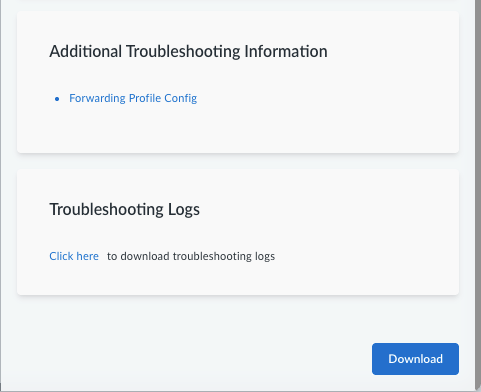
The user descriptions for reported issues do not appear in the Device Details or Agent Details. You can view the user descriptions in the diagnostic data in JSON format.Scroll to the Additional Troubleshooting Information section to access the device's Forwarding Profile Config.![]() To download the troubleshooting logs to your computer, select Click here to download troubleshooting logs.The troubleshooting log bundle includes all logs for the device, including the agent logs, OS logs, the routing table, DNS resolver, and the endpoint insights logs.Analyze the diagnostic information. When analyzing the diagnostic data, focus on the key areas, such as:
To download the troubleshooting logs to your computer, select Click here to download troubleshooting logs.The troubleshooting log bundle includes all logs for the device, including the agent logs, OS logs, the routing table, DNS resolver, and the endpoint insights logs.Analyze the diagnostic information. When analyzing the diagnostic data, focus on the key areas, such as:- Device Details: For example, check the Prisma Access Agent version installed on the endpoint.
- Agent Details: For example, check if the user is connected to the closest gateway.
- Additional Troubleshooting Information: For example, view the forwarding profile configuration to see how traffic is directed by the forwarding profile rules. Review the troubleshooting logs for more details. Identify any recent changes or updates that might impact performance.
Compare diagnostics to identify trends. Select multiple diagnostics from different time periods and compare the data points across these diagnostics to identify any significant changes.Download diagnostics for further analysis.- Select the diagnostic you want to download.Click Download to save the diagnostic data to your computer.When you click Download, all the diagnostic data (except the logs) appear in JSON format in a new tab in the web browser. From there you can download the JSON format data to your device by selecting FileSave in the browser.Download the troubleshooting logs separately from the Troubleshooting Logs section (by selecting Click here to download troubleshooting logs).


