Prisma Browser
Prisma Browser Investigations
Table of Contents
Expand All
|
Collapse All
Prisma Browser Docs
Prisma Browser Investigations
This is the description of the forensic investigations.
| Where Can I Use This? | What Do I Need? |
|---|---|
|
|
The Prisma Browser Investigation feature is an advanced forensic tool
designed to monitor, audit, and secure enterprise environments. This powerful solution
enables incident response teams to extract and analyze browser-related data,
facilitating security incident investigations, compliance enforcement, and unauthorized
activity detection.
By providing comprehensive forensic capabilities, the tool enables security
teams to reconstruct a clear narrative of events leading up to a security incident or
potential threat.
Key Capabilities
The Prisma Browser Investigation feature offers deep visibility into
user activity by capturing event data and relevant evidence. Its intuitive interface
enables rapid identification of anomalies and security threats.
Features
- Time-based Sequential View: Displays browser events chronologically per user and per device.
- Interactive Event Mapping: Enables navigation via mouse or keyboard.
- Visual Evidence Integration: Incorporates screenshots and event recordings for enhanced analysis.
- Comprehensive Session Metrics & Event Histogram: Includes policy rule enforcement indicators for precise monitoring.
- One-Click Investigation Initiation: Enables analysis of suspicious events.
- Seamless Activity Chain Visualization: Provides a structured view of user activities over time.
By employing Prisma Browser's Investigation feature, enterprises can
strengthen security measures, mitigate insider threats, and maintain full visibility
over browser-based activities. This tool is essential for security auditing,
incident response, and compliance verification.
Investigative Tools
The Investigation feature enables incident response teams to examine
potentially dangerous events occurring during a user's browsing session. For
example, if a policy rule blocks file uploads to Gmail and a user attempts an
upload, the Event Log records the activity, enabling further
investigation.
Incident response teams can:
- Inspect the event details
- Identify behavior patterns leading to the suspicious activity
- Analyze activities 30 minutes before and after the event
The Investigation window displays the following key information:
The Investigation window provides a structured view of crucial forensic
data:
- Session Details: Captures session details, including applications used and activity types.
- Filter Data: Refine searches based on event type, application, action, and incident classification.
- Histogram: A visual representation of events per minute. The display shows a Red bar if there is at least one blocked event during that time frame. If it displays a Blue bar, there are no blocked events.The default view focuses on a 10-minute block (five minutes before and after the event), adjustable within a 1-hour window.
- Activities Chain Map: Displays a sequence of user activities surrounding the event, including relevant applications and timestamps.
- Evidence Drawer: Stores visual records such as screenshots or event recordings.
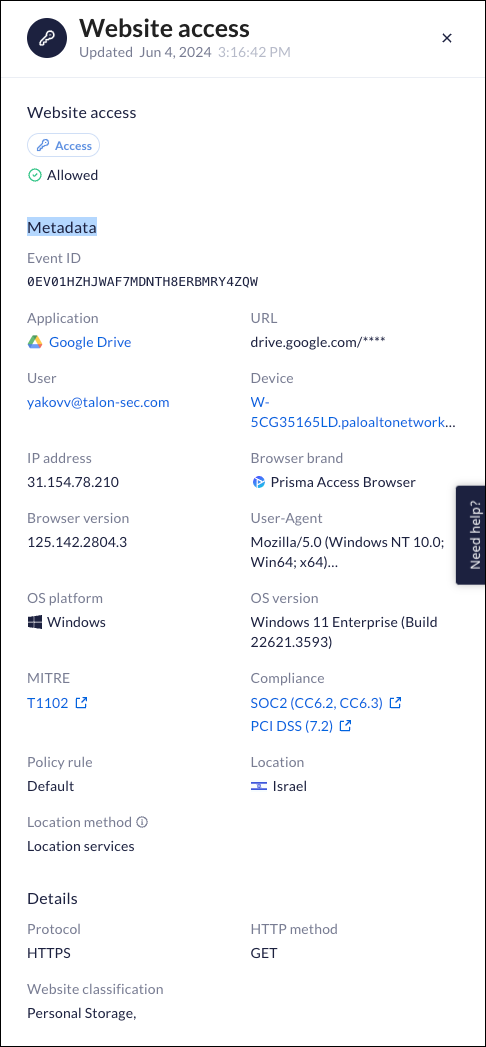
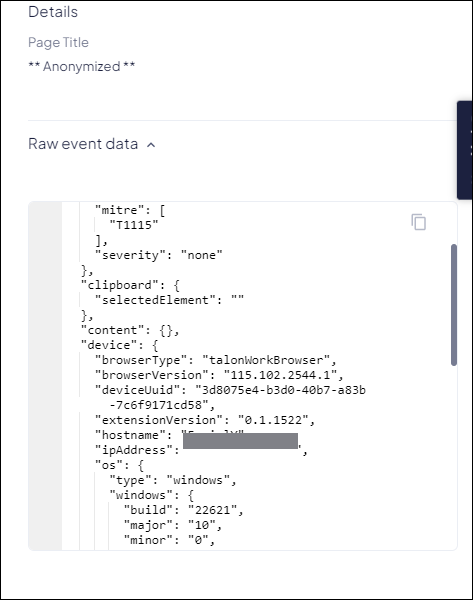
- Event Drawer: Consists of metadata, including raw event data for third-party analysis.

Navigating the Investigation Data
There are different ways that your Incident Response team can navigate through the
Investigation information to be able to properly examine the information and search
for appropriate information. The PPrisma Browser Investigation feature has many
different ways for you to navigate the data.
- Using a mouse - The mouse allows you to click between the different elements on the screen. Additionally, you can use the scroll button on the mouse to control the zoom in / zoom out for the Activity Chain Map, making it easier to concentrate on a particular area.
- Using a keyboard - It is easier to navigate the Activity Chain Events using the arrow keys on the keyboard. The arrow keys allow you to scroll through the different events within the time frame.
- Using a traackpad - This allows you to zoom in / zoom out, making it easier to concentrate on particular views.
Conducting an Investigation
The Prisma Browser Investigation feature enables incident response
teams to investigate suspicious user activities, such as Security policy violations
or attempts to access restricted content.
To begin an investigation:
- Select an Anchor Event: Identify the suspicious or malicious event for further analysis.
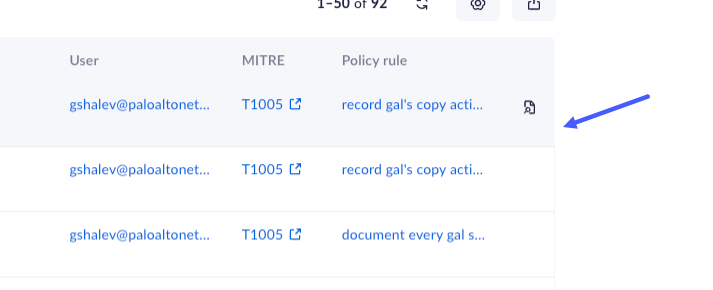
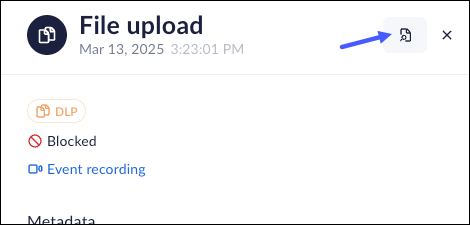
- Initiate the Investigation: Click the “Investigate” icon located
in the Event Drawer or next to individual events in the log.
![]()
![]() When you click the icon, you are directed to the Investigation page.Your incident response team can also initiate an investigation directly through the Investigation link. Using this method to open an investigation requires the investigators to use the search filters to locate the incidents that they need to investigate.
When you click the icon, you are directed to the Investigation page.Your incident response team can also initiate an investigation directly through the Investigation link. Using this method to open an investigation requires the investigators to use the search filters to locate the incidents that they need to investigate. - Analyze Metadata: Review the forensic details, including:
- Event timestamp and a one-hour investigation window.
- Filter options for refining searches.
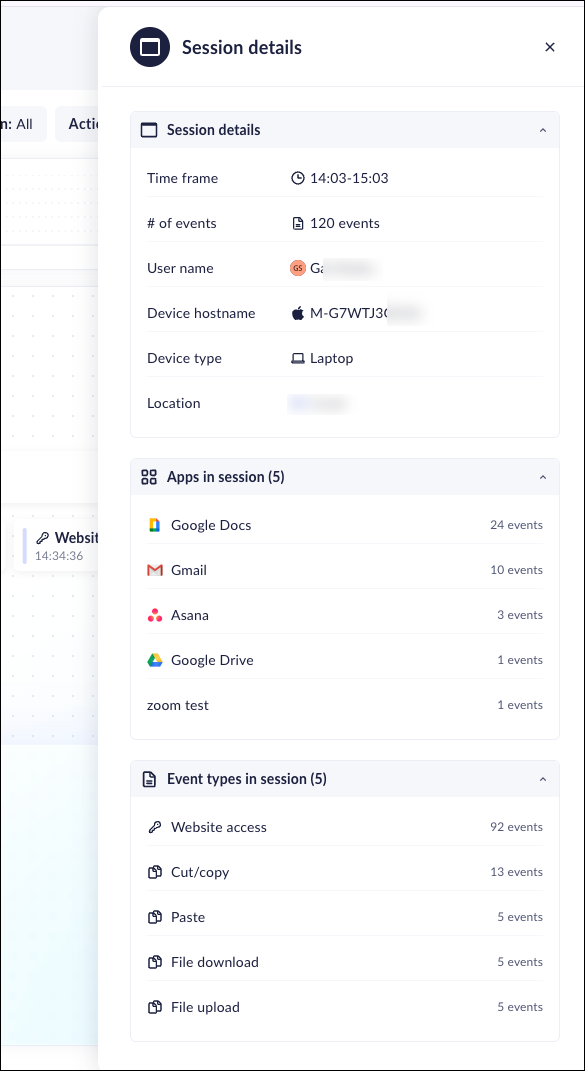
- Click Session details to obtain the basic metadata for the user/device that you want to investigate. The Session details includes:
- Time frame
- Number of events
- User name
- Device hostname
- Device type
- Geolocation
- Apps in the session
- Events in the session
![]()
- The Histogram visually represents event occurrences within the 1-hour time frame. The default focus area is 10 minutes, centered on the event. The incident response team can adjust this focus as needed when they are performing their investigation and analysis.If even a single event is blocked, then the display will show a red bar. Otherwise, the histogram will display a blue bar. The bars are connected to the Activities Chain Map display. The histogram reflects the system response - when an event is blocked, the histogram will be red. If there is no block, then the histogram is blue. By using this feature, you can see the frequency of blocked versus allowed responses.
![]()
- The main part of the Forensic analysis is the Activities Chain Map. This
feature displays activities that took place at any given moment during the
investigation time. It displays two information sections:
- The application/URL where the activity took place.
- The events that took place at the time. Blocked events are clearly marked with red bars on the left side, enabling quick identification of policy violations (e.g., blocked file upload attempts to Gmail). You can scroll through the events by either clicking on them using a mouse, or by using the arrow keys on the keyboard.
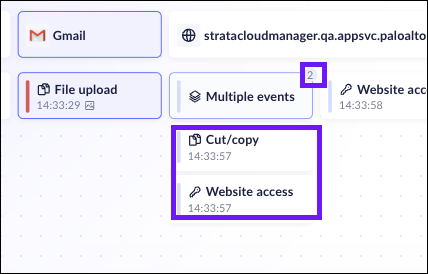
![]() If multiple events occur at exactly the same second, the event will be marked Multiple Events, and a badge will display the count. To analyse the events, hover on the badge to see all the simultaneous events. If the events are exactly the same, the Activities Chain will display the badge with the event type named instead.
If multiple events occur at exactly the same second, the event will be marked Multiple Events, and a badge will display the count. To analyse the events, hover on the badge to see all the simultaneous events. If the events are exactly the same, the Activities Chain will display the badge with the event type named instead.![]() The events must occur at the exact same time to be considered as multiple events.Every event will have its own Event Drawer information, and if it is available, its own Evidence.
The events must occur at the exact same time to be considered as multiple events.Every event will have its own Event Drawer information, and if it is available, its own Evidence.
- The Event Drawer displays all the relevant metadata for the event. This
allows you to examine all the "back office" information that can assist you in
investigating a suspicious event. In addition to all the meta data, the drawer
contains the raw event data that you can copy and send to a third-party tool for
analysis. The drawer allows you to examine the data carefully while looking for
malicious or suspicious occurrences.
![]()
![]()
The Evidence Drawer provides access to event recording and screen captures of
suspicious events. With this tool, you can visualize exactly what the user did to
trigger the suspicious event. This helps you increase the effectiveness of your
forensic investigations. Event recording start a few seconds before the incident,
and end a few seconds after the incident is complete.
The Evidence drawer has several special controls that helps your incident response
team analyse the different suspicious events.
- Collapse / Expand the Evidence Drawer: This button toggles the drawer. If there is evidence associated with the event, there will be a blue button on this control.
- Previous / Next Evidence: This control permits moving between events that have evidence associated with them. Instead of having to manually move through the different events in the Activity Chain Map, this control only moves between events that have evidence.
- Expand Evidence: Expand the size of the screenshot or event recording.
- Full Screen: Expand the evidence to full screen mode so that you can
see things much closer.
![]()

