Prisma Access
View and Monitor Colo-Connect
Table of Contents
View and Monitor Colo-Connect
View and monitor your private connectivity to hybrid cloud and on-premises data
centers over cloud interconnects.
| Where Can I Use This? | What Do I Need? |
|---|---|
|
|
Prisma Access Colo-Connect leverages the cloud-native GCP interconnect
technology to provide high-bandwidth service connections to your private applications.
Colo-Connect coexists with the existing IPSec tunnel-based service connections, so if
you need to provide private app access to smaller data centers that don’t require
high-bandwidth throughput, you could also use service connections to those data centers.
Gain visibility into your Colo-Connect deployment by viewing metrics such as the number
of Colo-Connect links and status, throughput trends, and individual tunnel, connection,
and link details. By viewing data about your Colo-Connect service connections, you can
get an overall picture of the health and connectivity of your deployment.
To view and monitor your private connectivity to hybrid cloud and on-premises data
centers over cloud interconnects, go to .
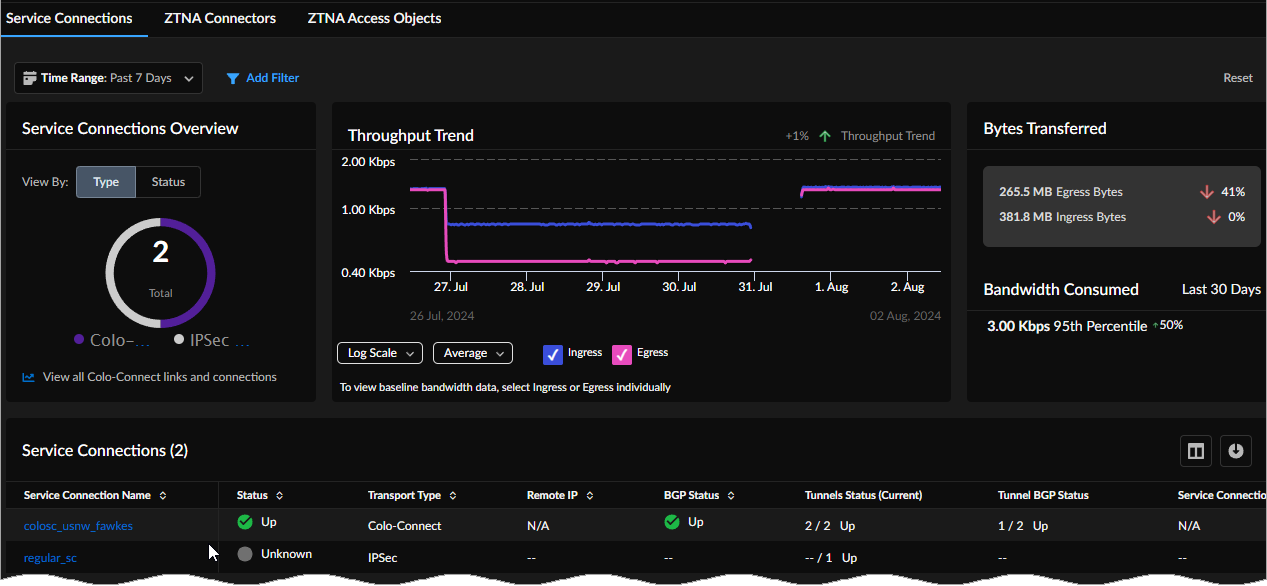
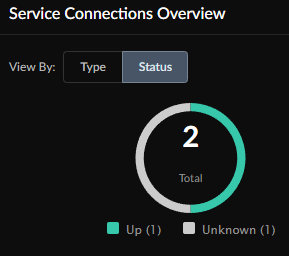
Service Connections Overview
Service Connections Overview shows the number of service connections by
transport Type.
You can see an aggregation of connected transports by Type or
their availability Status.
- IPSec
- Colo-Connect
You can view tunnel transport type by status: Up, Down,
Degraded, or Unknown.
Select View all Colo-Connect links and connections to view the
Colo-Connect details page.

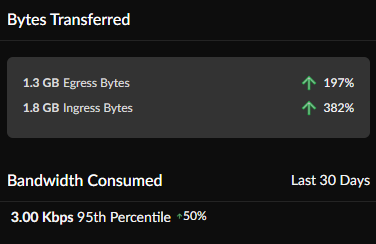
Service Connections Overview: Bytes Transferred and Bandwidth Consumed
Bytes Transferred shows an aggregation of ingress and egress bytes consumed,
and the difference in consumption from the time range you selected previously.
Bandwidth Consumed shows the 95th percentile of bandwidth
consumed in the last 30 days.
Service Connections
The Service Connections table shows the following details for each indicated
Service Connection:
- Service Connection Name—Name of the Colo-Connect or IPSec service connection. Select a Service Connection Name to go to its details page.
- Status—Up, Down, Degraded, or Unknown.
- Transport Type—Colo-Connect or IPSec.
- Remote IP—Destination IP.
- BGP Status—Up, Down, or Warning if some BGP tunnels are up and some are down.
- Tunnel Status (Current)—Current tunnel status.
- Tunnel BGP Status—Number of tunnels by BGP status (Up, Down, or Warning).
- Service Connection Endpoint IP—The Prisma Access node IP address.
- Service Status—The service status is determined by the active service connection or data center cluster's or clusters' (more than one cluster) status (Up, Down, or Warning).
- Prisma Access Location—Select a Prisma Access Location.
- Average Bandwidth Consumption—The average bandwidth consumption for the site during the time range selected.
- Peak Bandwidth Consumption—The peak bandwidth consumption for the site during the time range selected.

Service Connection Details
From the Service Connections table on the main page, select a
Service Connection with the its transport
Type as Colo-Connect to go to its details page.
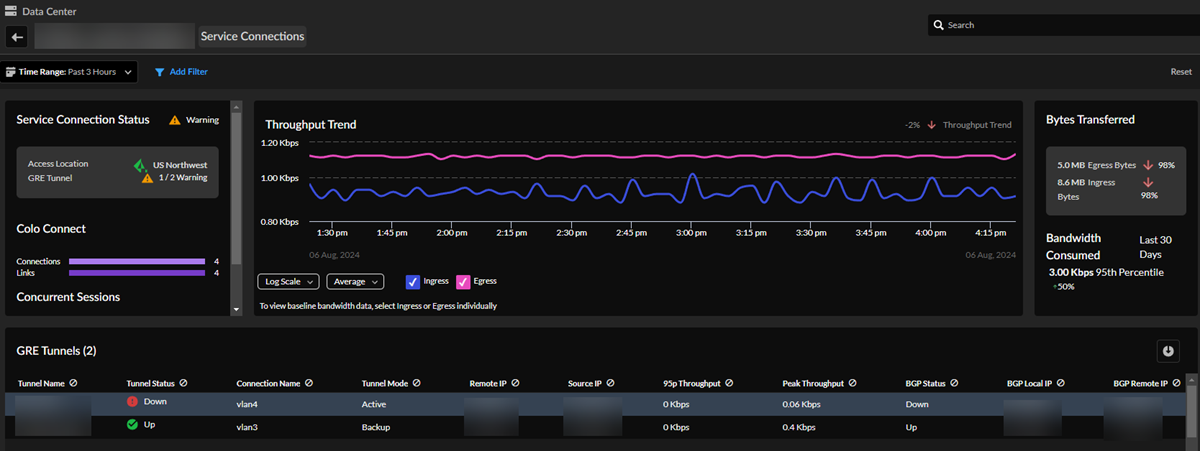
Service Connection Status, Colo-Connect, and Concurrent Sessions
- See the service connection's Access Location and GRE Tunnels status (Up, Down, or Warning).
- View the total number of Colo-Connect links and connections.
- Concurrent Sessions shows the number of current sessions and the number of total sessions during the past 30 days.
Throughput Trend
Throughput Trend shows the ingress and egress throughput traffic consumed
by this service connection during the time range selected.
Bytes Transferred and Bandwidth Consumed
Bytes Transferred shows an aggregation of ingress and egress bytes that
this service connection consumed, as well as the difference in consumption from
the previously selected time range. Bandwidth Consumed
shows the 95th percentile of bandwidth that the service connection consumed in
the last 30 days.
GRE Tunnels
View details about the tunnels in this service connection:
- Tunnel Name—The unique tunnel name.
- Tunnel Status—Up, Down, or Unknown.
- Connection Name—The connection's unique name.
- Tunnel State—The connection status (Active or Backup).
- Remote IP—Destination IP address.
- Source IP—Local device's IP address.
- 95% Throughput—The 95th percentile of bandwidth consumed in the last 30 days.
- Peak Throughput—Peak throughput during the time range selected.
- BGP Status—Up, Down, Degraded, or Unknown.
- BGP Local IP—The BGP local IP.
- Disconnections—How many disconnections this tunnel has had.
- Disconnections Duration—How long the disconnections lasted.
- Ingress Bytes—How many ingress bytes consumed during the time range selected.
- Egress Bytes—How many egress bytes consumed during the time range selected.
- Ingress Packet Count—The ingress packet count.
- Egress Packet Count—The egress packet count.
Colo-Connect Details
From the main Service Connections page, select
View all Colo-Connect links and connections from the
Service Connections Overview widget to open the
Colo-Connect details page. Widgets on this page show
your current details (current defined as the last 20 minutes).
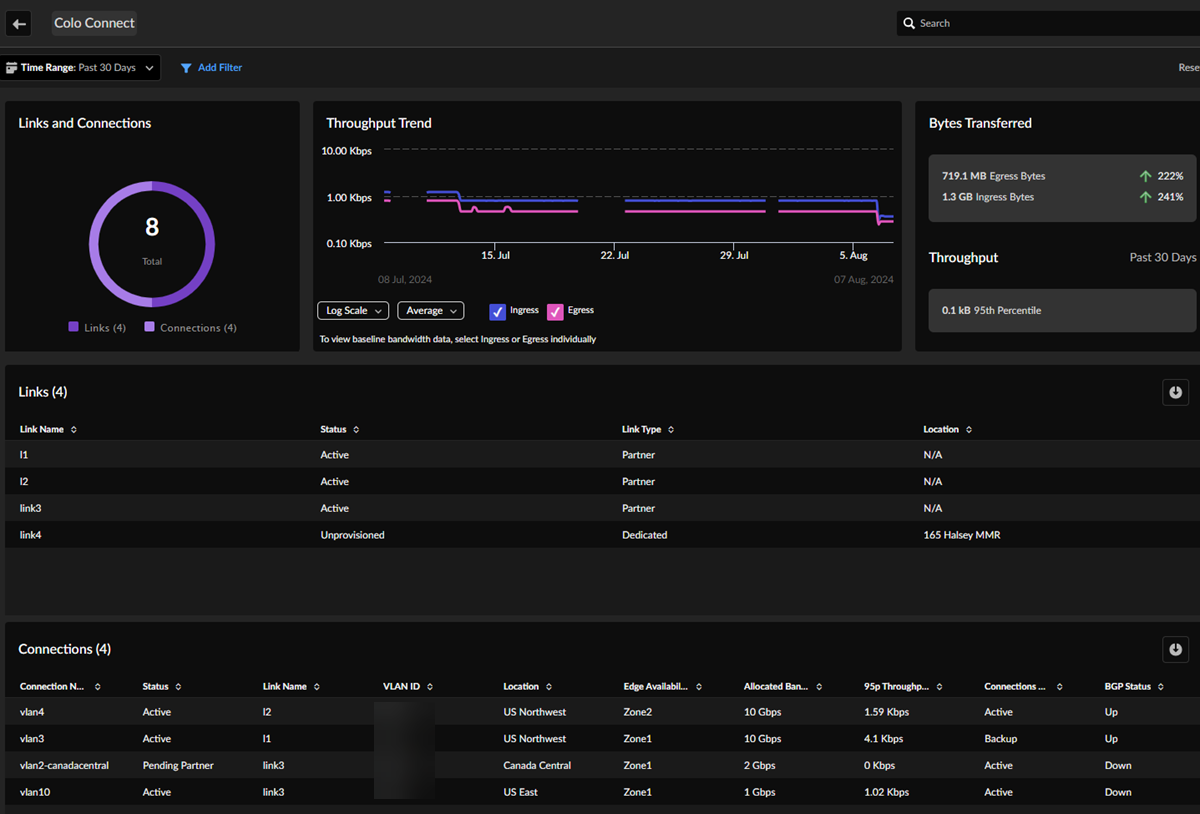
Links and Connections
The circle chart shows the total number of current Colo-Connect links and
connections.
Links
The table shows details about your current Colo-Connect links.
- Link Name—Unique Colo-Connect link name.
- Status—Active or Maintenance.
- Link Type—Partner or Dedicated.
- Location—Prisma Access location.
Connections
View details about each of your current Colo-Connect links. Hover over
connections to see information about the status shown.
- Connection Name—Unique Colo-Connect connection name.
- Status—Acrtive, Pending Partner, Defunct.
- Link Name—The connection's link name.
- VLAN ID—The connection's VLAN ID.
- Location—Prisma Access location.
- Edge Availability Zone—Zone1 or Zone2.
- Allocated Bandwidth—1 Gbps, 2 Gbps, 5 Gbps, 10 Gbps, or 20 Gbps.
- 95% Throughput—The 95th percentile of bandwidth consumed.
- Connection State—Active or Backup.
- BGP Status—Up or Down.