Prisma SD-WAN
Monitor Probes
Table of Contents
Expand All
|
Collapse All
Prisma SD-WAN Docs
-
-
- Prisma SD-WAN Controller
-
- CloudBlade Integrations
- CloudBlades Integration with Prisma Access
-
-
-
-
- 6.5
- 6.4
- 6.3
- 6.1
- 5.6
- Prisma SD-WAN Controller
- Prisma SD-WAN On-Premises Controller
- Prisma SD-WAN CloudBlades
- Prisma Access CloudBlade Cloud Managed
- Prisma Access CloudBlade Panorama Managed
Monitor Probes
Steps to monitor probes and flow data
| Where Can I Use This? | What Do I Need? |
|---|---|
|
|
- To view the Probe Health of a circuit, in Strata Cloud Manager, go to ConfigurationPrisma SD-WANBranch Sites.
- Select the Branch Site Name and click on the Circuit you wish to view the probe health.
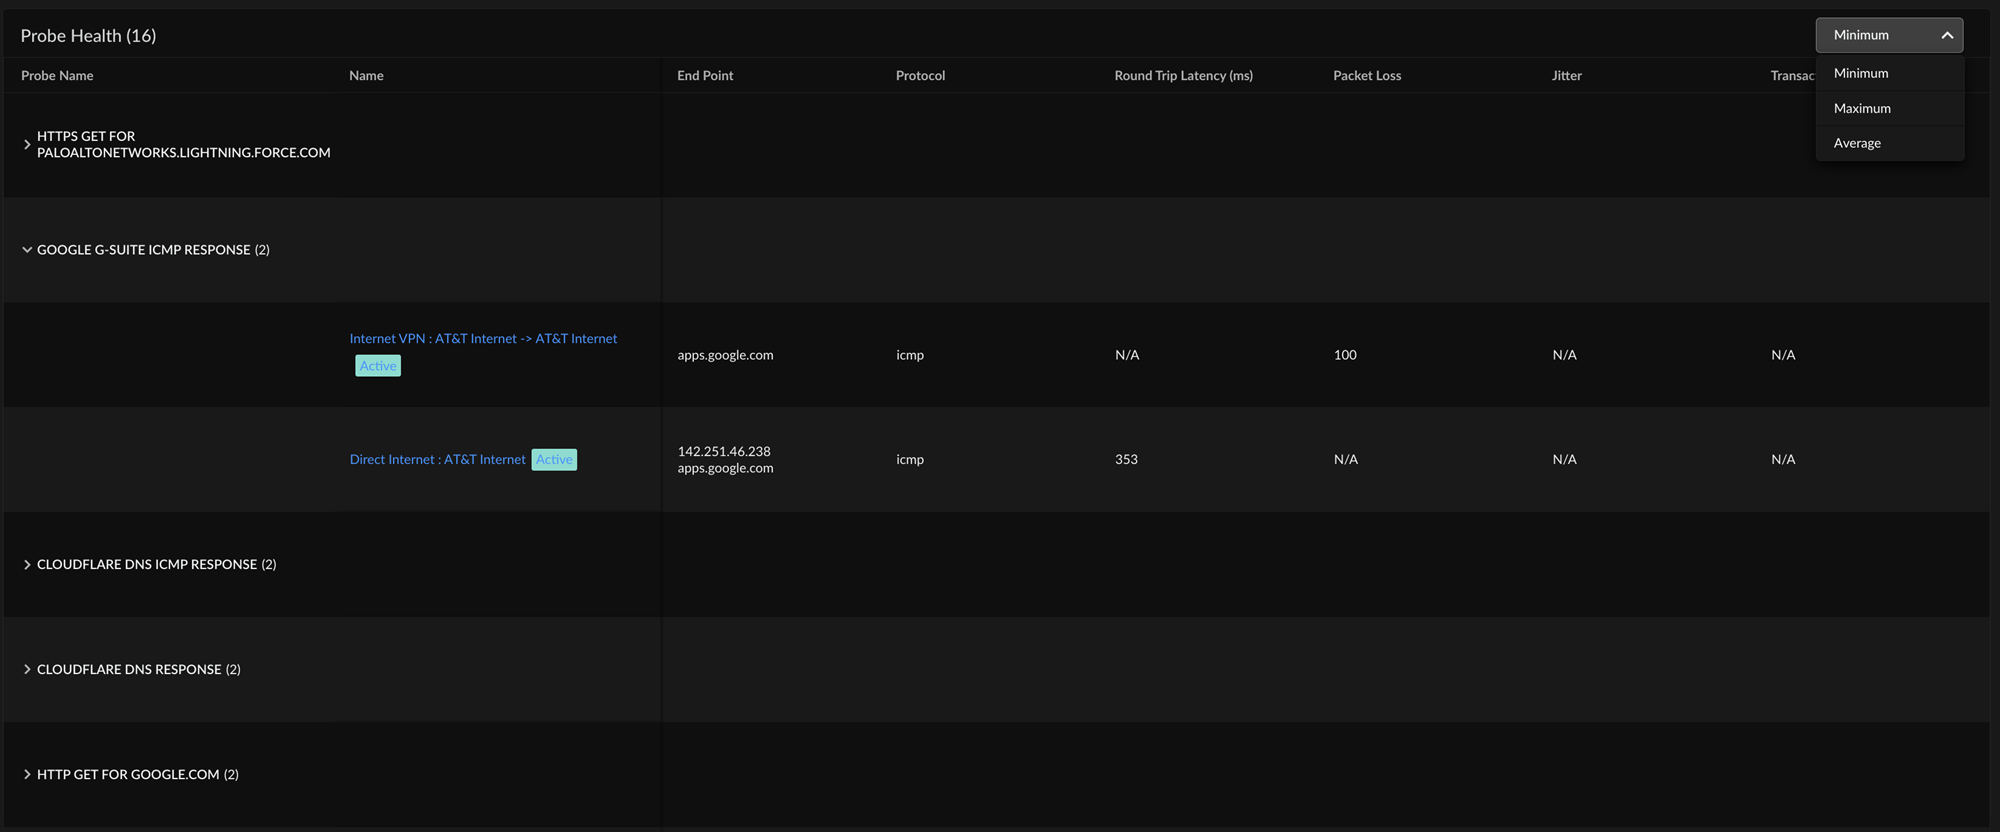
- Expand the Probe name to view the circuits where the probes were applied. It provides information on the endpoint, protocol, RTT, Loss, Jitter, Transaction Failure Rate and Init Failure Rate.
![]()
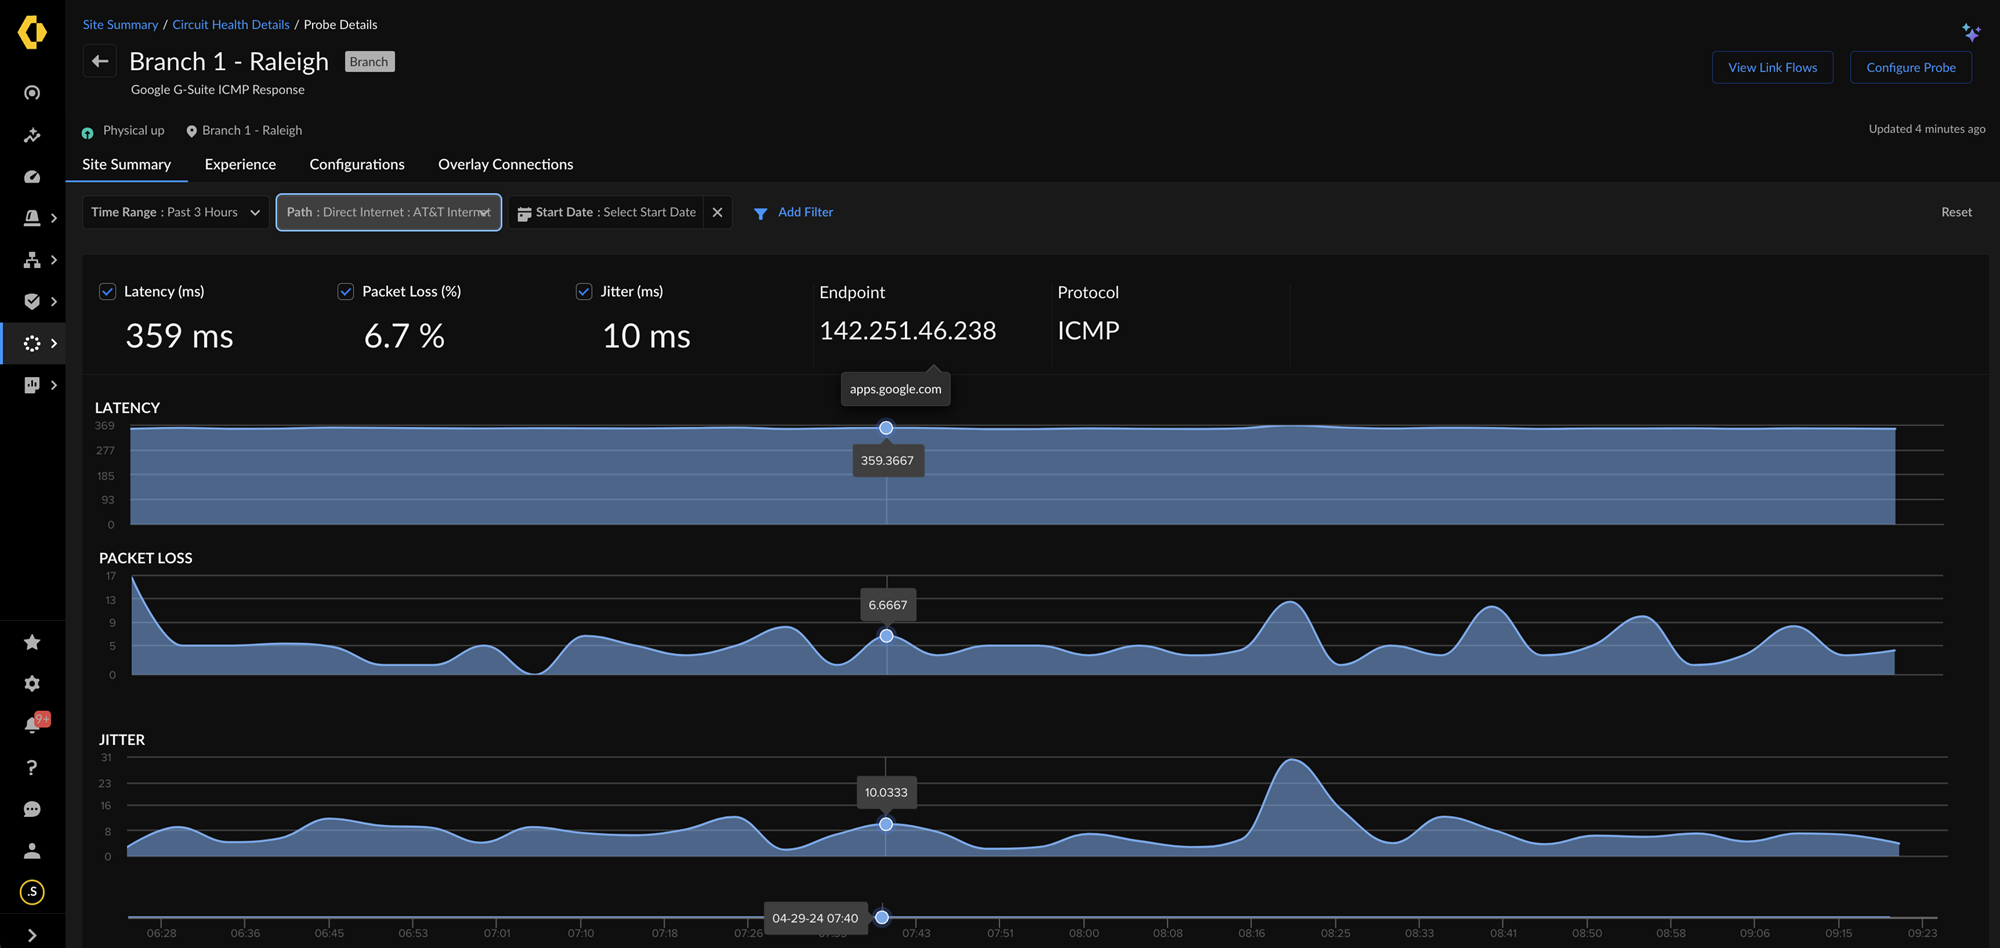
- Select a path to view the Probe Details such as Latency, Jitter, and Packet Loss by filtering by Path and Time Range.
![]() To view the performance policy probes in flow data, in Strata Cloud Manager, go to InsightsPrisma SD-WANBranch Sites.
To view the performance policy probes in flow data, in Strata Cloud Manager, go to InsightsPrisma SD-WANBranch Sites.- Select a site to view the Flows data and select any flow to view detailed information on the attributes of the flow.
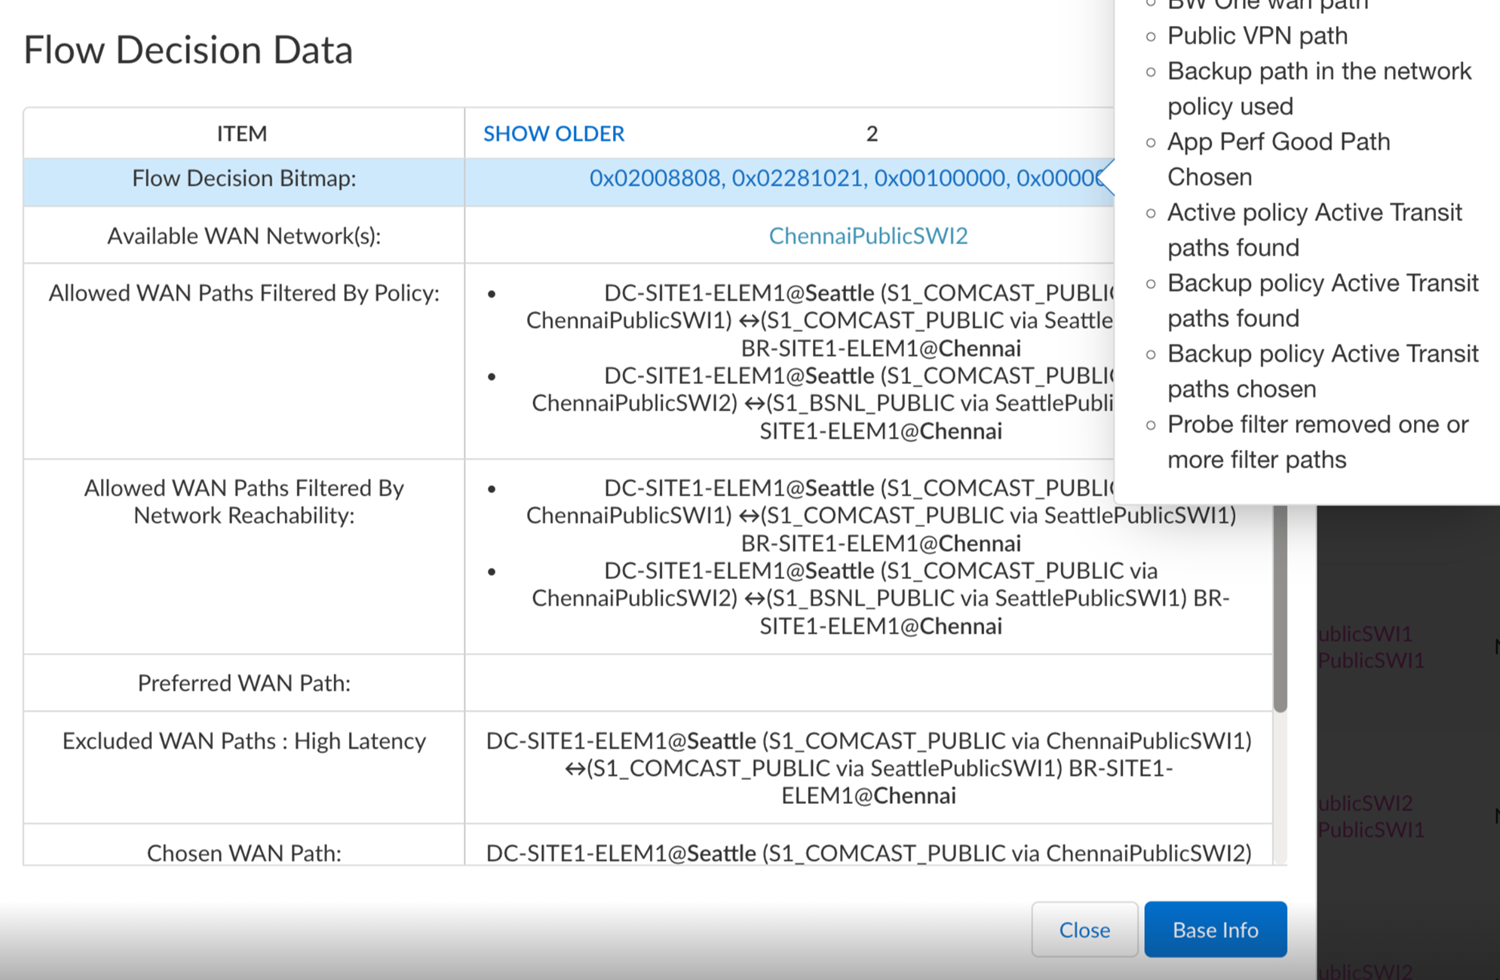
- Flow Decision Data provides a detailed per flow account for all aspects of the app session, including the actions taken to meet the configured performance policy probes SLAs and also lists any SLA violations.
![]()


