Prisma SD-WAN
WAN Clarity Data Center Reports
Table of Contents
Expand All
|
Collapse All
Prisma SD-WAN Docs
-
-
- Prisma SD-WAN Controller
-
- CloudBlade Integrations
- CloudBlades Integration with Prisma Access
-
-
-
-
- 6.5
- 6.4
- 6.3
- 6.1
- 5.6
- Prisma SD-WAN Controller
- Prisma SD-WAN On-Premises Controller
- Prisma SD-WAN CloudBlades
- Prisma Access CloudBlade Cloud Managed
- Prisma Access CloudBlade Panorama Managed
WAN Clarity Data Center Reports
Learn about the WAN Clarity Data Center reports.
The Data Center reports
provide an insight into utilization trends from a Data Center perspective.
Similar to the branch reports, these reports identify top applications,
source IP addresses, destination IP addresses, source-destination
IP address pairs, and undefined domains along with top branches. You
can generate this set of reports for hotspots observed in the data
center.
It is important to note that a hotspot definition
for a data center differs from that for a branch. While for branches,
utilization over 70% of configured bandwidth is considered a hotspot,
for a data center, you may consider 90th percentile utilization
as a hotspot. It, therefore, becomes imperative that you accurately
set the circuit bandwidth allocations at the data center. These
reports provide an approximation of the utilization trends as the
reports generated only consider overlay paths.
In summary, the WAN Clarity Report generates every week to help
you understand how the circuits in the Prisma SD-WAN AppFabric can
be utilized from an entire fabric, site, circuit, application, and
user perspective. These reports provide actionable insights that
you can use for capacity planning, path policy adjustments, QoS
policy adjustments, and enforcement of proper use of network resources
by the end-user community.
The following sections describe the data center reports in the
WAN Clarity Reports in more detail.
Circuit Utilization
The Circuit Utilization report provides the utilization
summary for all DC circuits on both the ingress and egress directions. The circuit
utilization report consists of raw data packaged in CSV files that have information
on circuit utilization data and percentile utilization. The report package also
contains an HTML report for each DC circuit.
The HTML report contains a series of topics that shed light on the bandwidth
utilization, observed hotspots, branches, applications, source IPs, destination IPs,
and unknown domains contributing to those hotspots. We classify a circuit to be hot
when the utilization is at the 90th percentile. The report provides a summary of the
circuit configuration and bandwidth utilization in the form of provisioned
bandwidth, median utilization, and 90th percentile utilization.
The Circuit Utilization report summarizes the circuit configuration and bandwidth
utilization in the form of provisioned bandwidth, median utilization, and 90th
percentile utilization.

The table above is from a report for DC1 - Circuit, where the 90th percentile
utilization is at 5.33595% of the provisioned bandwidth, indicating that the circuit
is not contentious and possibly overprovisioned.
The Circuit Utilization report then plots the utilization trend for the past week in
an interactive chart that can zoom in and study the trend in detail. It also marks
the 90th percentile utilization and highlights hotspots in red.

In the sample report above, the utilization above 53.35951 Mbps, as mentioned in the
table, is highlighted in red as possible hotspots.
The circuit utilization report then highlights the top branches, applications, source
IPs (branch IPs for ingress reports), destination IPs (branch IPs for egress
reports), IP pairs, and undefined domains contributing to the hotspot. The sample
reports below highlight the top contributors to the hotspots for DC1 – Circuit
1.
Hotspot Reports
The Hotspot reports generated for every DC site circuit give
us visibility into the circuit’s 90th percentile utilization. The reports provide a
list of branches, applications, undefined domains, destination IPs, source IPs, and
source and destination IP pairs observed during the hotspots.
| Hotspot Report | Description |
|---|---|
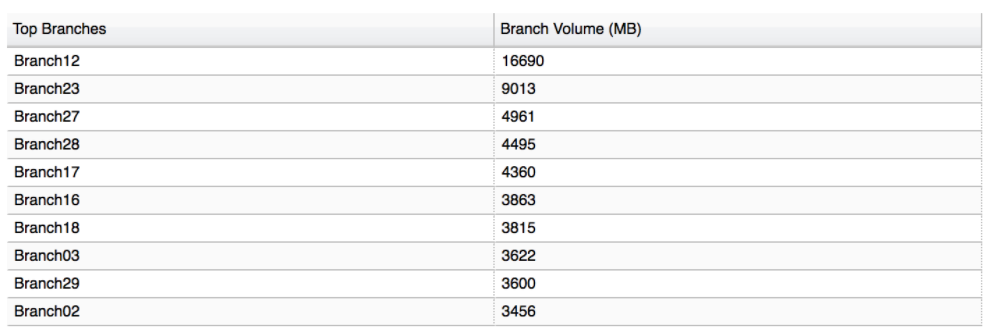
| Hotspot: Top Branches |
Highlights the traffic volume contributed by the top 10 branches
during the hotspot observed on the DC circuit.
Use data from this report to redefine data center transit
features under path policies for branches.
Top branch transmitting traffic on this circuit when utilization
is above the 90th percentile is shown below:

|
| Hotspot: Top Apps |
Highlights the top 10 applications contributing to the hotspot
observed on the DC circuit over the course of the week.
Use data from this report to redefine path policies for
applications that may directly offload to the internet. This
report can also help network administrators redefine application
priority to apply the right QoS to frequently used applications.
Top applications receiving traffic on this circuit when the
utilization is above the 90th percentile is shown below:

|
| Hotspot: Top Undefined Domains |
Highlights the top 10 undefined defined domains contributing to
the hotspot observed on the DC circuit over the week.
Use data from this report to redefine existing custom
applications or create new custom applications.
Top undefined domains discovered for apps http, ssl,
enterprise-http, and enterprise-ssl, receiving traffic on this
circuit when utilization is above the 90th percentile is shown
below:

|
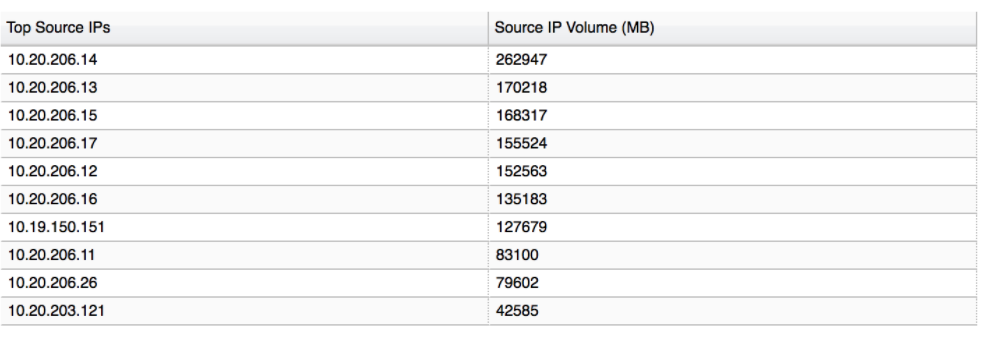
| Hotspot: Top Source IPs |
Highlights the top 10 source IPs contributing to the hotspot
observed on the DC circuit over the week. For the Ingress
direction, these IPs are the Branch IPs.

For the egress direction, these IPs may identify as source IPs,
i.e., indicating the origin being the data center.

Use data from this report to identify top contributors to the
hotspot on the DC circuit and establish proper network resource
enforcement.
|
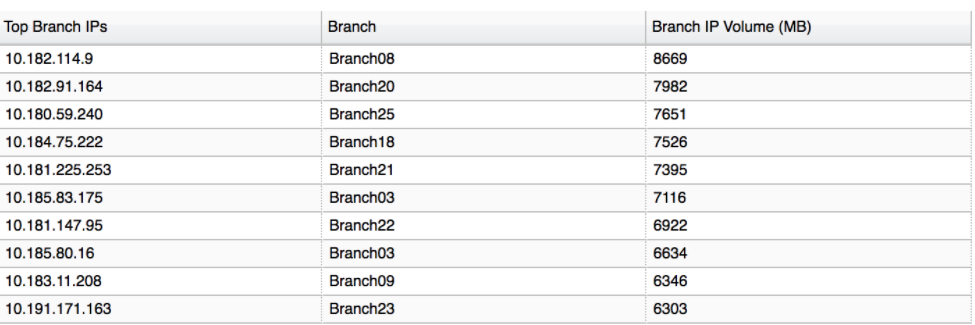
| Hotspot: Top Destination IPs |
Highlights the top 10 destination IPs contributing to the hotspot
observed on the DC circuit over the week.

For the egress direction, these IPs are the Branch IPs,
indicating the flow termination are branches in the
App-Fabric.

Use data from this report to identify top contributors to the
hotspot on the DC circuit and establish proper network resource
enforcement.
|
| Hotspot: Top IP Pairs |
Highlights the top 10 source and destination IP pairs
contributing to the hotspot observed on the DC circuit over the
week.

|
The Circuit Utilization report is generated for both ingress and egress directions
for each data center circuit. It can assess utilization trends, refine path and QoS
policies, and identify users who are misusing network resources, enabling the
network administrators to enforce proper use of network resources.
Top N Reports
The Top N reports are
a set of reports that provide insight into the top branches, applications,
source IPs, destination IPs, source and destination IP pairs, and
undefined domains for the entire week. Generate these reports for
each data center in a CSV file with information about all the specific
category contributors.
Use the insights from this report to
understand site-specific trends and turn them into actions such
as changing path policies, changing application priorities, and
reassessing the provisioned bandwidth for over-subscribed and under-utilized
circuits.
Unlike the Hotspots report, which only looks at
flows that traversed the network during periods of hotspots, the
Top N report studies flow and application data for the entire week
to determine which applications, users, and domains contribute the
most to high bandwidth utilization.
Traffic Distribution
The Traffic Distribution report helps administrators understand traffic volume
distribution to all the data centers in the AppFabric. These reports help understand
traffic flow from branches, applications, and top applications from top branches to
and from the data centers in the form of Sankey charts. These reports deliver an
HTML report with Sankey charts for the top 10 contenders and a CSV file with the
entire dataset.
Traffic Distribution: Top Applications Report
Provides details into the flow of application traffic to and from all the data
centers in the AppFabric. It provides visibility into the top 10 ingress and
egress applications by volume.

The HTML report also provides an insight into top applications by total volume
across all the DCs in the form of a Combined Egress and Ingress traffic
report.

In the examples above, there is only a single data center: DC1. The data flow
label above the data center block indicates traffic flow, either to or from that
data center.
In the case of multiple DCs, you may decipher the traffic volume going to each of
the data centers from the flow stream's thickness. The supplemental CSV can help
understand the accurate distribution of application traffic volume across the
data centers.

See the sample report below:


Traffic Distribution: Top Branches Report
Provides details into the flow of branch traffic to all the data centers in the
AppFabric. It provides visibility into the top 10 ingress and egress flows from
branches by volume and a combined summary report.


Traffic Distribution: Top Applications from Top Branches
Provides details into the top 10 applications emerging from the top 10 branches
to all the data centers in the AppFabric. The report provides visibility into
top ingress and egress branches and the top applications' flow by volume
emerging from these branches.


