Prisma SD-WAN
Monitor the Prisma Access for Networks CloudBlade
Table of Contents
Expand All
|
Collapse All
Prisma SD-WAN Docs
-
-
-
-
- AWS Transit Gateway
- Azure vWAN
- Azure vWAN with vION
- ChatBot for MS Teams
- ChatBot for Slack
- CloudBlades Integration with Prisma Access
- GCP NCC
- Service Now
- Zoom QSS
- Zscaler Internet Access
-
-
- ION 5.2
- ION 5.3
- ION 5.4
- ION 5.5
- ION 5.6
- ION 6.0
- ION 6.1
- ION 6.2
- ION 6.3
- ION 6.4
- New Features Guide
- On-Premises Controller
- Prisma Access CloudBlade Cloud Managed
- Prisma Access CloudBlade Panorama Managed
- Prisma SD-WAN CloudBlades
Monitor the Prisma Access for Networks CloudBlade
Monitor, view messages, and check the audit logs of the CloudBlades installation and
integration.
| Where Can I Use This? | What Do I Need? |
|---|---|
|
|
Go to the Prisma Access CloudBlades (Panorama Managed and Cloud Managed) tile
to view the connectivity status information of the CloudBlade from the following
options.
- The connectivity indicator appears as a dot on the top-right corner of the tile and
updates every 15 seconds automatically. The color of the dot shows the current state
of the CloudBlade.
- Red: encountered issues during execution.
- Green: execution is in progress.
- Blue: execution is complete without any issues.
- Yellow: execution is yet to complete. This can happen during the first installation.
- Click the Monitor button to view the status of the CloudBlade.
- Click the Messages button to view the execution start and end messages that the CloudBlade sends in real time.
- Click the Audit Logs button to view the audit trail of the changes done to the CloudBlade configurations.
The Monitor button allows you to view a collection of data sets,
which help understand the current status of the CloudBlade, and the data in each tab, is
updated when a execution is complete. These tabs are explained below:
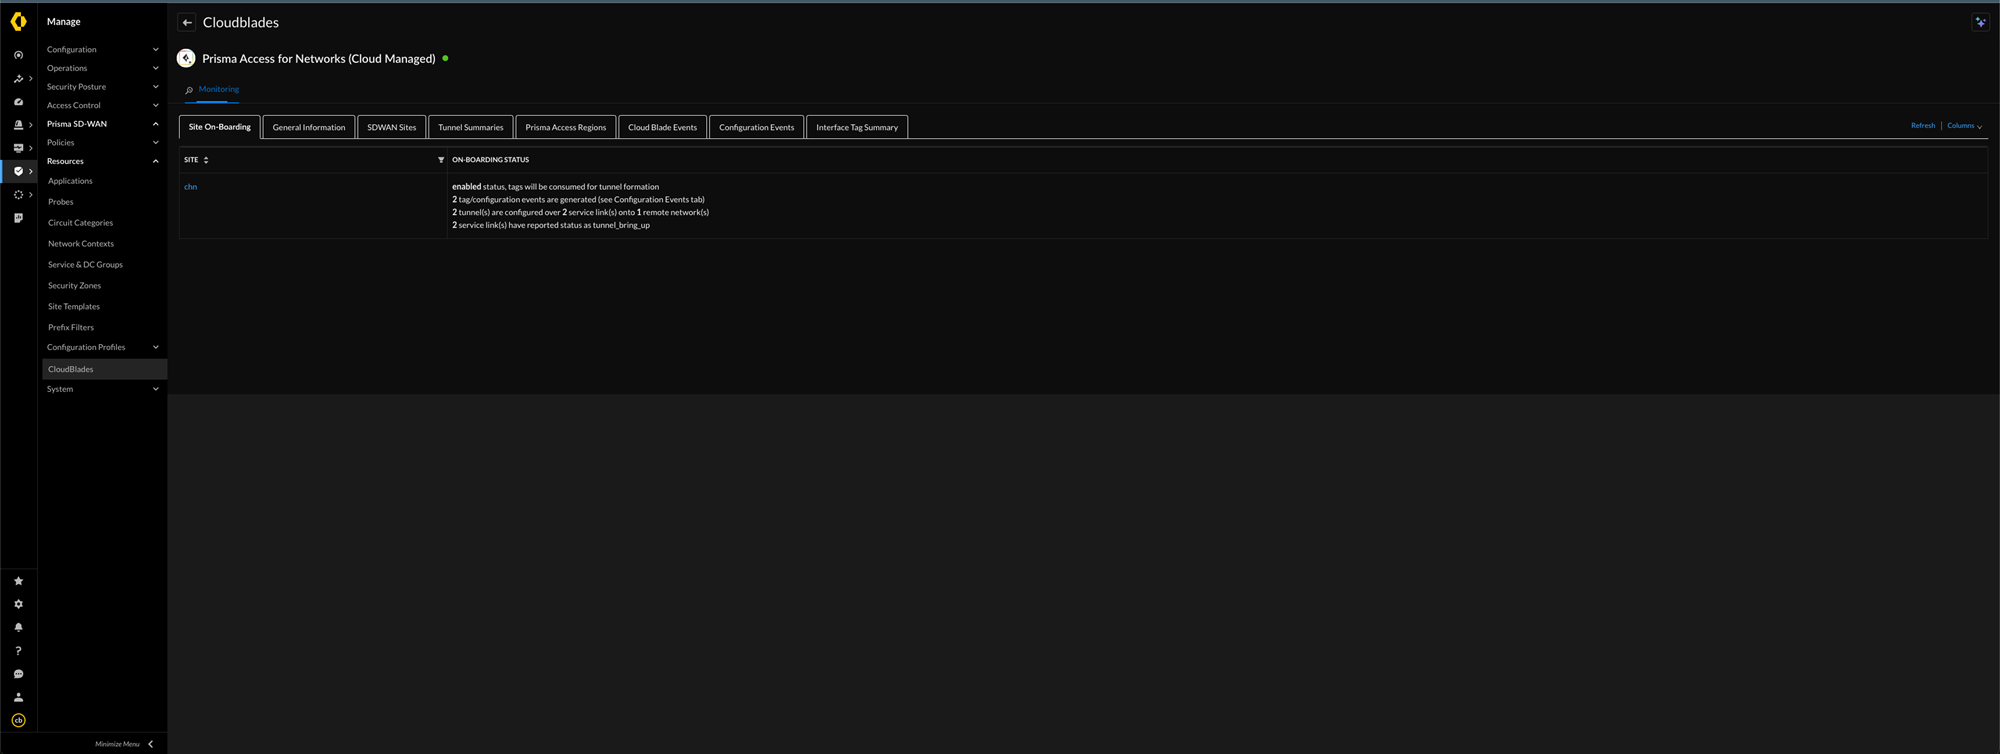
- The Site Onboarding Tab tab shows an entry if you have
successfully tagged a site for Prisma Access tunnel formation. You can verify if the
entry and the number of tunnels created is correct. You can filter sites by using
the Site Name column.
![]()
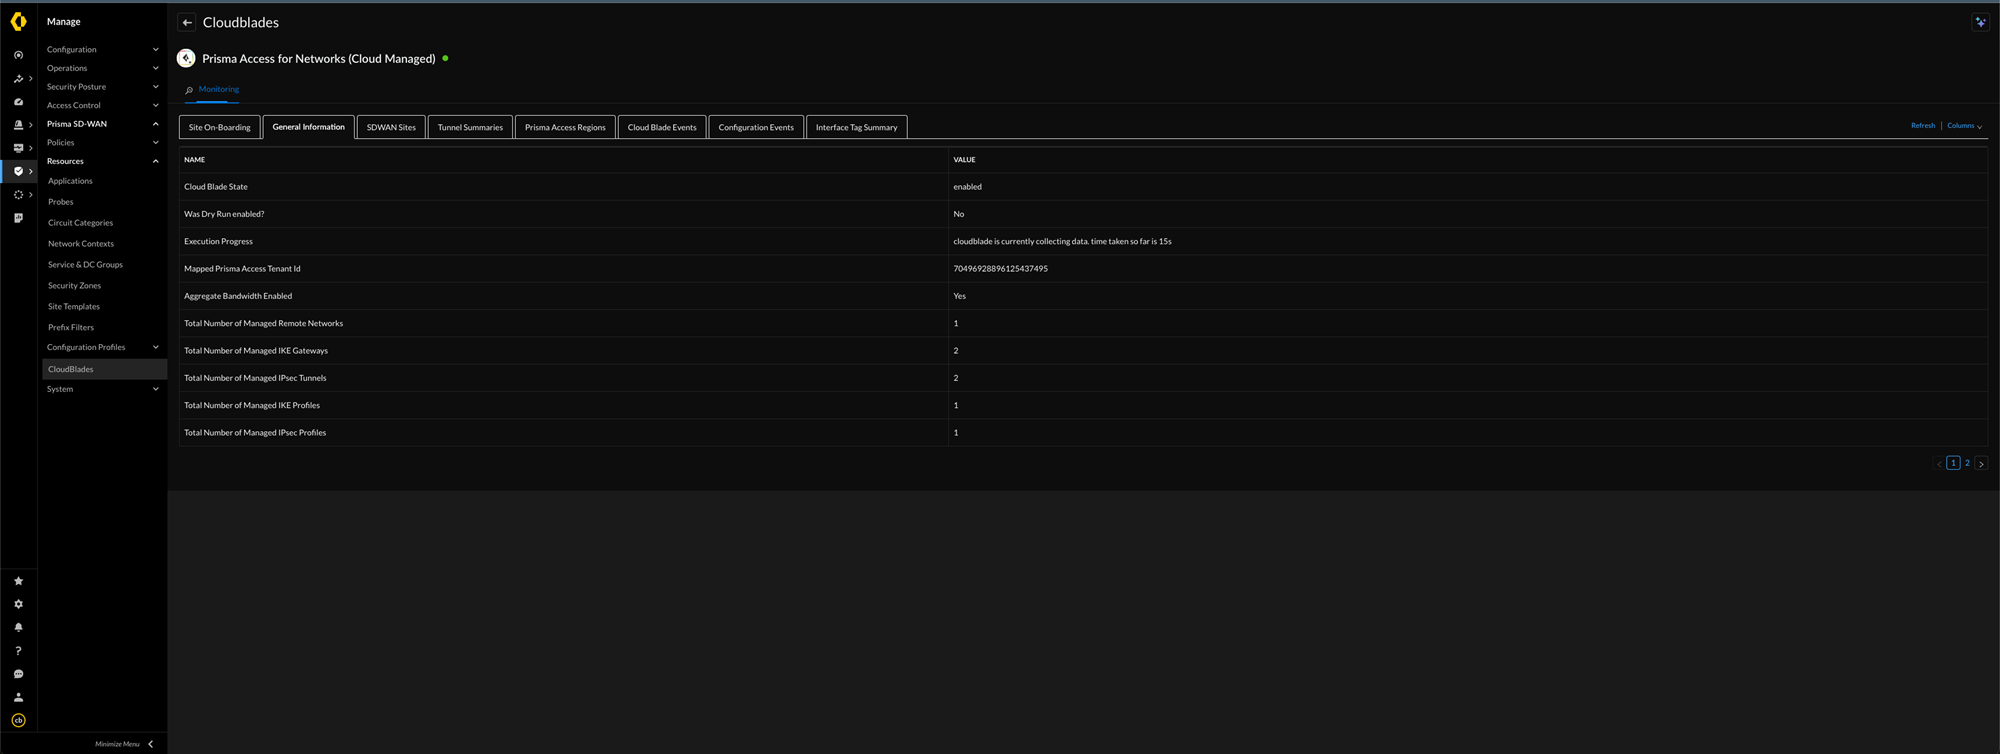
- The General Information tab shows a snapshot of the current
state of the CloudBlade and Prisma SD-WAN. It gives an overview of
all the components involved in the CloudBlade, which are SD-WAN, CloudBlade, and
optionally the Cloud Services plugin. If an error occurs while running the
CloudBlade, you will see a Last Reported Error row to assist
with troubleshooting.
![]()
- The SDWAN Sites tab shows the computed state of each SD-WAN site. It provides key properties computed by the CloudBlade for each site in each column. The columns currently shown are:
![]()
- View each of the SD-WAN sites by clicking the Site name in this column. Verify that the state is Enabled for your site. If not, configuration may not be valid.
- Use the Encoded ID to filter resources related to this site. The encoded ID is a unique identifying name used in Prisma Access to create resources. Verify that the encoded ID for your site reflects the prisma_name tag.
- Check the Tunnel Formation to see if the site is eligible for tunnel formation. If the site is computed to be disabled, then existing tunnels are deleted as well.
- On-board a site as single, shared, mirrored, or misconfigured in HA Mode, based on the number of devices attached to the site. A misconfigured site indicates an issue with the CloudBlade configuration.
- Click the option BGP Enabled as Yes, if you wish to enable BGP on tunnels formed on this site.
- Click the option ECMP Enabled as Yes, if you wish to have tunnels formed on this site on ECMP Remote Networks, else the tunnels will be Non-ECMP Remote Networks.
- View the list of ECMP Regions (list of Prisma Access regions) under the site level tag’s ECMP tab, which is eligible for ECMP tunnel formation.
- In the Tunnel Summaries tab, for each service link created by the CloudBlade, an entry is created which provides the related SD-WAN and Prisma Access resources for a given service link. Verify that the correct number of Service Links are present for your site, that the Region and SPN are correctly resolved for the tag you have used on the port, and that ECMP and BGP Peering are correctly configured.
![]() If you don't find the expected service link, see the Events tab for any warnings generated on the concerned site or port.
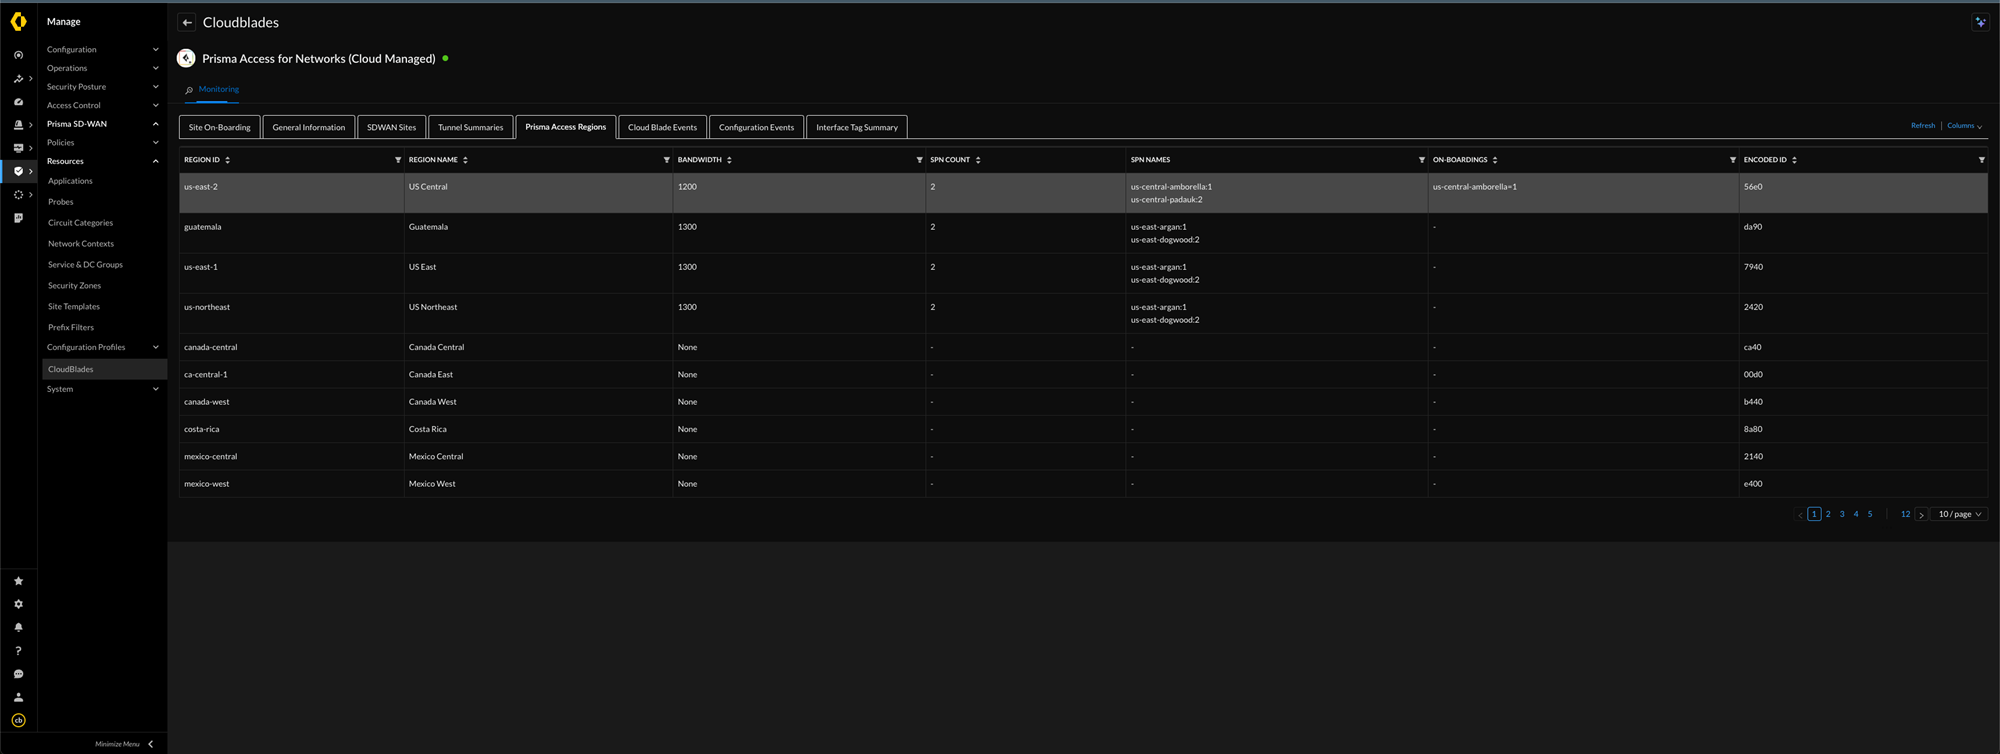
If you don't find the expected service link, see the Events tab for any warnings generated on the concerned site or port. - View a summary of the Prisma Access Regions as reported by
Prisma Access. The regions that have bandwidth allocation are shown first.
The format of the SPN name and number can be used to tag a port on site. It
also shows the number of Remote Networks created on an SPN to keep track of the
number of networks that can be onboarded on to this SPN. Verify that SPN Names are
correctly resolved and that the number of On-Boardings on each Region + SPN is
correct.
![]()
- CloudBlade Events show the events generated during the
CloudBlade execution. Each event has a unique code associated with it. The code
contains an event source and related details, which provide a concise description on
what can be done (if possible) to resolve the issue. An event, which causes the
CloudBlade to exit abnormally shows the Blocking value as Yes.
![]()
- Configuration Events are events generated based on tags and
site configurations. Each event has a unique event code and context used to identify
which component has caused this event. Verify that there are no errors raised for
your site, as this can happen if your tags are incorrect or the site does not meet
the criteria for on-boarding, and look into the details column for more contextual
help.
![]()
- View the status of each prisma tag defined on each port on a device from the
Interface Tag Summary tab. For every interface scanned
by the CloudBlade, this tab shows if a tunnel can be formed on a port. It also shows
the tags, which are ignored or accepted as valid by the CloudBlade.
![]()
To use the Monitor feature more effectively:
- View the Prisma Access Regions tab to see the list of prisma_region tags to use on the ports.
- View the Interface Tag Summary tab to see any invalid or wrongly typed tag on the ports.
- View the Configuration Events tab to see all warnings and errors arising due to unsupported tag or site configurations.
- View the CloudBlade Events tab to see runtime errors that occur during executions.
Configuration and CloudBlade Events
The following are the descriptions and suggested solutions for events
that may appear in the CloudBlades Events tab in the
Monitor screen. These could be helpful in identifying and
troubleshooting various scenarios.
| CloudBlade | Error Code | Scenario |
|---|---|---|
| Cloud Managed | FAWKES_PA_TENANT_NOT_FOUND |
Tenant mapping between Hub Prisma SD-WAN and Prisma
Access is incorrect.
|
| Panorama Managed |
CSP_NO_LOGIN (first install)
CSP_DB_IN_BOOTSTRAP
CSP_DB_IN_WAITING
|
Panorama configuration is incorrect OR Panorama
is unable to reach Prisma SD-WAN OR Panorama CSP may have
some issues.
|
| Panorama Managed | ERROR_CONFIG_INVALID_SERIAL | Serial number given is invalid or incorrect. |
| Panorama Managed |
CSP_STATUS_FAILED
CSP_DB_IN_BOOTSTRAP
|
When both errors are switching, the CSP crashes in a
loop.
|
| Panorama Managed |
ERROR_CSP_MT_DISABLED
ERROR_CSP_MT_ENABLED
|
Multi Tenancy is incorrect between Panorama and the
Tenant Name given in the CloudBlade configuration.
|
| Panorama Managed |
ERROR_CSP_NO_ACTIVE_LOGIN
ERROR_CSP_ONLY_PASSIVE_LOGIN
ERROR_CSP_HA_MISMATCH
ERROR_CSP_HA_DISABLED
|
When two serial numbers are given in a CloudBlade
configuration, only one serial number is active at a time.
|


