Manage ZTNA Connector
Table of Contents
Manage ZTNA Connector
The ZTNA Connector simplifies private application access by forming tunnels between
private applications and Prisma Access.
The Zero Trust Network Access (ZTNA) Connector simplifies private application
access for all your applications. You can deploy the ZTNA Connector VM in your
environment, where it automatically forms tunnels between your private applications and
Prisma Access.
Manage and Monitor ZTNA Connector in Insights
You can monitor ZTNA Connector component status from the ZTNA
Connectors dashboard in Insights.
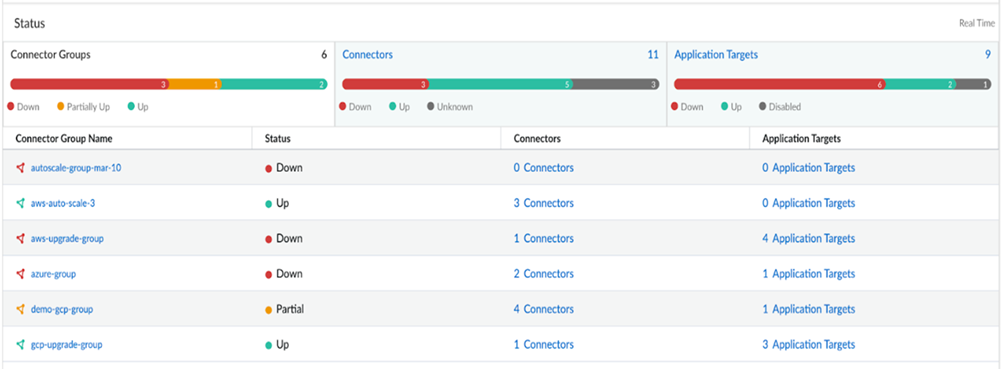
- Connector Groups—Select to see a summary of your configured Connector Groups, the number
of Connectors and Application Targets in each group, as well as the status of
each group.
![]() A Connector Group's Status is determined by the Connectors in each group.
A Connector Group's Status is determined by the Connectors in each group.- If all Connectors in a Connector Group are up, the Status is Up (green).
- If all the Connectors are down, the status is Down (red).
- If some Connectors are up and some are down, the Status is Partial (orange).
- If a Connector is disabled, it appears as gray.
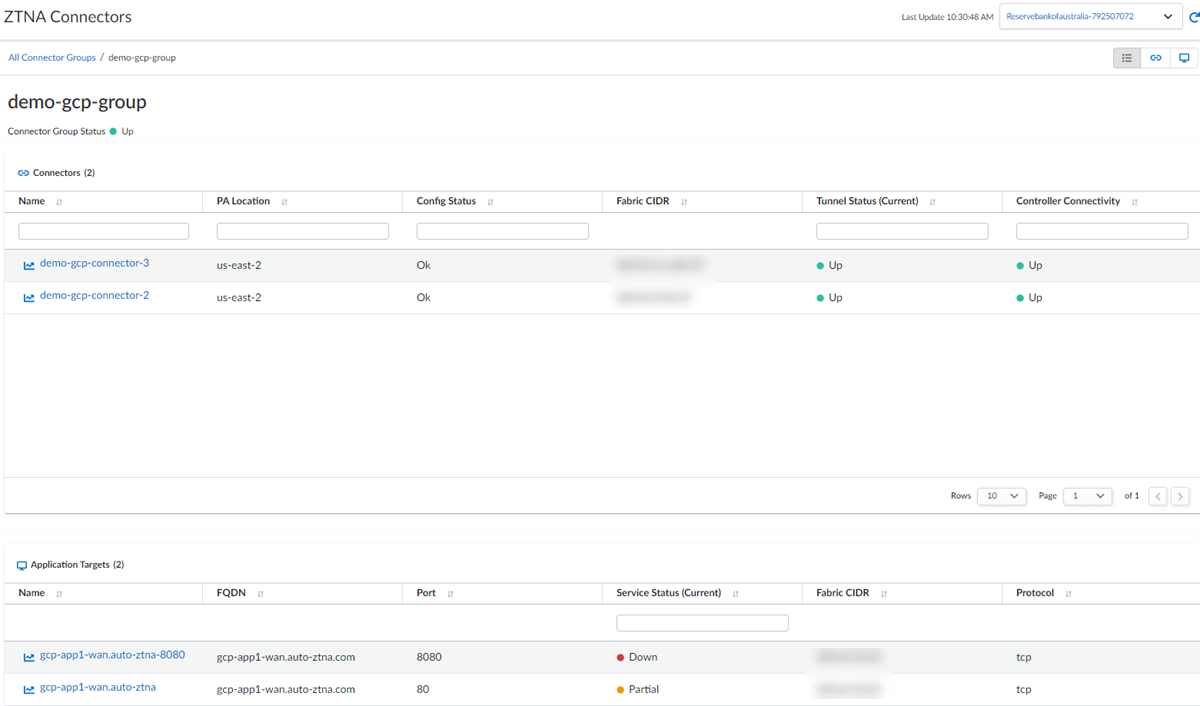
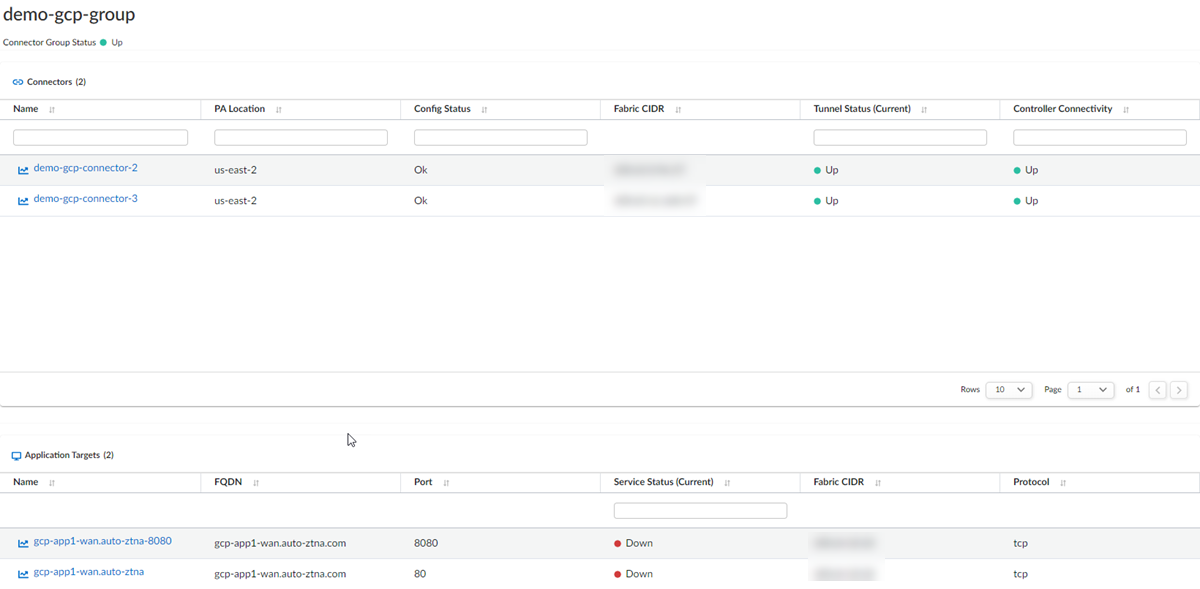
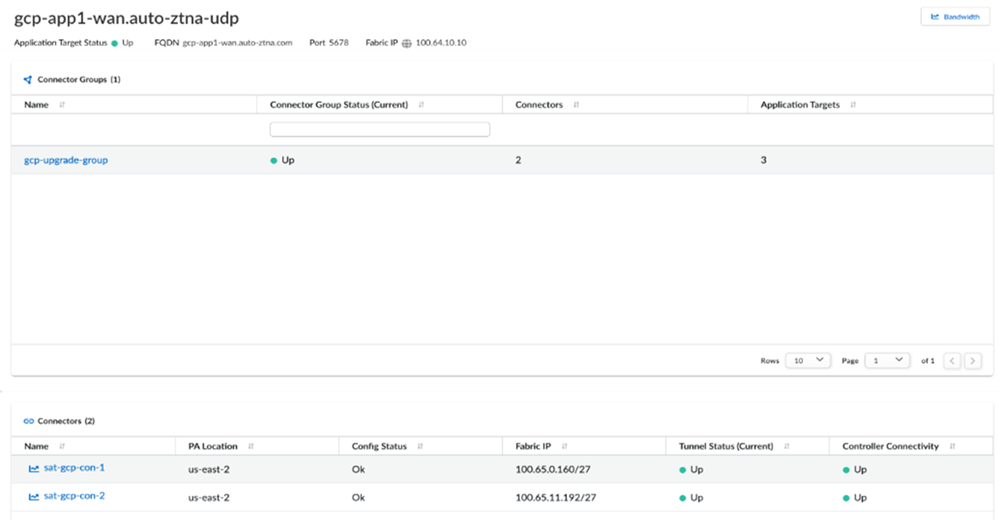
Select any Connector Group Name to see details about the Connectors and Application Targets in the group and the status of each.![]()
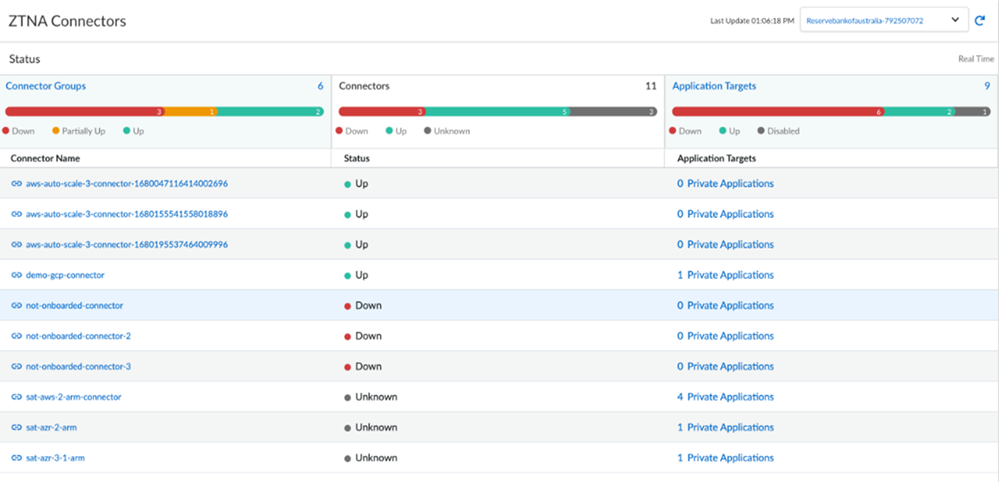
- Connectors—Select to see a summary of all configured Connectors, including the
Application Targets associated with the Connector and the
Status.
![]() Select any Connector Name to see details about the associated Connector groups and Application Targets associated with each Connector.
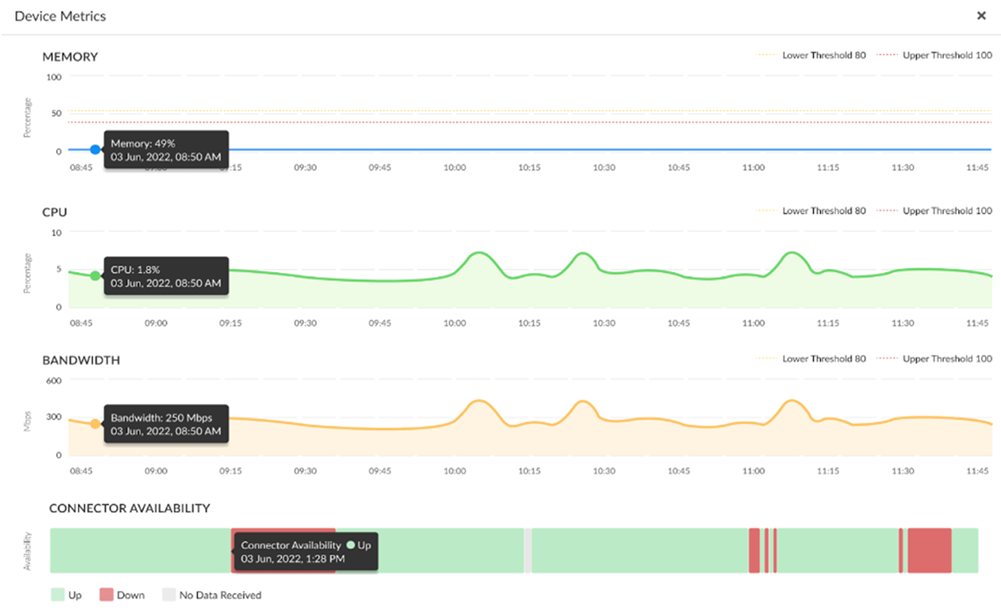
Select any Connector Name to see details about the associated Connector groups and Application Targets associated with each Connector.![]() Select Device Metrics in the upper right corner to see details about the Connector VM memory, CPU usage, bandwidth, and connector availability over time. You can hover over an individual point on each graph to see a specific statistic for a point in time.
Select Device Metrics in the upper right corner to see details about the Connector VM memory, CPU usage, bandwidth, and connector availability over time. You can hover over an individual point on each graph to see a specific statistic for a point in time.![]()
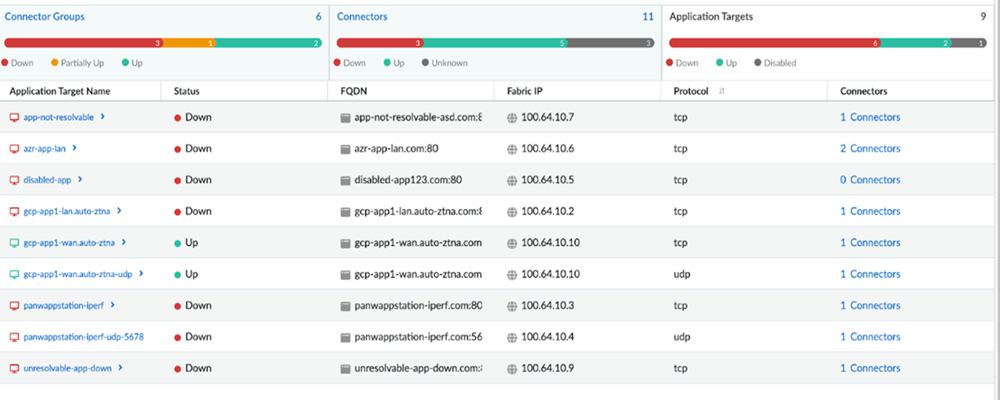
- Application Targets—Select to see a summary of all configured Application Targets, including
the following details:
- Application Target Name
- Status
- FQDN and TCP/UDP port
- Fabric IP address
- Application Protocol
- Number of Connectors associated with the application
![]() Click on any Application Target Name to see details about the Connector Groups and Connectors associated with the Application Target.
Click on any Application Target Name to see details about the Connector Groups and Connectors associated with the Application Target.![]()