Strata Cloud Manager
Command Center: Strata Cloud Manager
Table of Contents
Expand All
|
Collapse All
Strata Cloud Manager Docs
Command Center: Strata Cloud Manager
The Strata Cloud Manager Command Center provides a top-level view of the health
and security of all your users, IoT devices, hosts, and applications.
| Where Can I Use This? | What Do I Need? |
|---|---|
|
Each of these licenses include access to Strata Cloud Manager:
The other licenses and prerequisites needed to access the Command
Center:
→ The features and capabilities available to you in Strata Cloud Manager depend on which license(s) you are
using.
|
The Strata Cloud Manager Command Center is your new NetSec homepage; it is an
interactive visual summary that will help you assess the health, security, and
efficiency of your network. The command center provides a consolidated view of the
NetSec platform, and gives you comprehensive visibility into your Sources, Applications,
Prisma Access deployment, your NGFWs, and your security services in a single place.
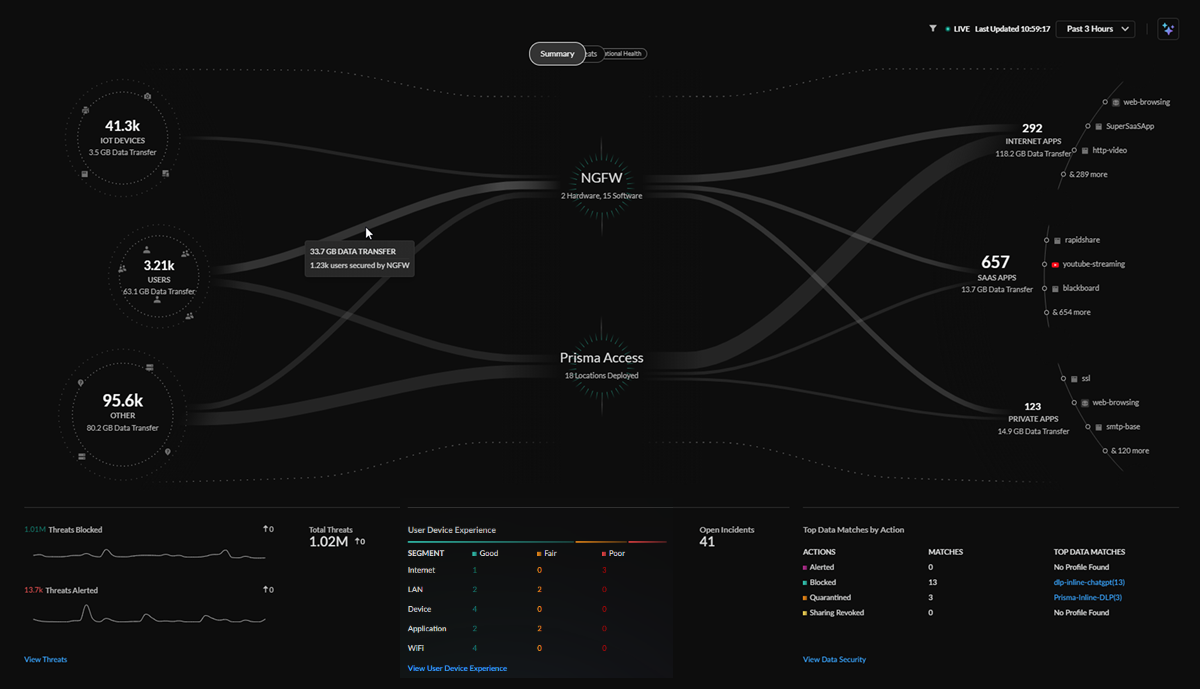
The command center enables you to interact with the data and visualize the relationships
between events on the network, so that you can take immediate actions to strengthen your
security.
The command center is integrated with the new Activity Insights dashboards
(InsightsActivity Insights), and will highlight anomalies detected by your onboarded
licenses and subscriptions through actionable insights, and provide a path to remediate
those anomalies.
From the new homepage, you can see:
- A comprehensive view of all traffic on your network flowing between sources (users, IoT devices, external hosts) to applications (internet, SaaS, private).
- How assets such as users, devices, and applications are being accessed and secured.
- Navigate to specific dashboards with context for deeper understanding of the issues impacting your network.
- Types of threats encountered while users are working.
Launch Strata Cloud Manager and click Command Center
(
![]() ) to get started.
) to get started.
How to Interact with the Strata Cloud Manager Command Center
Each view in the command center neatly breaks down all the information you would need
to assess the health and security of your network.
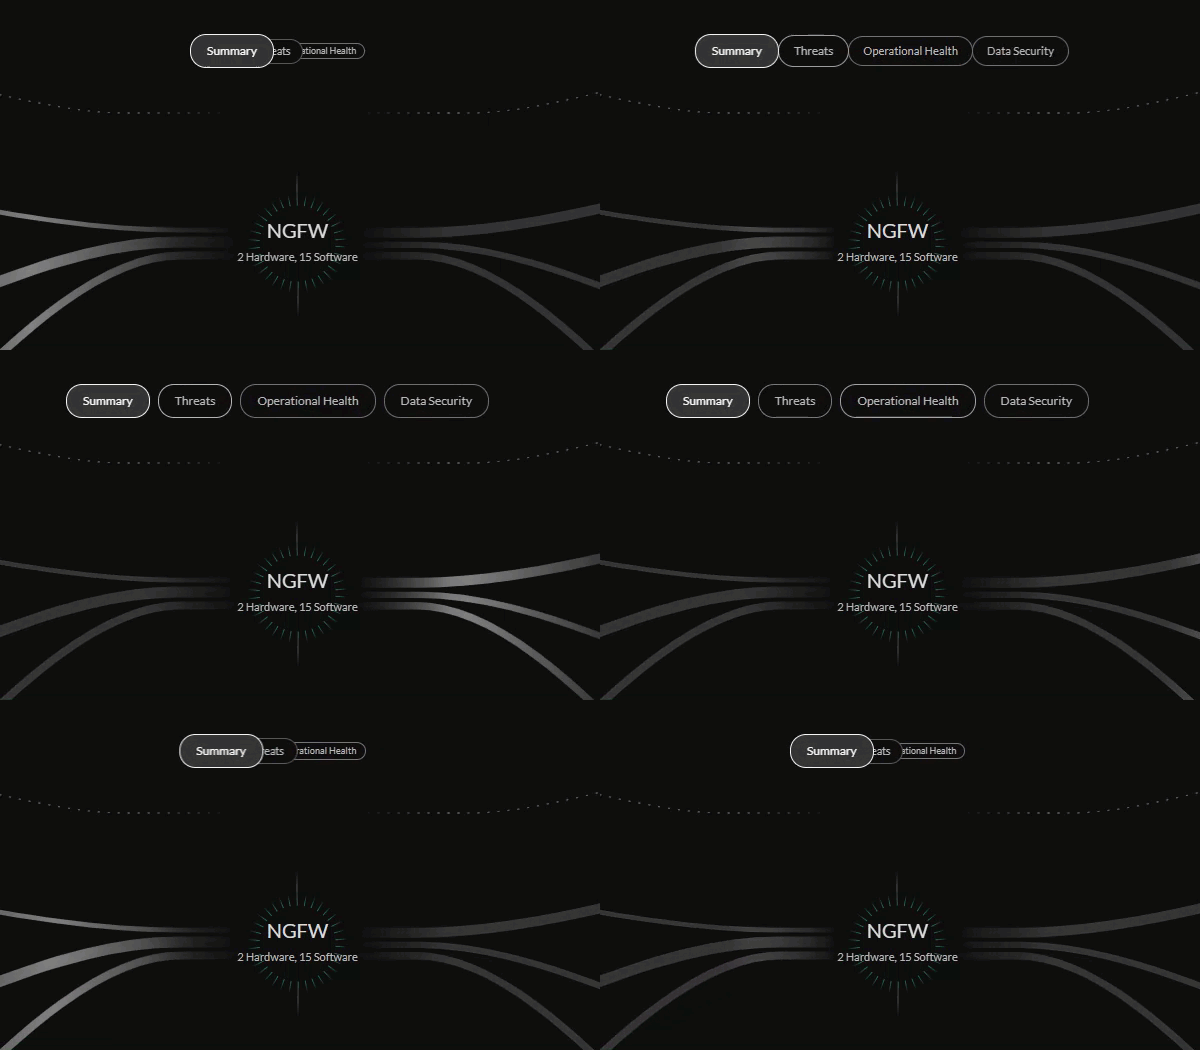
The command center automatically refreshes data every 5 minutes and displays the last
24 hours of data by default. You have the option to filter this data for different
time periods: the past 1 hour, 3 hours, 7 days, or 30 days.
Each command center view displays different types of visual data flowing from the
sources, through Prisma Access and NGFWs or security subscriptions deployed on your
network, to the various applications on your network.
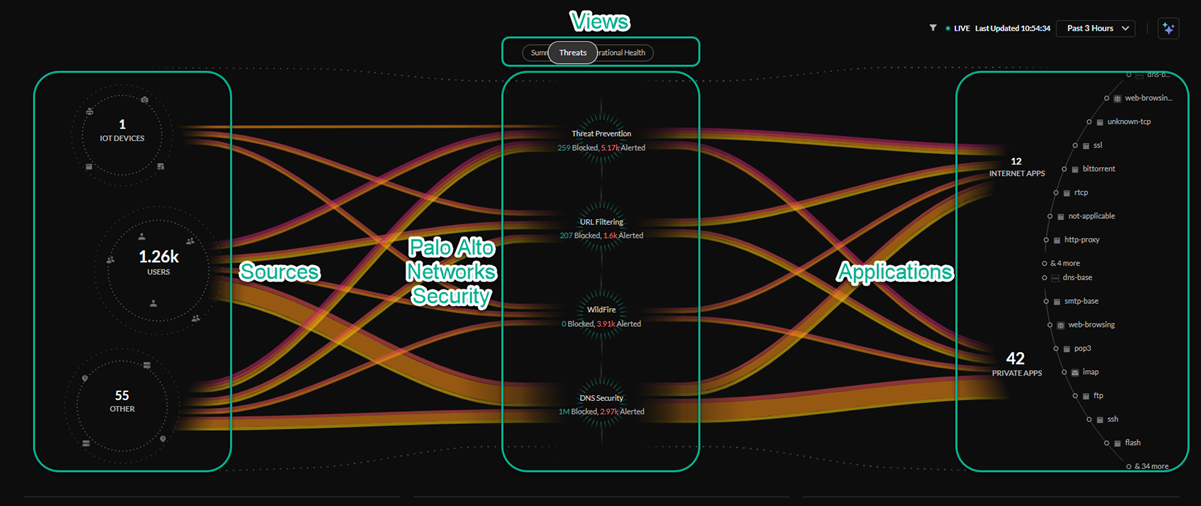
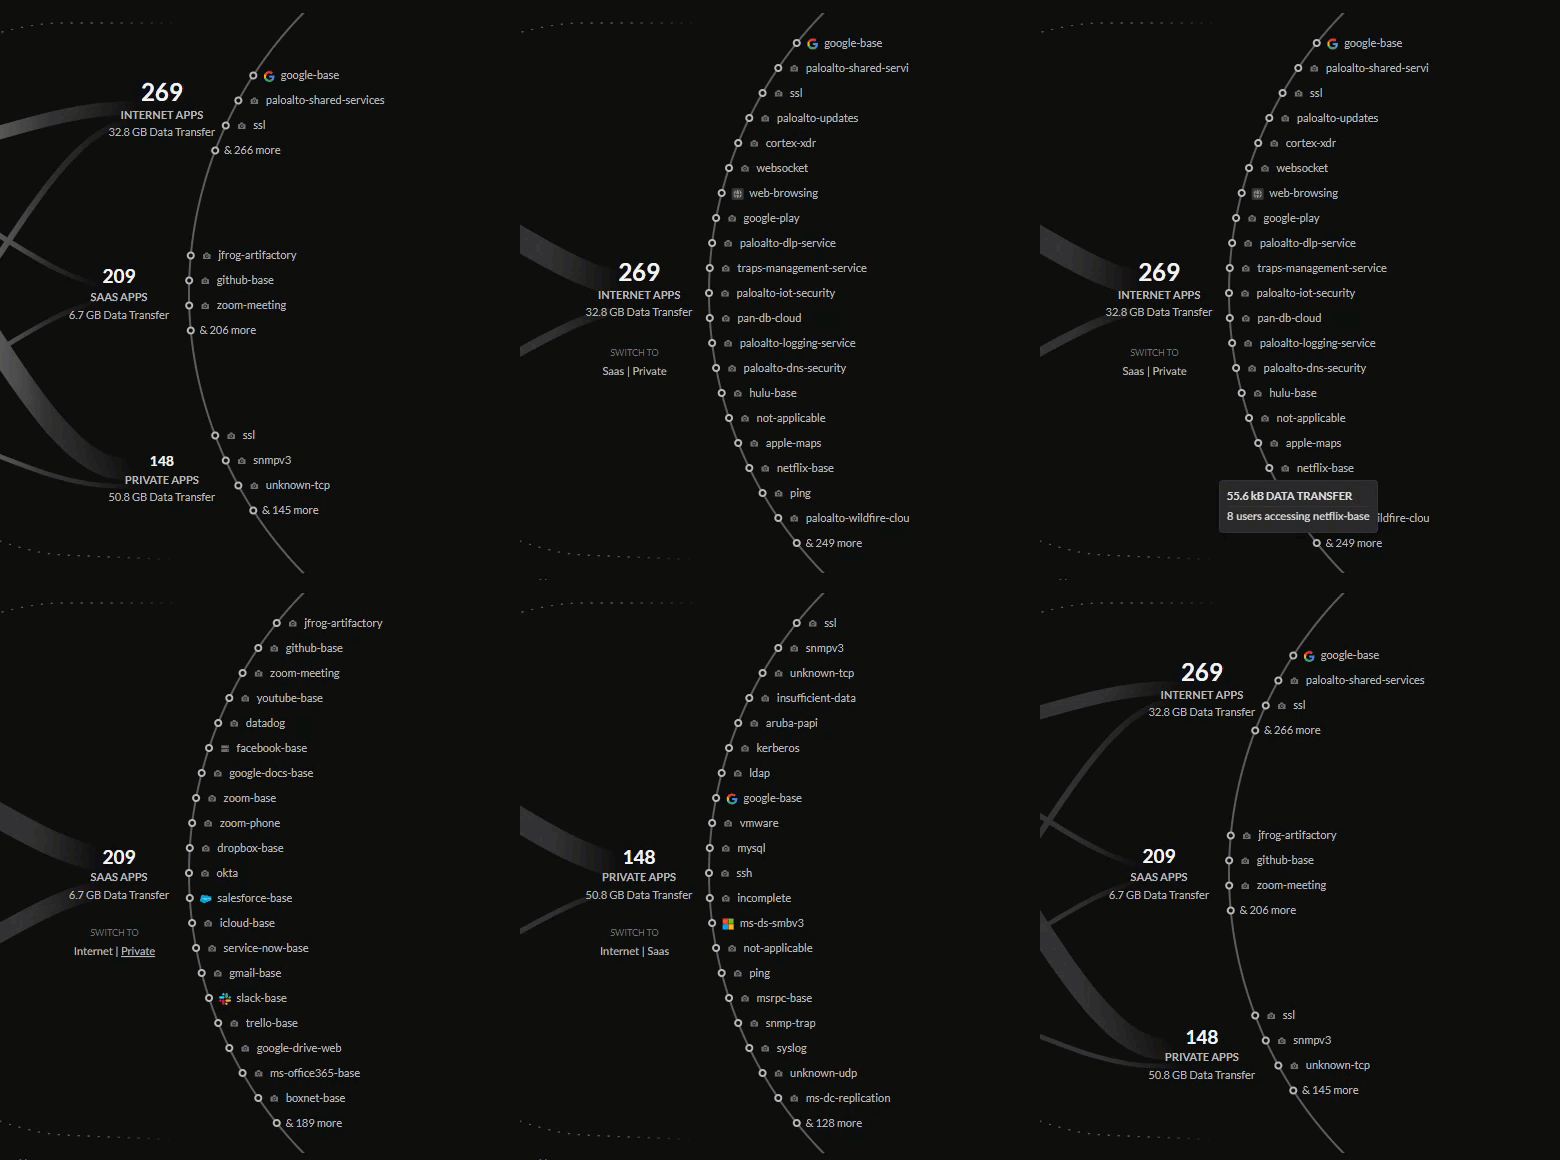
The Sources bubbles (hybrid workers, office users, IoT devices, Prisma Access
Browser-Enabled users, and others) are on the left and the Applications bubbles
(accessed on the internet, SaaS, and hosted on-prem or in-cloud) are on the right.
The application bubbles display the top three most used applications in each
category.
Sources include:
- IoT Devices – Devices discovered by an active IoT Security license and enabled.
- Users – Remote and Branch users.
- Other – Internal and external hosts accessing resources on the internet.
Applications include:
- Internet Apps – Applications accessed using a web browser.
- SaaS Apps – Cloud apps owned and managed by an application service provider.
- Private Apps – Applications hosted in a data center.
You can filter the data in the central view by clicking on the bubbles for sources,
deployments, or applications. This will provide you a more detailed view of the
tracked data for that view in relation to the bubble selected.
By selecting filters (
![]() ), you can filter the data in the command center
views by Tenant orNGFW or
Prisma Access specific data.
), you can filter the data in the command center
views by Tenant orNGFW or
Prisma Access specific data.

Hovering over the sources allows you to see the Agent-Enabled User Devices and PA
Browser-Enabled User Devices.
With an AI Access license, you can filter
the traffic in all command center views by GenAI Apps only to
better evaluate how GenAI apps in use by users on your network might be affecting
your data security.
For more
information on AI Access Security and AI Access Security licenses, see AI Access Security.

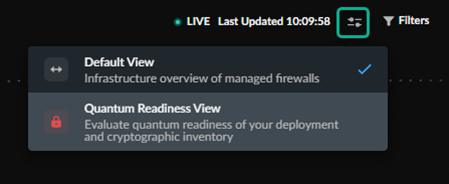
With an Strata Cloud Manager Pro license, you
can enable the Quantum Readiness View to start evaluating
your post-quantum cryptography (PQC) posture.
For more information
about PQC, Quantum Security, and Quantum Readiness, click here.

|
|
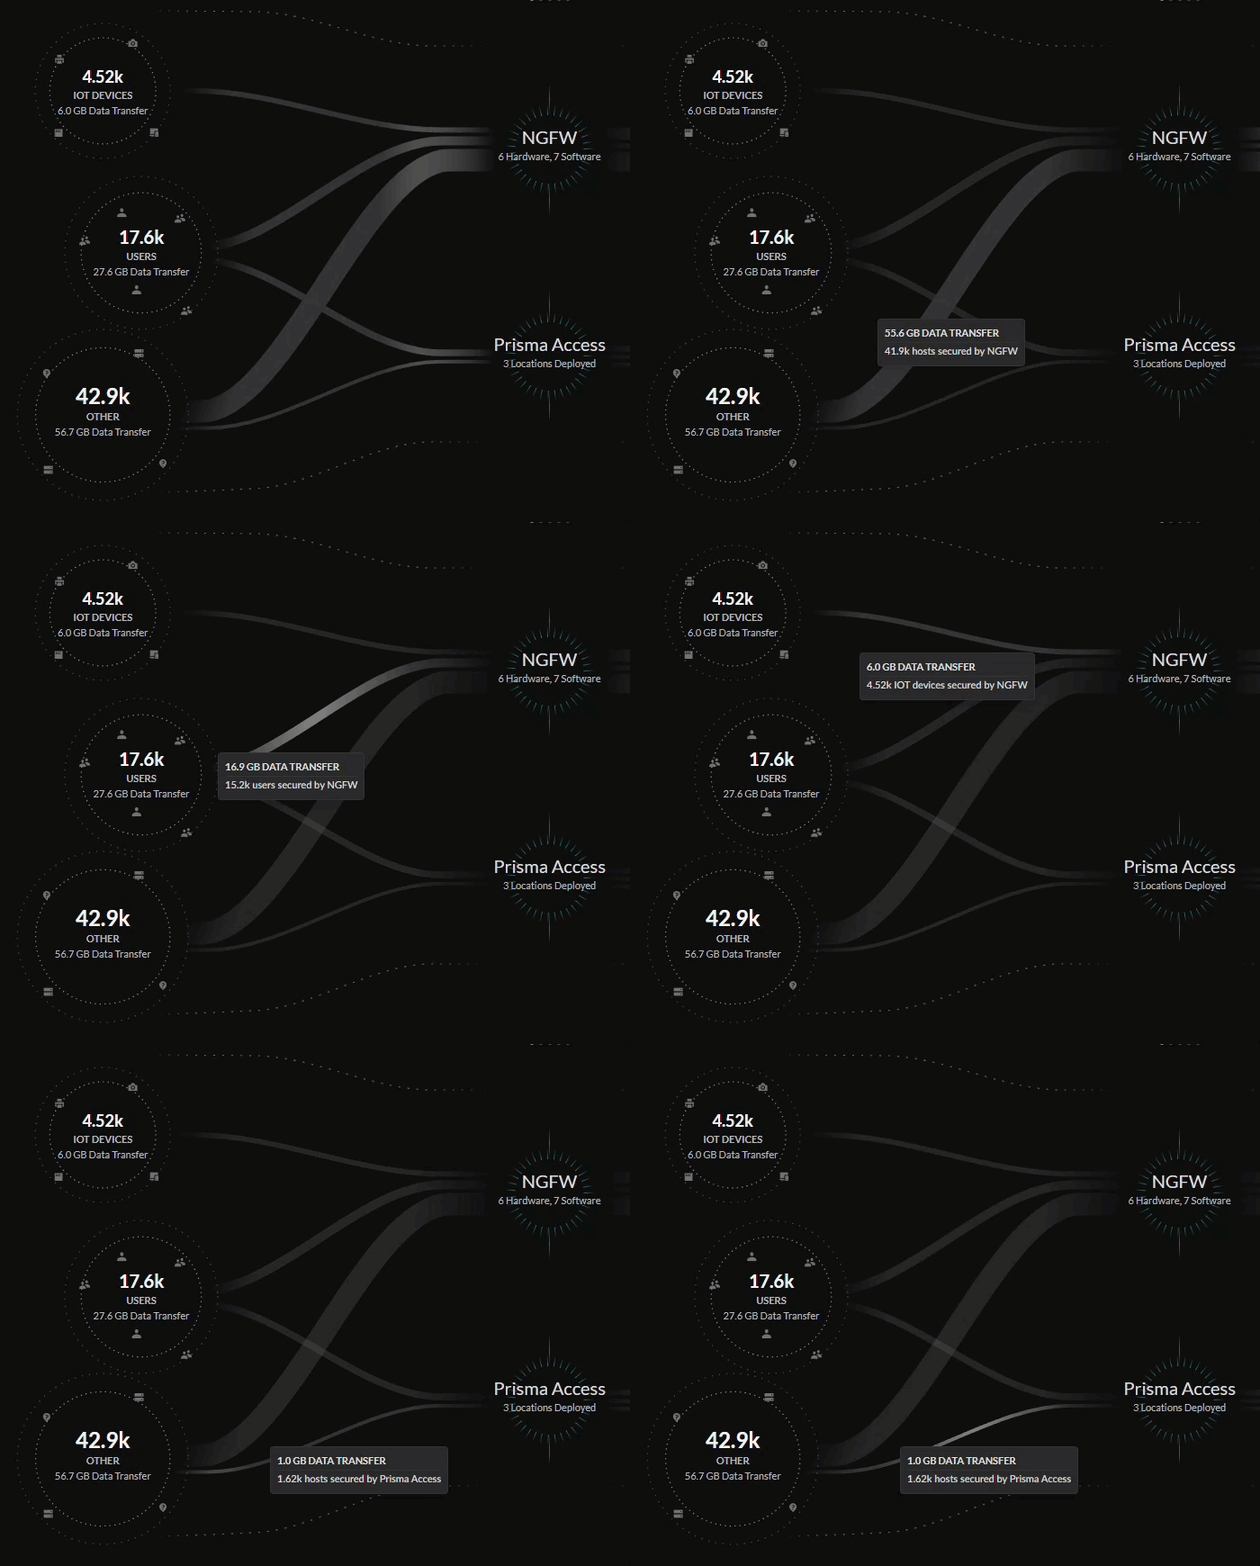
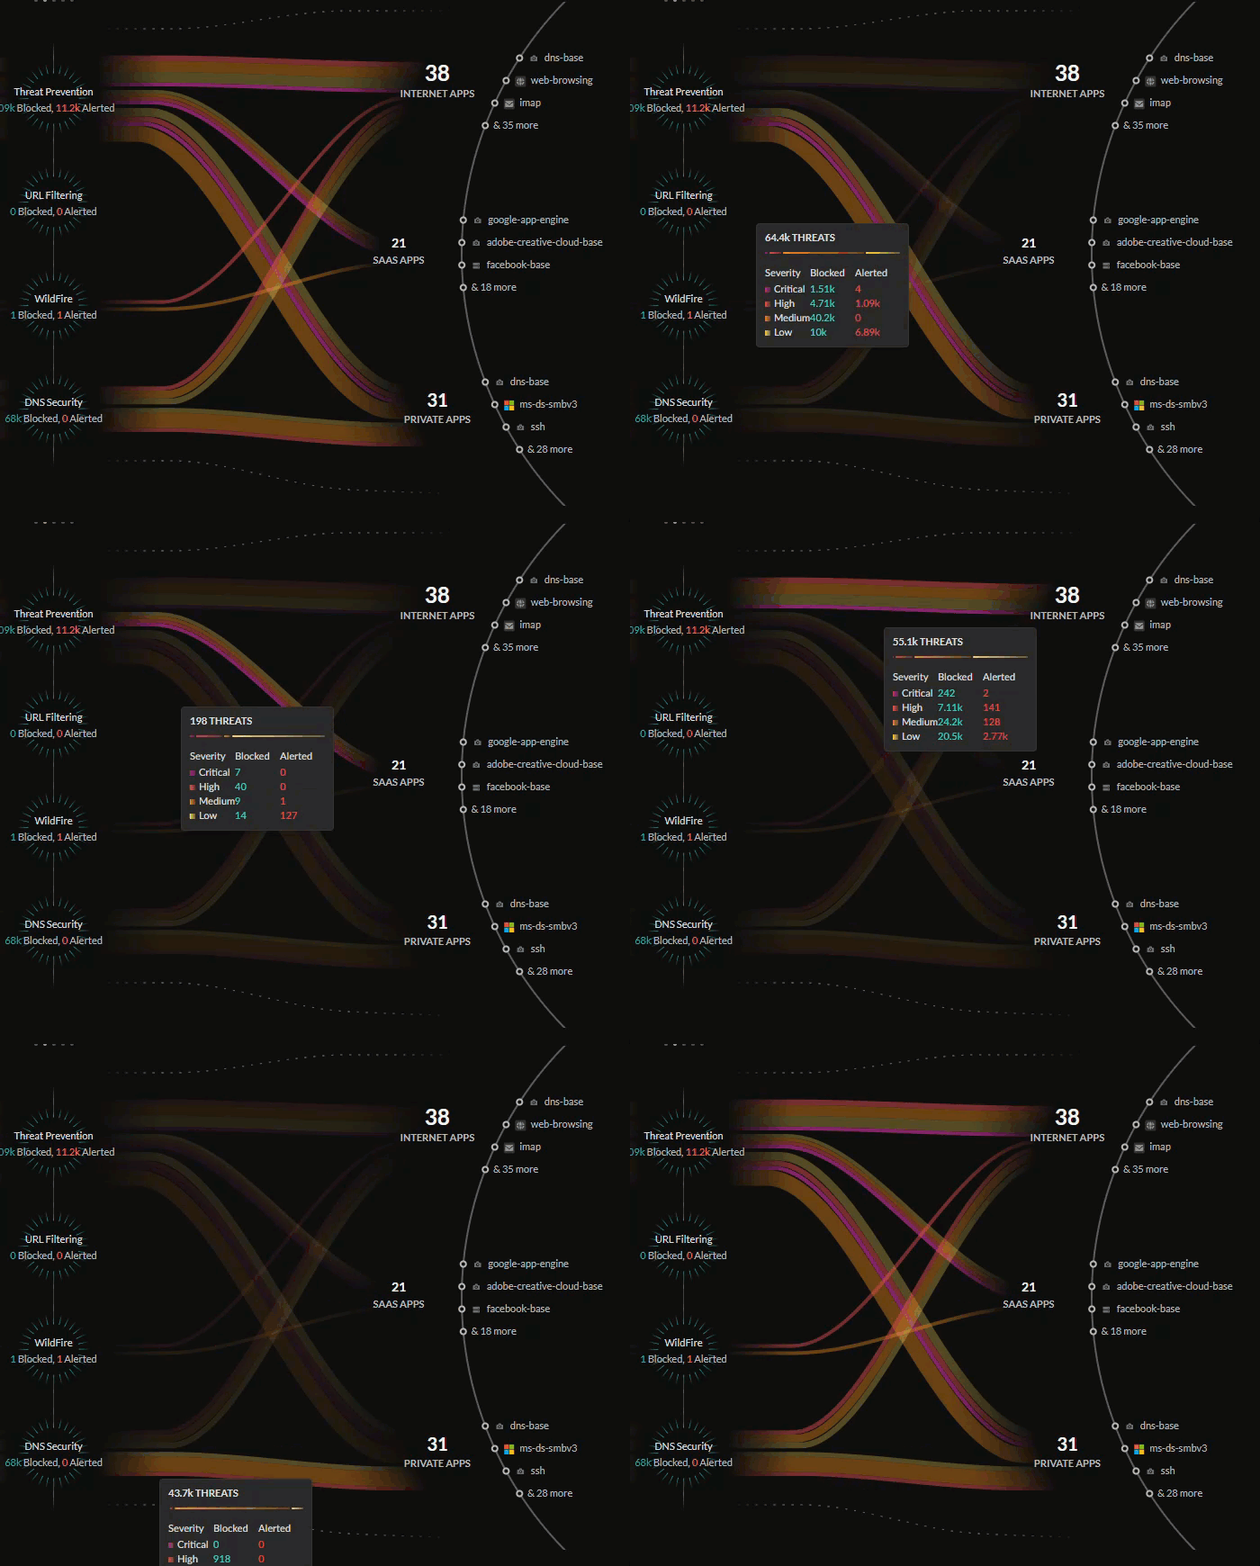
When looking at one of the views, you can mouse over the lines for more information
about your network, such as the traffic or the threats blocked or allowed on your
network.
|
|
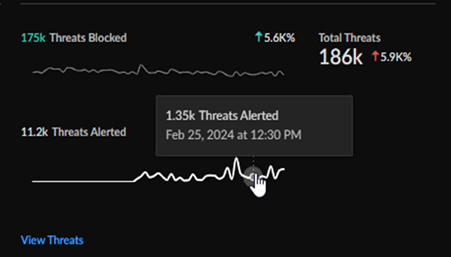
Below the central visual summary are several key metrics tracked by your activated
subscriptions that provide actionable insights into your network. These key metrics
provide the ability to navigate to one of several detailed context pages where you
can find more information about the metrics that have surfaced and drill-down into
possible solutions.
|
|
Strata Cloud Manager Command Center Views
The command center provides you with four different views, each with their own
tracked data and metrics to examine and interact with.
Command Center (Summary)
Review the data provided by the Summary view.
The Summary view displays a high-level look at all traffic
from your users, external hosts, IoT devices, and applications, as well as a preview
of some of the issues and anomalies on your network that are spotlighted by the
other views. You can use this view as the first-look into the health of your network
each day.
| Summary Licenses |
|
Central Summary View
The central Summary view provides a look into the data being transferred between
the IoT devices, users, external hosts accessing resources from the internet,
internet apps, SaaS apps, and private apps on your network.
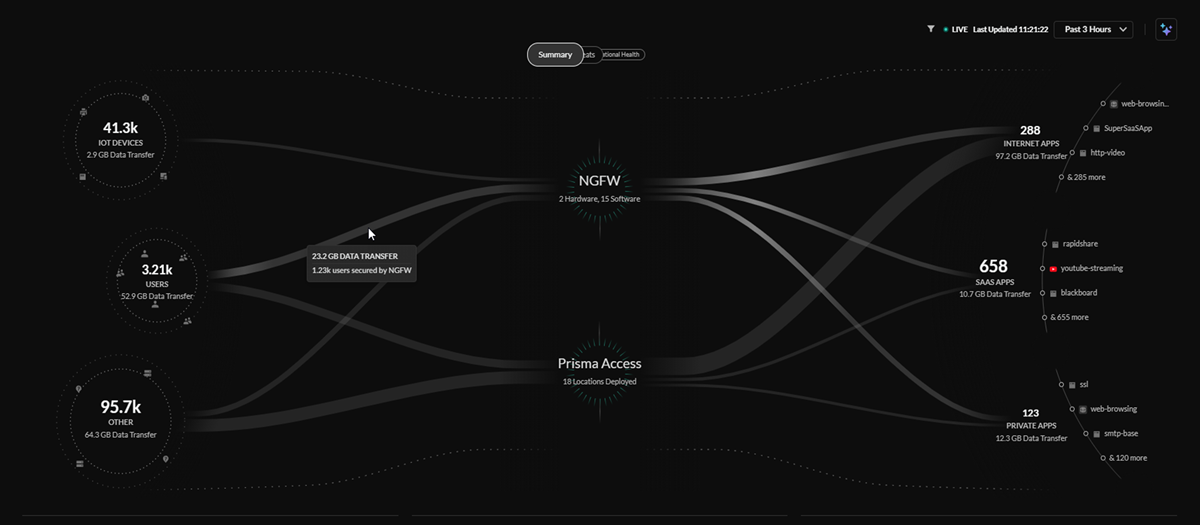
The lines in the central Summary view represent the data transfers and traffic on
your network, with the thickness of the lines representing the volume of data
being transferred from sources and applications.
You can see how these sources are being secured by your network infrastructure:
- Prisma Access deployments
- Next-Generation Firewalls from your Strata Logging Service inventory
Total Threats Count
The Total Threats Count widget gives you a quick view into
the total number of threats detected in your network, how many threats have been
blocked, how many threats have been alerted, and the change in threats from a
selected time range.

Click through to the Activities Insights (InsightsActivity InsightsThreats) screen for a more detailed breakdown of threats on your
network.
Open Incidents and User Experience
The Open Incidents and User Experience widget
gives you a view into the total count of open incidents, the breakdown of good
and potentially degraded user experience from individual segments in the service
delivery chain from a user device to an application, and the change in open
incidents from a selected time range.
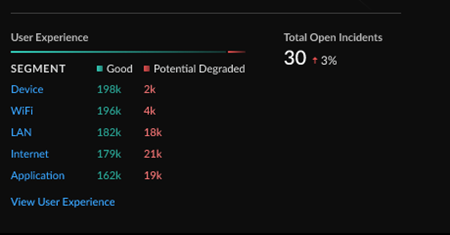
Click through to the Application Experience dashboard () for a more detailed breakdown of the health and user
experience across your network and performance metrics.
Top Data Profiles by Action
The Top Data Profiles widgets gives you a view into the
top predefined data filtering profiles, the number of matches found in network
traffic, and the action taken for sensitive data based on those data profiles.
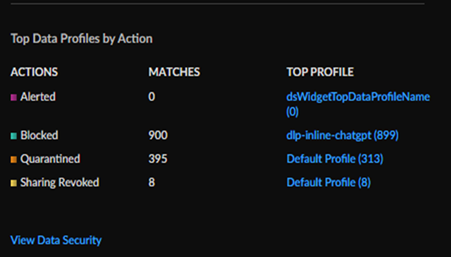
Click through to the Data Security view (Command CenterData Security) for a more detailed breakdown of sensitive data on your
network.
Top GenAI Use Cases by Users and GenAI Apps
The Top GenAI Use Cases by User widget gives you a view
into the top use cases for GenAI apps being utilized by users on your networks,
the amount of users for each use case, and the amount of GenAI apps that fall
under each use case.
You can also see the total number of GenAI apps on your networks, as well as the
percentage shift in apps based off of the time filter.

Click through to the AI Access Security (InsightsAI Access) dashboard in Activity Insights for a more detailed
breakdown into GenAI app adoption on your network and recommendations for how to
better secure your data.
For more information about how your
organization can safely adopt GenAI applications while mitigating risks to your
data security, see AI Access Security.
Threats
Review the data provided by the Threats view.
The Threats view shows the traffic inspected on your network
and threats detected by your CDSS subscriptions. You can use this view to monitor
the blocked and alerted threats on your network or investigate areas of your network
that need updated policies to better block any alerted threats.
| Threats Licenses |
|
Central Threats View
The central Threats view provides a look into all the threats on your
network that have been identified by your active Cloud-Delivered Security
Services subscriptions.
The Threats view will show how your Palo Alto Networks CDSS
subscriptions are protecting your traffic by monitoring potential threats on
your network. The Command Center gives you insight into the percentage of
traffic inspected for your IoT devices, users, and applications, and the total
number of threats allowed or alerted.
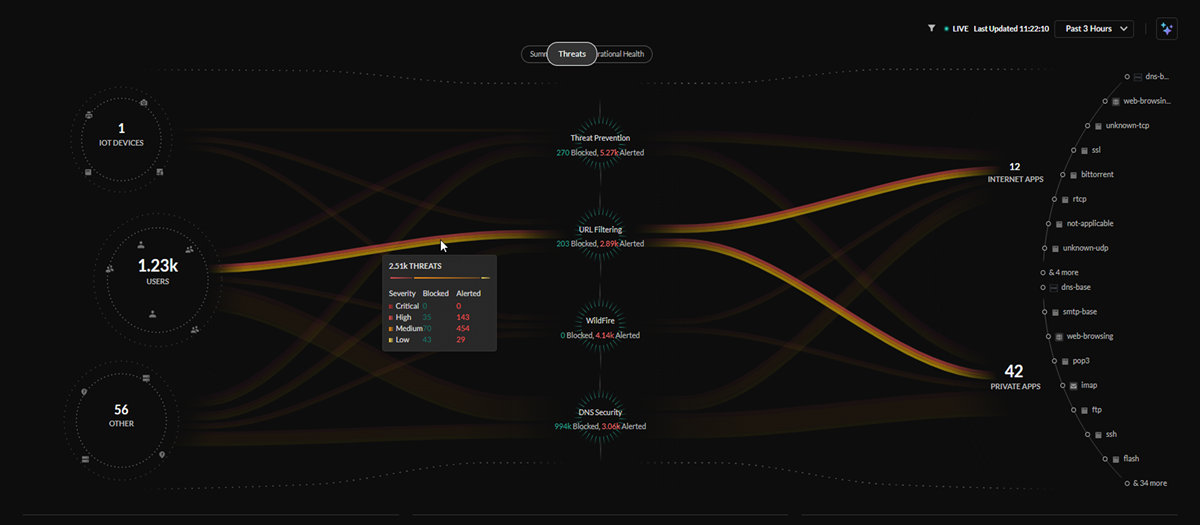
The lines in the central Threats view represent the traffic being
monitored by your security subscriptions, with the thickness representing the
volume of threats detected and the color representing if the threats are of
critical, high, medium, or low severity.
Security Subscriptions
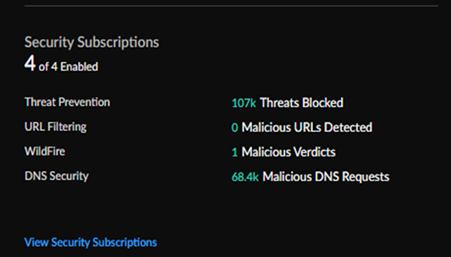
The Security
Subscriptions widget gives you a view into your Cloud-Delivered
Security Subscriptions, which ones are active, and a snapshot of how they are
securing your network.
| Subscription | Description |
|---|---|
| Threat Prevention | Threat Prevention defends your network against both commodity threats—which are pervasive but not sophisticated—and targeted, advanced threats perpetuated by organized cyber adversaries. |
| URL Filtering | Advanced URL Filtering is our comprehensive URL filtering solution that protects your network and users from web-based threats. |
| WildFire | The cloud-delivered WildFire malware analysis service uses data and threat intelligence from the industry’s largest global community, and applies advanced analysis to automatically identify unknown threats and stop attackers in their tracks. |
| DNS Security | Automatically secure your DNS traffic by using Palo Alto Networks DNS Security service. |

Total Threats Count
The Total Threats Count widget gives you a quick
view into the total number of threats detected in your network, how many threats
have been blocked, how many threats have been alerted, and the change in threats
from a selected time range.

Click through to the Activities Insights (InsightsActivity InsightsThreats) for a more detailed breakdown of threats on your
network.
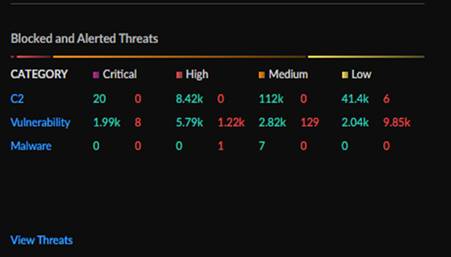
Blocked and Alerted Threats
The Blocked and Alerted Threats widget gives you
a top-down-view of the threats being detected in your network, organizing them
by category, threat level (critical, high, medium, and low), and if the threats
have been blocked or alerted.

Click through for a more detailed table of all the threats impacting your network (InsightsActivity InsightsThreats).
Operational Health
Review the data provided by the Operational Health view.
The Operational Health view shows the health of
infrastructure and user experience on your network. You can use this view to monitor
the health of your NGFWs and Prisma Access deployments as well as the user
experience on your network and review the severity of open incidents in each area.
| Operational Health Licenses |
|
Central Operational Health View
The central Operational Health view provides a look into the health of
infrastructure and of the user experience on your network. If users have an
Autonomous Digital Experience Management (ADEM) license, they will receive
enhanced data in this view.
The Operational Health view will show how your Palo Alto Networks ADEM
subscription monitors the digital experience across all users, and applications
in your SASE environment.
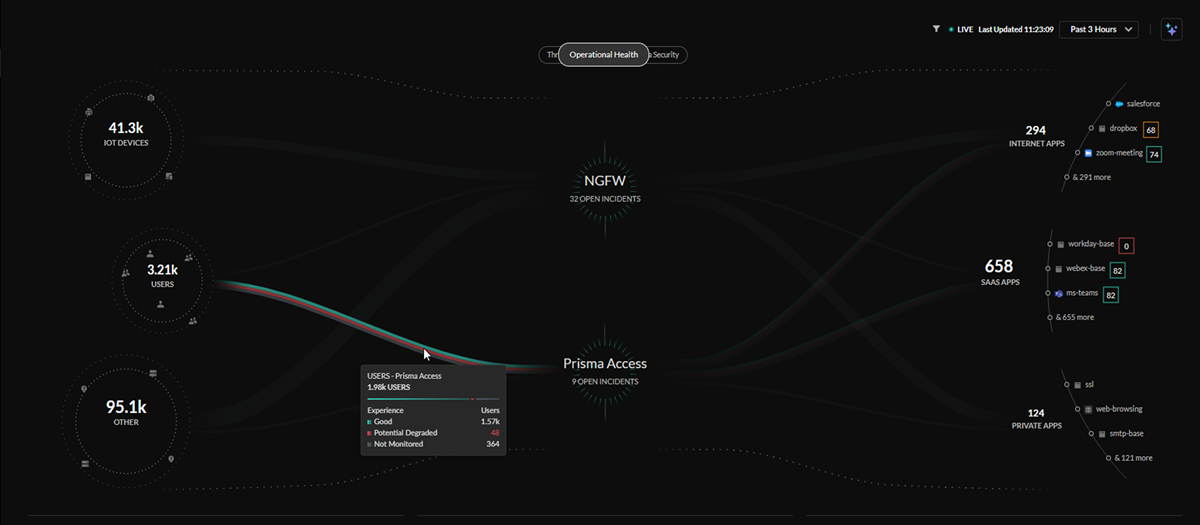
The lines in the central Operational Health view represent all the
users on your network. The users are organized by user experience score, with
the colors of the lines representing a rating of good, poor, or unmonitored.
Total Open Incidents and Incidents by Severity
The Open Health Incidents by Severity widget
gives you a view into the all open incidents on your network, broken down by
scope (NGFW, Prisma Access, and Prisma SD-WAN), severity, and quantity of
incidents.
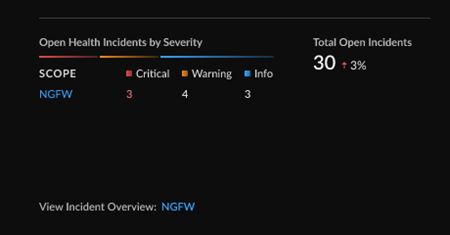
The widget tracks the percent change in open incidents based on the time period
selected.
Click through to the
Incidents dashboard for each available scope (IncidentsPrisma Access / NGFWAll Incidents).
Top Subcategories for Open Health Incidents
The Top Subcategories for Open Health Incidents
widget gives you a view into the top subcategories of the open health incidents
on your network, organized by scope, subcategory, quantity of incidents, and
what is impacted (data centers, sites, devices, etc.).
The widget will display the top five subcategories for a single scope, or the top
two subcategories for multiple scopes when available.
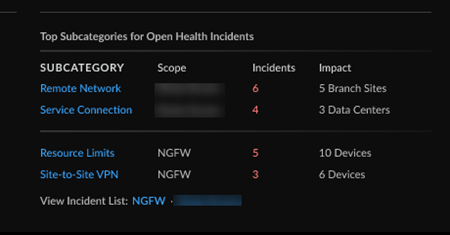
Click through to the
Incidents dashboard for each available scope (IncidentsPrisma Access / NGFW/Prisma SD-WAN).
Monitored User Devices and User Device Experience
The Monitored User Devices and User Device
Experience widget gives you a view into the total count of open
incidents, the breakdown of good and potentially degraded user experience from
individual segments in the service delivery chain from a user device to an
application, and the change in open incidents from a selected time range.
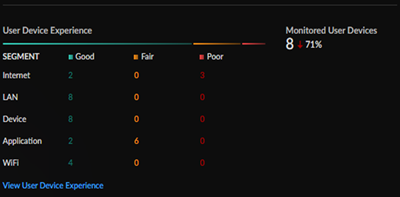
Click through to the Application Experience
dashboard (InsightsOperationalApplication Experience) for a more detailed breakdown of experience across your
network and performance metrics.
Data Security
Review the data provided by the Data Security view.
The Data Security view shows all the sensitive data
detected across your network and various connected SaaS applications. You can use
this to monitor and identify high risk sensitive data flows in your organization.
| Data Security Licenses |
|
Central Data Security View
The central Data Security view provides the sensitive and high risk
data map across your network and connected SaaS applications. The command center
gives you insight into sensitive data users in the organization, the specific
sanctioned, unsanctioned, tolerated, or untagged applications where there is
sensitive data activity detected (asset upload, download, or assets exposed) as
well as number of assets allowed, blocked, quarantined, revoked sharing, or
exposed.
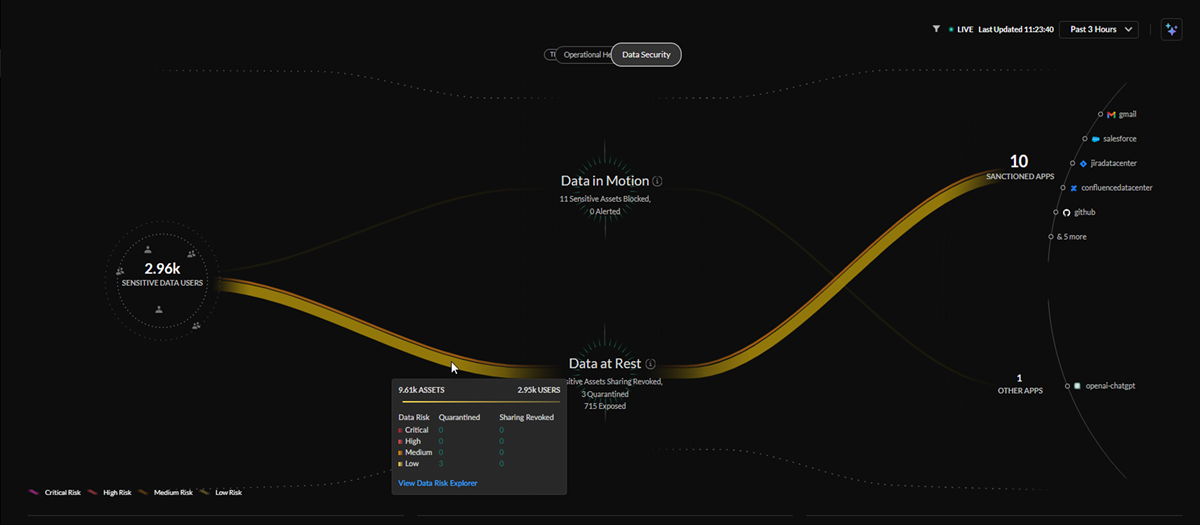
The lines in the central Data Security view represent sensitive data
being detected through data at rest and data in motion security solutions, with
the thickness of the lines representing the quantity of data and the color
representing whether that data has been flagged or classified as critical, high,
medium, or low risk.
Security Subscriptions
The Security Subscriptions widget gives you a
view into your Data Security Subscriptions, which ones are active, and a
snapshot of how they are securing your network.
| Subscription | Descrition |
|---|---|
| DLP Inline | Enterprise DLP is a cloud-based service that uses supervised machine learning algorithms to sort sensitive documents into categories to guard against exposures, data loss, and data exfiltration. |
| SaaS Inline | The SaaS Inline solution works withStrata Logging Service to discover all the SaaS applications that are being used on your network. |
| SaaS API | SaaS API is a cloud-based service you can connect directly to your sanctioned SaaS applications using the cloud app’s API and provide data classification, sharing or permission visibility, and threat detection within the application. |
| Posture Security | SaaS Security Posture Management (SSPM) helps detect and remediate misconfigured settings in sanctioned SaaS applications through continuous monitoring. |
| Email DLP | Email DLP is an add-on to Enterprise DLP that prevents exfiltration of emails containing sensitive information with AI/ML powered data detections. |
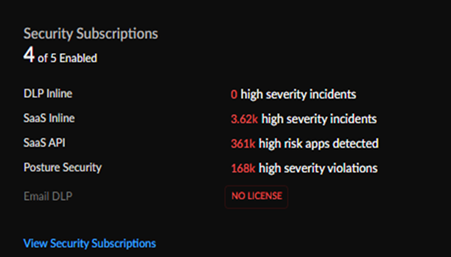
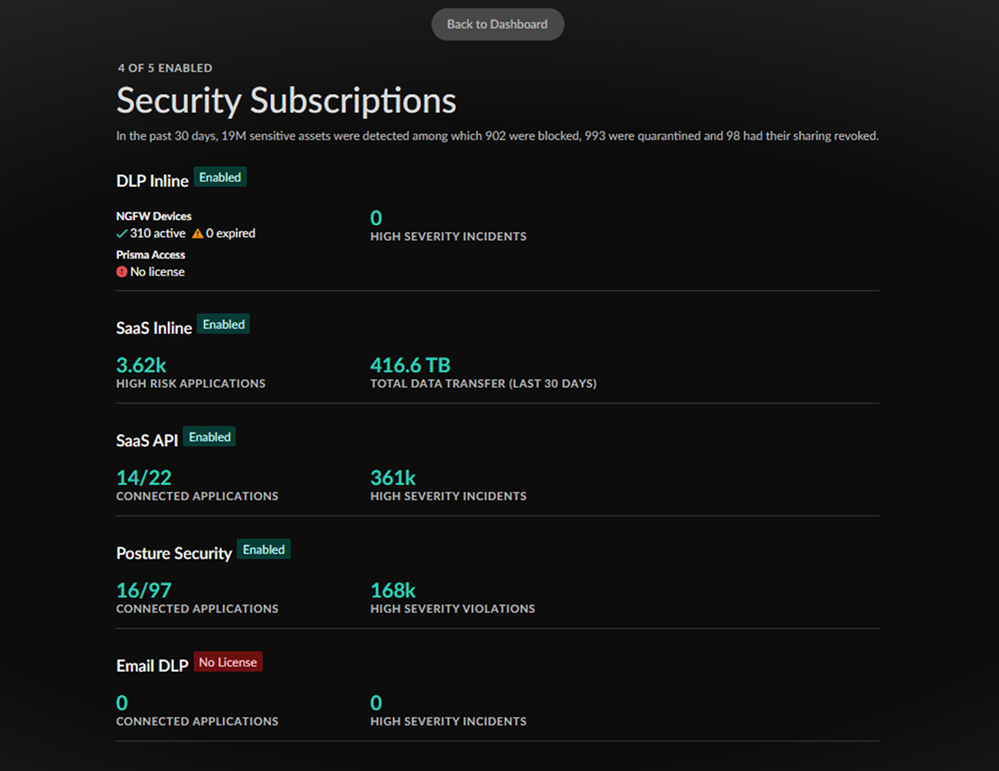
Clicking on the Security Subscriptions widget (Command CenterView Security Subscriptions) gives you a detailed report of the status of your
subscriptions in relation to your NGFW and Prisma Access deployments. Click
Back to the Dashboard to return to the
Data Security view.
Top Data Profiles
The Top Data Profiles widget shows the top data
profiles detected across all the sensitive data inspected, the severity of the
data profile as well as the number of asset matches detected inline with data in
motion versus data at rest.
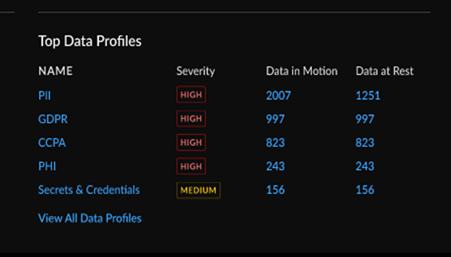
Click through to the Data Loss Prevention
dashboard (ConfigurationData Loss Prevention) to review all predefined data profiles and add custom
data profiles.
Data Trend
The Data Trend widget shows trend in sensitive
data monitored by your data security subscriptions, organized by the percent
change in total assets, data risks, and posture violations.
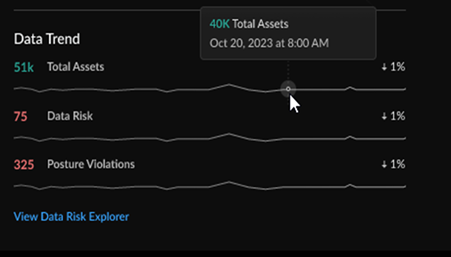
Click through to the Data Risk dashboard
(ConfigurationData Loss PreventionData Risk) to understand your overall data risk score and review
actionable recommendations to improve the data security posture of your
organization.
Command Center (App Security)
Learn about the new App Security dashboard in Strata Cloud Manager.
The App Security view displays a high-level look at the security
of your web applications and APIs. Review protected applications, anomalies protected by
your policies, alerted and blocked attacks, and discovered applications not currently
protected by any security policy.
To learn more about how App Security keeps your network safe, click here.
| App Security Licenses and Requirements |
|
Central App Security View
The central App Security view provides a look into the data being transferred between
sources and private and discovered apps.
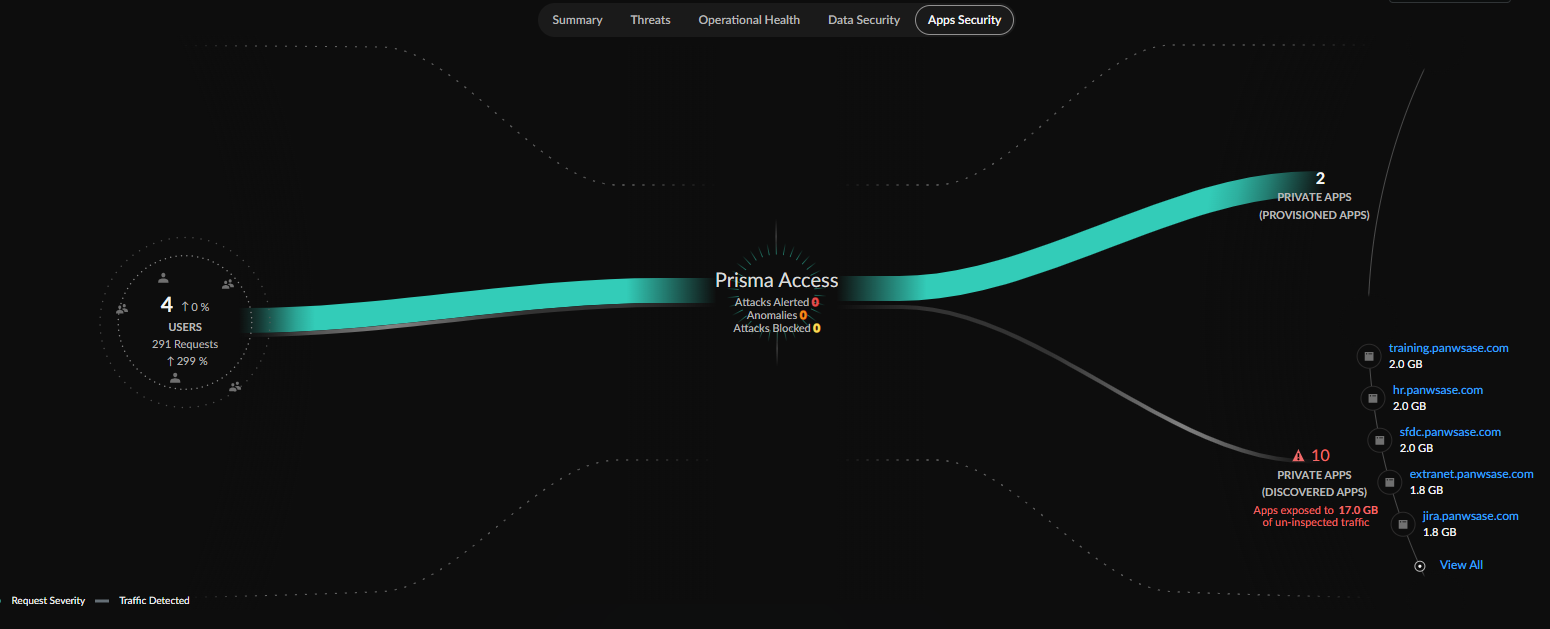
The lines in the central App Security view represent the total requests made on your
network, with the thickness of the lines representing the volume of data being
transferred from sources and applications.
You can see how these sources are being secured by your Prisma Access deployments
with the requests organized into attacks (alerted and blocked), anomlaies, and
clean.
The breakdown of applications also provides insight into the number of attacks to
your most used apps.
Total Traffic Requests
The Total Traffic Requests widget gives you a quick view into
the total number of traffic requests made, including Total
Attacks, Attacks Blocked, and how those are
trending on your network.
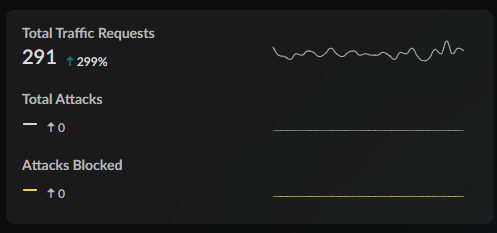
Filtering the Command Center by time period shows you the percent increase or
decrease in each count over that selected period.
Recommended Policies and Anomalies Detected
The Recommended Policy and Anomalies Detected widget gives you
a view into the total number of Anomalies detected on your network as well as the
recommended policy actions you could complete to help lower that number.
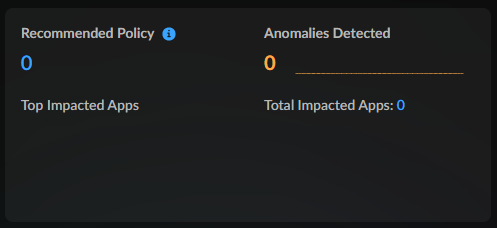
Filtering the Command Center by time period shows you the percent increase or
decrease of Anomalies and Recommendation over that selected period.
Clicking through the widget brings you to the Recommended tab
of the Application Security dashboard, allowing you to start
enabling policies to secure your network.
Previewed Policies and Attacks Alerted
The Previewed Policies and Attacks Alerted widget gives you a
view into the previewed policies from App Security and the
number and trend of attacks alerted on your network.
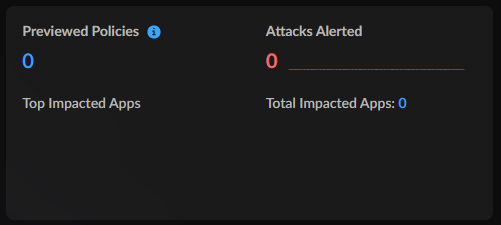
Filtering the Command Center by time period shows you the percent increase or
decrease in requests and attacks over that time period.
