Prisma SD-WAN
Use Case 1 - Protect a Business Critical SaaS Application
Table of Contents
Use Case 1 - Protect a Business Critical SaaS Application
Use Case 1: Protecting A Business Critical SaaS Application
| Where Can I Use This? | What Do I Need? |
|---|---|
|
|
- Active Paths:
- Direct on Primary internet (Verizon at the example site).
- Direct on Secondary internet (Comcast at the example site).
- Backup Paths: None
- Layer 3 Failure Paths: Direct on Metered 5G.
- Use Link Quality Monitoring (LQM) information available from the branch to DC VPNs and TCP Metrics available from real user traffic for path selection decisions on new flows.
- Use any Active Path to load share traffic as long as the path is SLA compliant.
- Use only the Layer 3 Failure Path if all active paths are down, not degraded.
- Generate an Incident to be forwarded to operations in case of noncompliance with the SLA metrics.
- Select the desired policy set from .Select Add Rule and enter the Name as Protect SuperSaaSApp, Description (optional), and the Order Number (optional).More specific rules should be organized at the top of the Policy Set list, else a less specific policy rule may be matched first.In the Actions section, select Raise Alarms and Move Flows.In the Match Criteria section, under App Filters, select the application SuperSaaSApp from the drop-down, select the category in Path Filters as All Public, and select the Path Type as Direct.In the Performance SLAs section, click Add New, and check the options Link Quality Metrics and Application Metrics. Enter the SLA Name as SuperSaaSApp.In Link Quality Metrics, enter the Jitter value as 50 ms.Click the + sign to enter the Latency value as 100 ms and the Packet Loss value as 3%.Retain the Advanced Settings at their default values.In Application Metrics, enter the Init Failure Rate value as 10%. This uses the rate of TCP 3-way handshake failure on a per app (matched above), per path, per destination prefix basis. It uses real user traffic.Click the + sign to enter the RTT value as 100 ms. This uses the TCP Round-Trip Time based upon real user traffic.In the Advanced Settings change the monitoring approach from Moderate to Aggressive. The Aggressive setting will give more weight to the most recent real user traffic measurements, causing the incident generation to be more sensitive to recent issues.Review the Summary of the policy settings for the desired policy intent and Save & Exit.
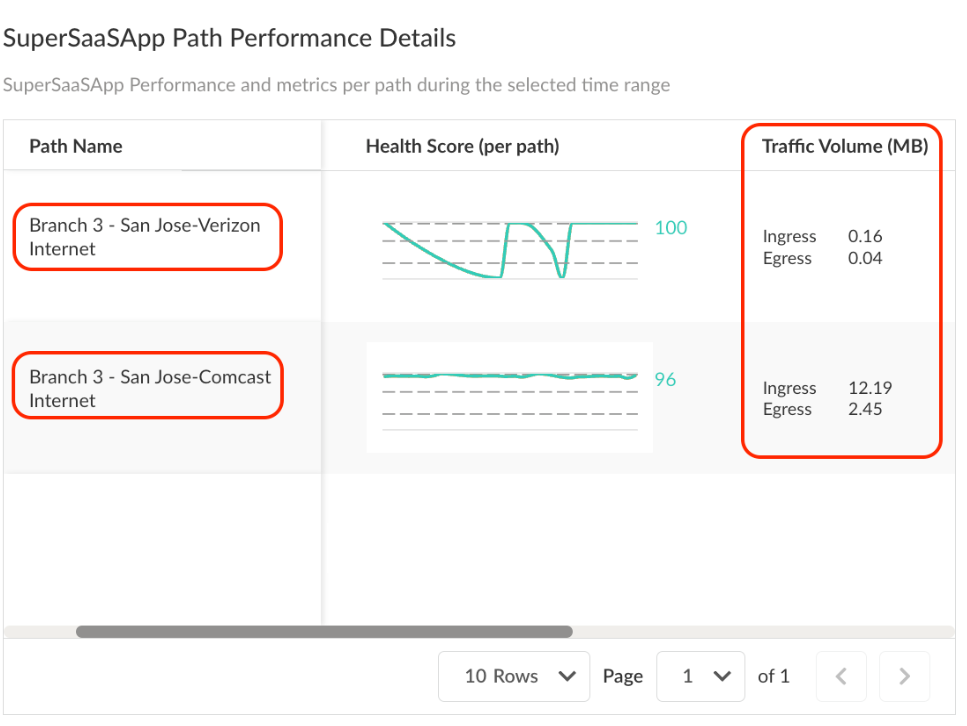
Monitor the Policy Intent - Application Site Details: Each Application has both
global and site-specific details which can be viewed by navigating to . This view presents numerous data points reflecting the true
health of the application at the site. Focusing on the SuperSaaSApp
Path Performance Details widget reveals that very little traffic
has been routed through the Verizon connection.
![]() From this point, we can inspect the performance of the circuit available from the site summary or the individual flows. As the flows for this application are located at the bottom of the page, inspecting them will help determine why the system is avoiding the Verizon circuit for SuperSaaSApp.
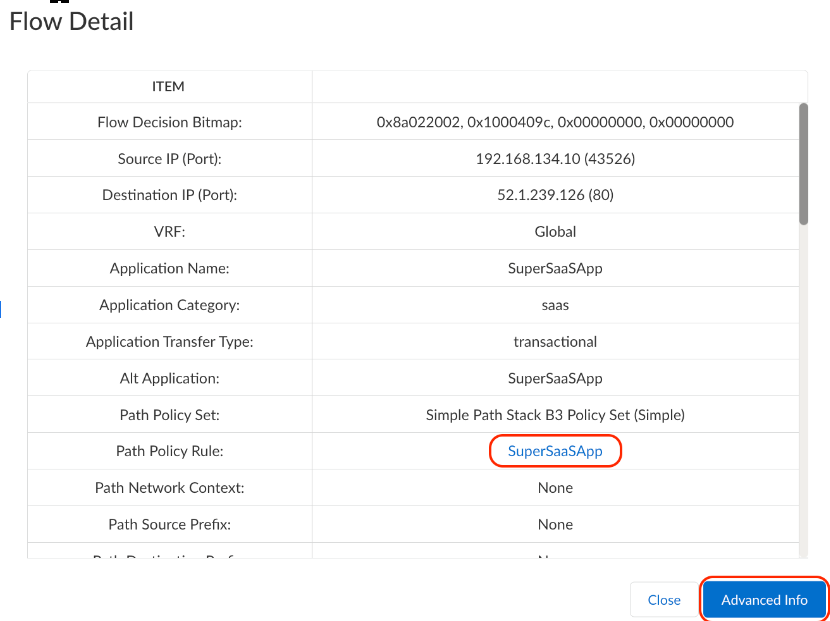
From this point, we can inspect the performance of the circuit available from the site summary or the individual flows. As the flows for this application are located at the bottom of the page, inspecting them will help determine why the system is avoiding the Verizon circuit for SuperSaaSApp. - Flow Browser: Flow Browser provides a detailed per flow
account for all aspects of the app session, including the conditions at the time
and actions taken to meet the configured SLA. Click on the Flow
Detail for the SuperSaaSApp application in the Flow
Browser to view its details.
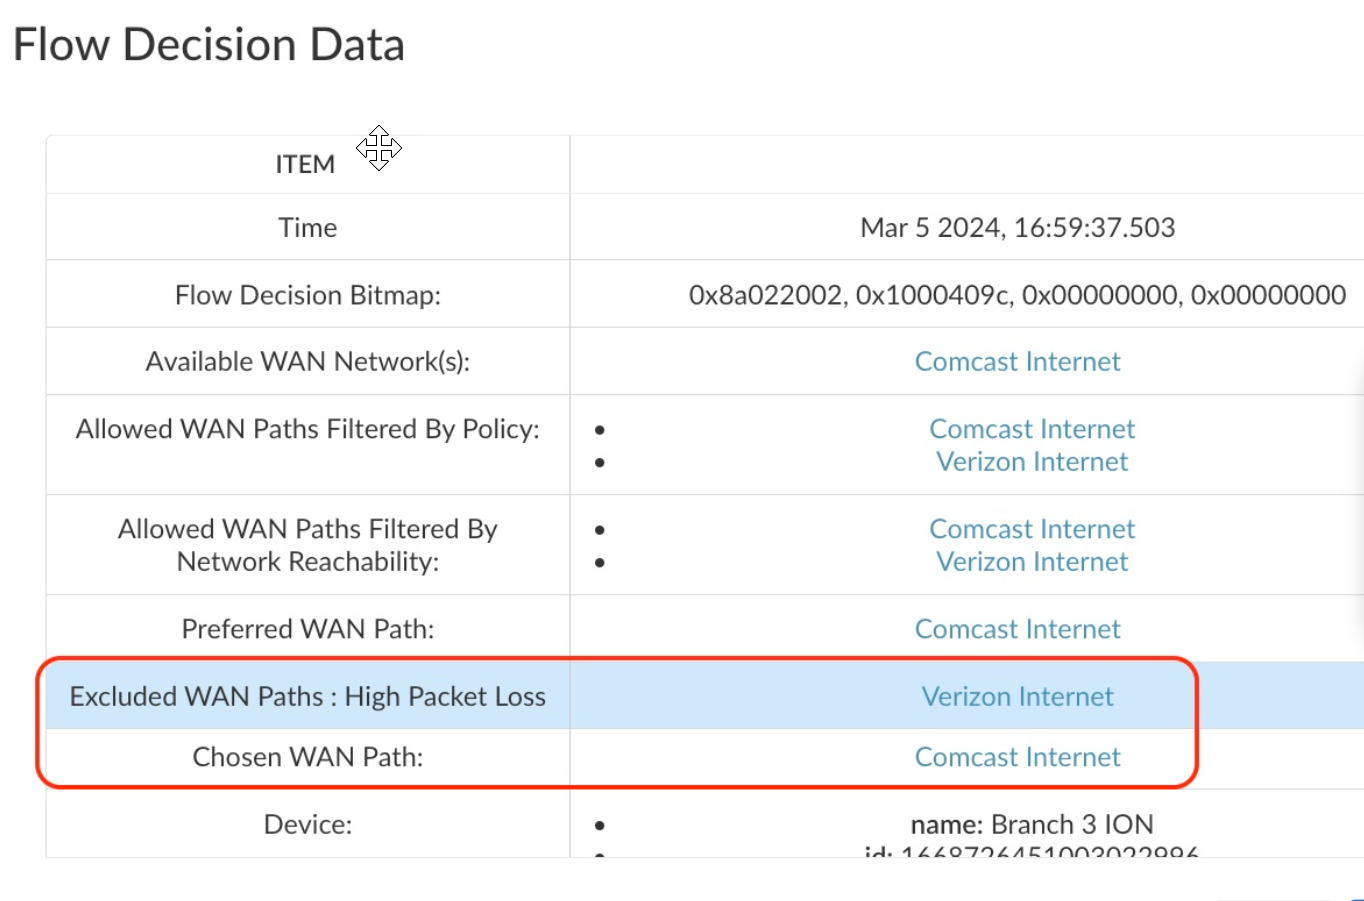
![]() The Advanced Info option provides information on the Flow Decision Data.
The Advanced Info option provides information on the Flow Decision Data.![]() In this case, the Verizon connection exceeded the 3% packet loss tolerance specified in the Performance SLA and the path was avoided.
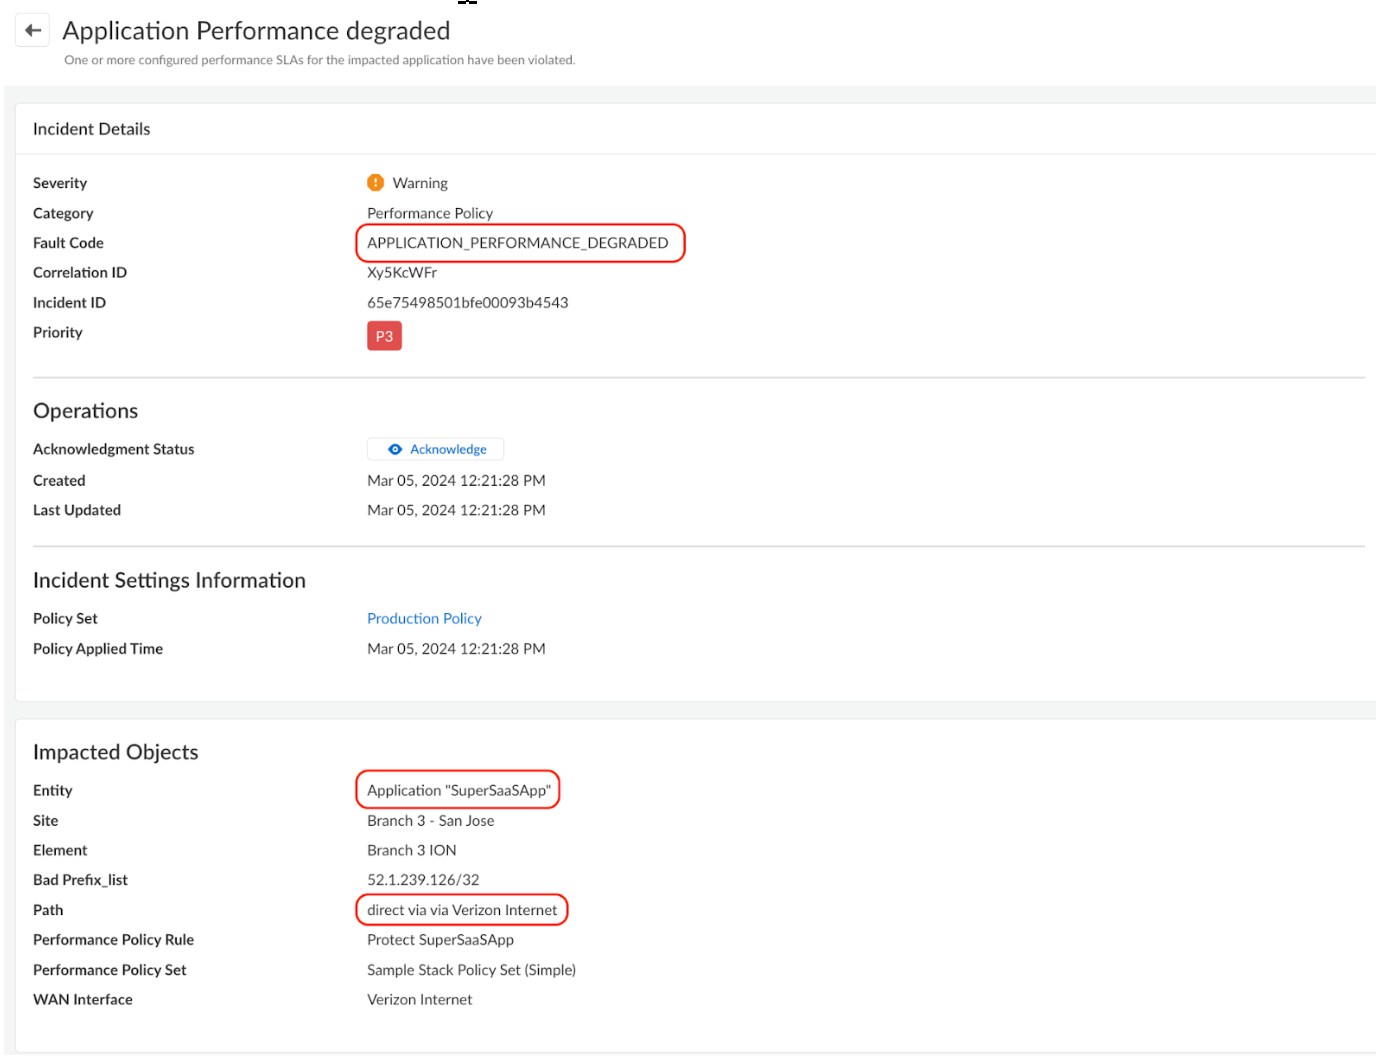
In this case, the Verizon connection exceeded the 3% packet loss tolerance specified in the Performance SLA and the path was avoided. - Incidents and Alerts: If the Application SLA metrics are
violated, the system generates an incident, which can be found under , labeled with the incident code
APPLICATION_PERFORMANCE_DEGRADED.
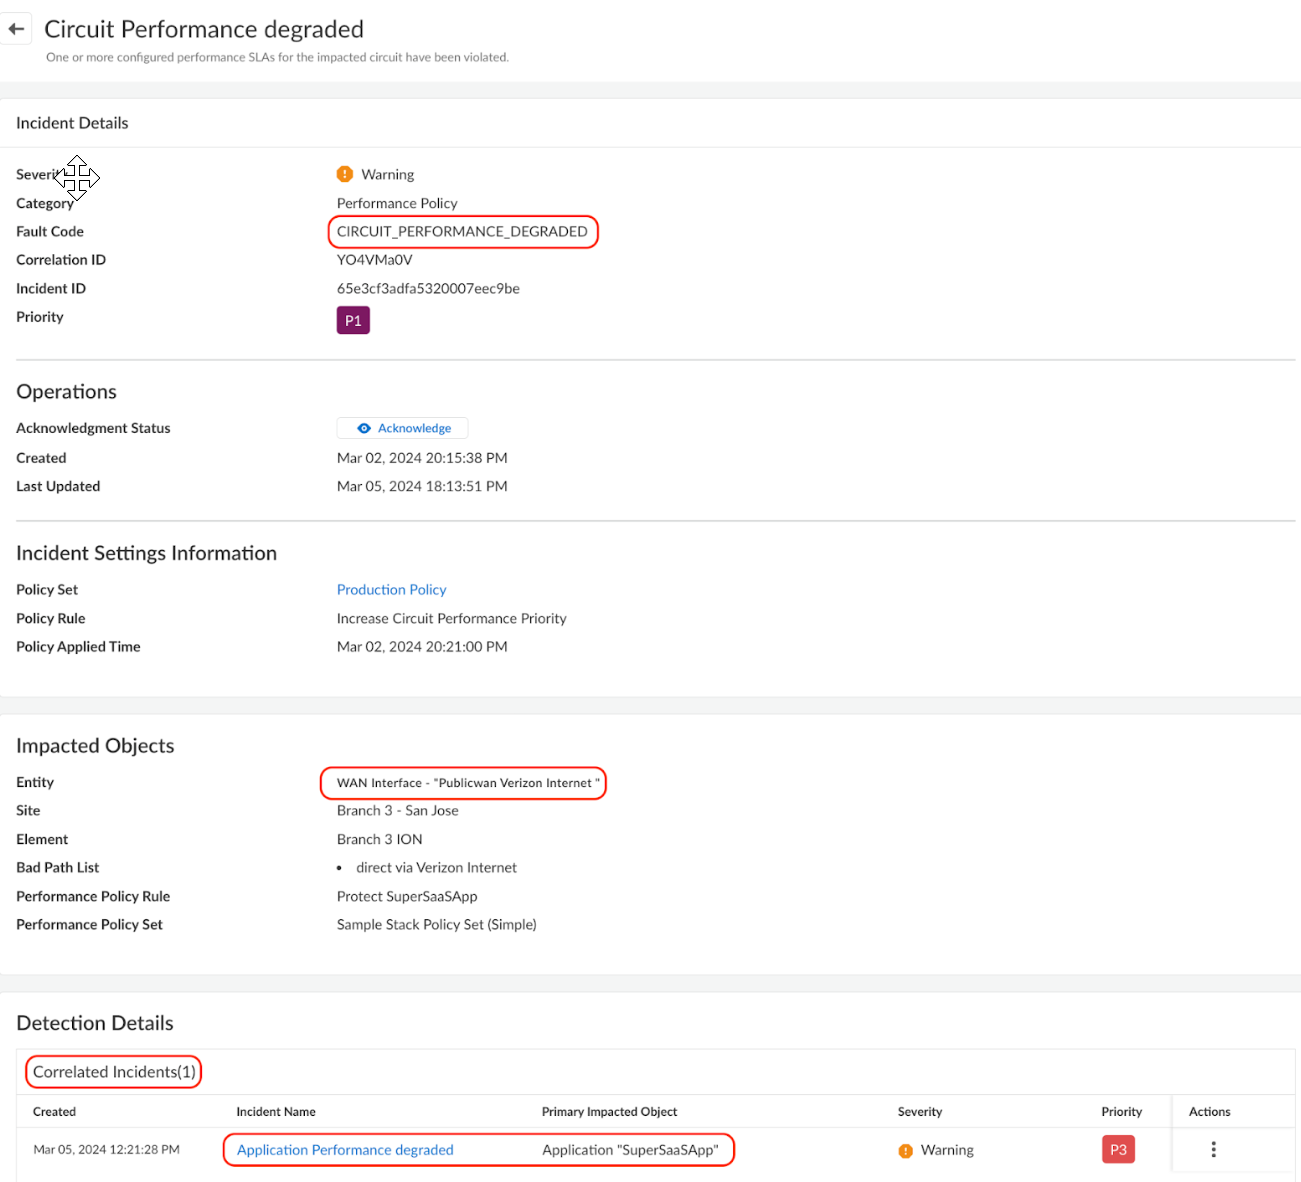
![]() In this case, not only were the Application SLA Metrics (Init fail % or RTT) violated, the link quality SLA metrics were also breached. This generated another incident under the incident code CIRCUIT_PERFORMANCE_DEGRADED. As circuit health issues generally lead to application SLAs not being met, the system automatically detects the correlation between the two and APPLICATION_PERFORMANCE_DEGRADED becomes a child incident of CIRCUIT_PERFORMANCE_DEGRADED.
In this case, not only were the Application SLA Metrics (Init fail % or RTT) violated, the link quality SLA metrics were also breached. This generated another incident under the incident code CIRCUIT_PERFORMANCE_DEGRADED. As circuit health issues generally lead to application SLAs not being met, the system automatically detects the correlation between the two and APPLICATION_PERFORMANCE_DEGRADED becomes a child incident of CIRCUIT_PERFORMANCE_DEGRADED.![]() The default system behavior will correlate the Application Performance Degraded incident and suppresses it to reduce excessive App SLA notifications. This default behavior enables faster root cause determination by minimizing the symptoms (paths not being compliant with App SLAs). Using Incident Settings, the default suppress behavior can be changed to not suppress the child incident.
The default system behavior will correlate the Application Performance Degraded incident and suppresses it to reduce excessive App SLA notifications. This default behavior enables faster root cause determination by minimizing the symptoms (paths not being compliant with App SLAs). Using Incident Settings, the default suppress behavior can be changed to not suppress the child incident. - Summary: Implementing the Performance Policy rule for SuperSaaSApp ensures an optimal end-user experience by consistently utilizing the best-performing direct internet path available. The effects of the rule are easily monitored using the App Site Details, Link Quality Metrics, and flow browser. Operationally, the generated Incidents notify operations staff that the Verizon internet connection periodically proves unsuitable for SuperSaaSApp.