Prisma SD-WAN
Cellular Charts
Table of Contents
Expand All
|
Collapse All
Prisma SD-WAN Docs
-
-
- New Features Guide
-
- CloudBlade Integrations
- CloudBlades Integration with Prisma Access
-
-
-
-
- 6.5
- 6.4
- 6.3
- 6.2
- 6.1
- 5.6
- New Features Guide
- On-Premises Controller
- Prisma SD-WAN CloudBlades
- Prisma Access CloudBlade Cloud Managed
- Prisma Access CloudBlade Panorama Managed
Cellular Charts
The Cellular charts presents cellular telemetry data.
| Where Can I Use This? | What Do I Need? |
|---|---|
|
|
The cellular activity charts present
cellular module telemetry data such as the bandwidth utilization
of cellular modules on a site and a device. Select a site, one or
more devices, and one or more cellular modules to view the cellular charts.
You can also filter by Carriers, APN profiles
and Circuits. WAN and Paths are not applicable to the Cellular charts.
You can view the data by the available time frames options—1H, 1D,
1W, 1M, and 3M. The data refreshes every 5 minutes, click the Refresh icon
to view the latest data at any given time. Export the data by clicking
the Export icon.
- Signal Strength Quality
- Signal Stats
- Traffic Volume
- Technologies
- Bandwidth Usage
- Packet Drops
- Packet Errors
- Packet Overflows
- GPS Locations
- Cellular Tower Switches
Signal Strength Quality
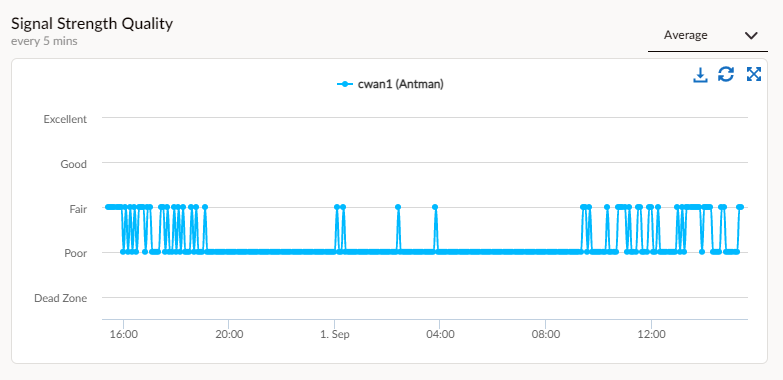
The Signal Strength Quality presents
time series data for the quality of the signal strength in terms
of Excellent, Good, Fair, Poor, and Dead Zone. Sort the data by
Average, Best (max), or Worst (min).
Signal Stats
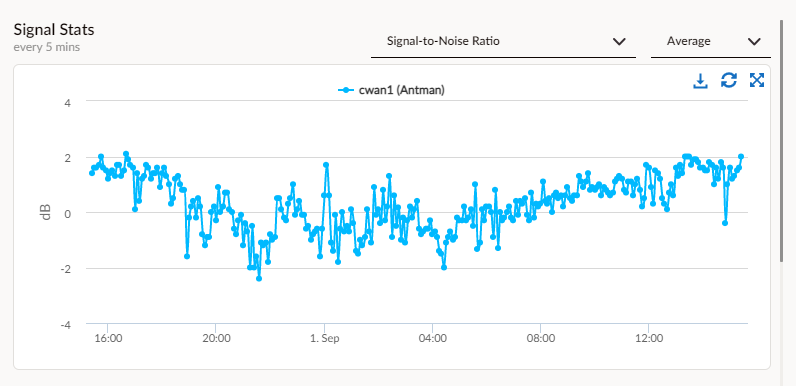
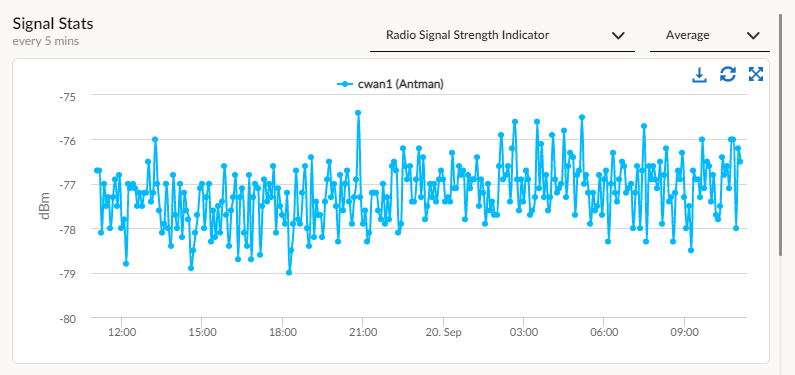
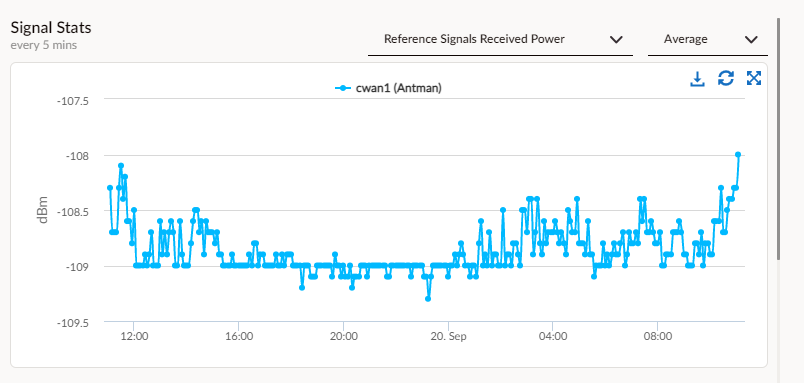
The Signal Stats chart displays various signal related
statistics, the drop-down shows signal stats to choose from. Sort
the data by Average, Best (max), or Worst (min).
- Signal-to-Noise
Ratio (SNR)—Signal-to-Noise Ratio levels reported by the module
(units: dB)
![]()
- Radio Signal Strength Indicator (RSSI)—Radio Signal Strength
Indicator levels reported by the module (units: dBm)
![]()
- Reference Signals Received Power (RSRP)—Reference Signals Received Power
levels reported by the module (units: dBm)
![]()
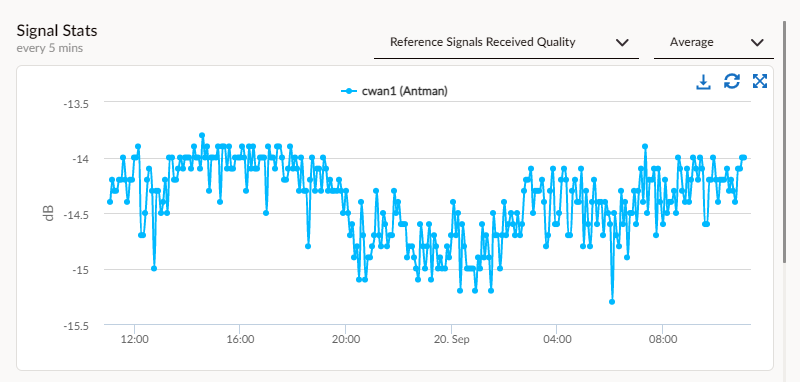
- Reference Signals Received Quality (RSRQ)—Reference Signals
Received Quality levels reported by the module (units: dB)
![]()
- Reference Signals Code Power (RSCP)—Reference Signals Code Power levels
reported by the module (units: dBm)The RSCP values shows the 3G signal data.
The Cellular Health charts distinguish between 5G-NSA (Non-Standalone) and 5G-SA
(Standalone) modes.
- UI Display: While the dashboard displays 5G as the general technology, hovering over the chart time series displays a tooltip specifying 5G-NSA or 5G-SA.
- Signal Source:
- 5G-NSA: Signal Strength Indicators (SSI) are derived from the LTE (4G) anchor node tables (reporting LTE RSSI, RSRP, RSRQ, and SNR) because the connection relies on an LTE anchor.
- 5G-SA: Signal metrics are derived directly from 5G tables (reporting 5G RSRP, RSRQ, and SINR).
Traffic Volume
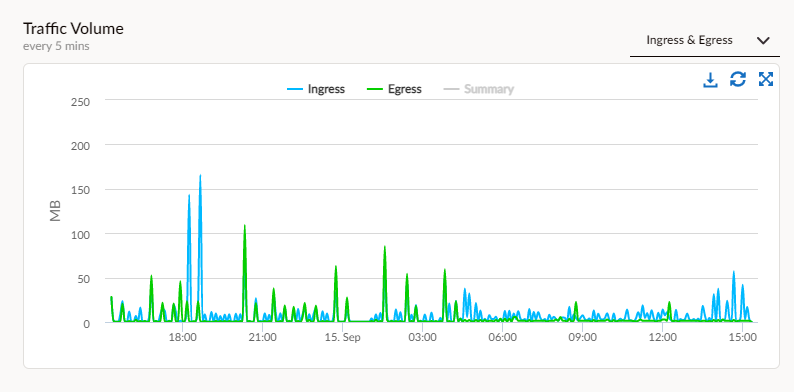
The Traffic Volume chart presents the traffic volume
in KB on the selected cellular module. The volume of downloaded
and uploaded data is exported to the controller every minute. View
the data by Ingress, Egress, Ingress and Egress, or Summary.
Technologies
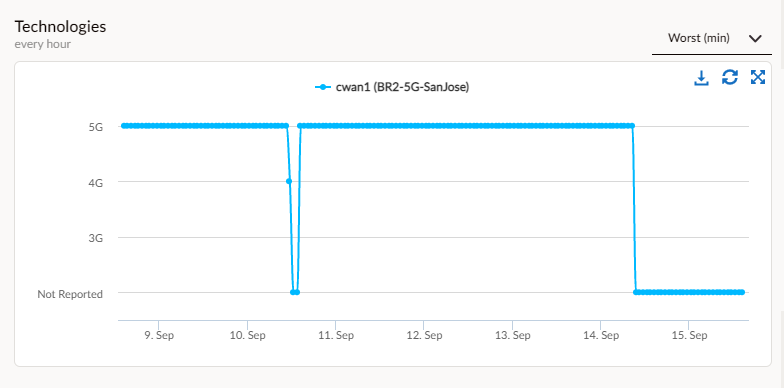
The
Technologies chart presents the time series data for the cellular
technology (3G/LTE/5G) used at any given time and correlates with
signal strength time series data. View the data by Worst or Best.
Bandwidth Usage
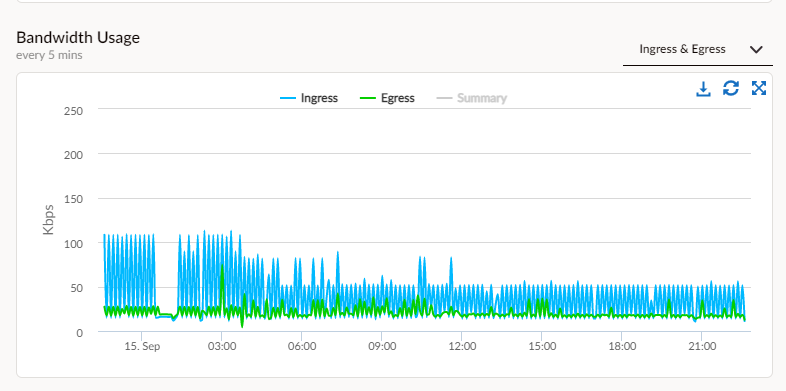
The Bandwidth Usage chart presents the time series
data on bandwidth utilized in Kbps on a Cellular module. The cellular
interface throughput is exported to the controller every minute.
Use this chart to identify congestion in a network. View the data
by Ingress, Egress, Ingress and Egress, or Summary.
Packet Drops
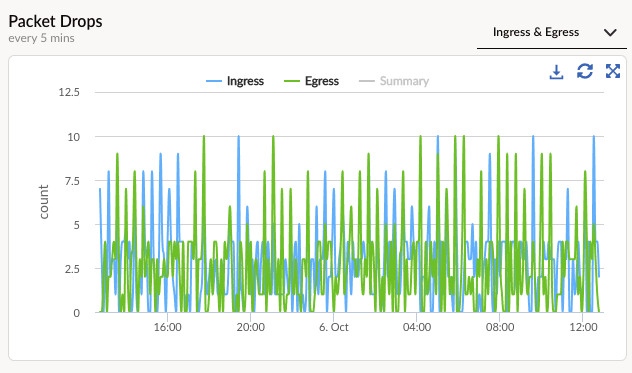
The Packet Drops shows the number of packet dropped
on the cellular module. Correlate packet dropped with bandwidth
usage to understand the issue. View the data by Ingress, Egress,
Ingress and Egress, or Summary.
Packet Errors
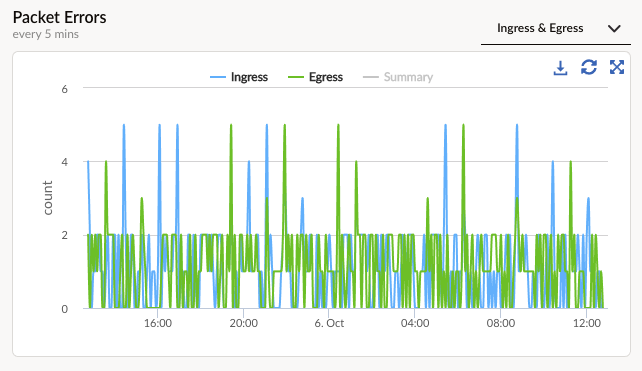
The Packet Errors chart shows the packet-related
errors on the cellular module. Correlate packet errors with traffic
volume and bandwidth usage. View the data by Ingress, Egress, Ingress
and Egress, or Summary.
Packet Overflows
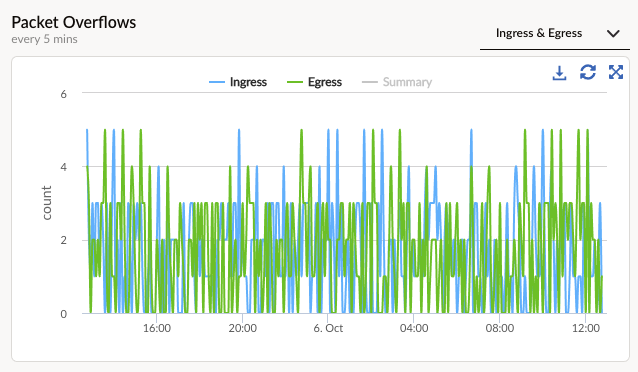
The Packet Overflows chart shows the packet
overflows on the cellular module. The chart helps to analyze bandwidth
issues. View the data by Ingress, Egress, Ingress and Egress, or
Summary.
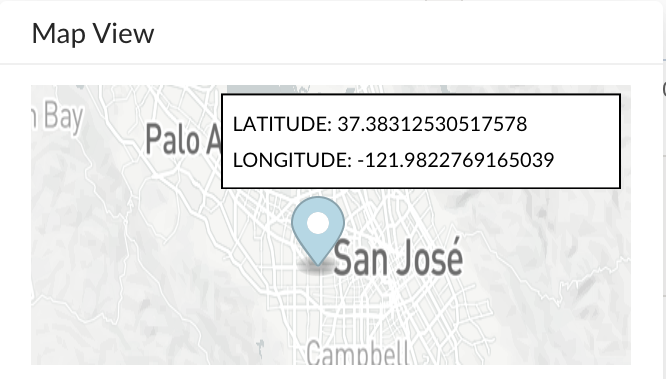
GPS Location(s)
The GPS location chart shows the GPS location
history of the selected cellular module. If there is only GPS location
indicating the device is static, the chart displays the map of the
GPS location. If there are multiple GPS locations indicating the
device is moving, the chart shows the time and GPS location history
with an option to view the location on the map.
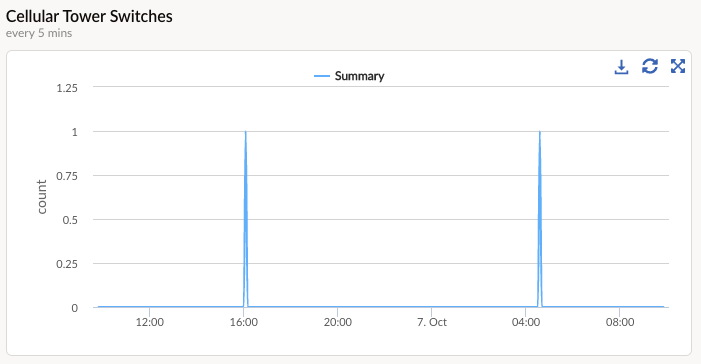
Cellular Tower Switches
The Cellular Tower Switch presents the
time series data for the number of cellular switches by the selected
cellular module. If the ION device is mobile or if the device is
closer to more than one cellular tower, tower switches are likely
to happen and indicated in the chart. Use this chart to correlate
with the signal strength time series data.
