Strata Cloud Manager
Insights: Status and Monitoring
Table of Contents
Insights: Status and Monitoring
View a visual representation of your PAN-OS devices.
| Where Can I Use This? | What Do I Need? |
|---|---|
|
|
Monitor the health and performance of your NGFW devices in a unified view
through . This feature facilitates a seamless transition from Panorama-based
monitoring to Strata Cloud Manager, offering a consolidated perspective of both your
NGFW and Prisma Access environments.
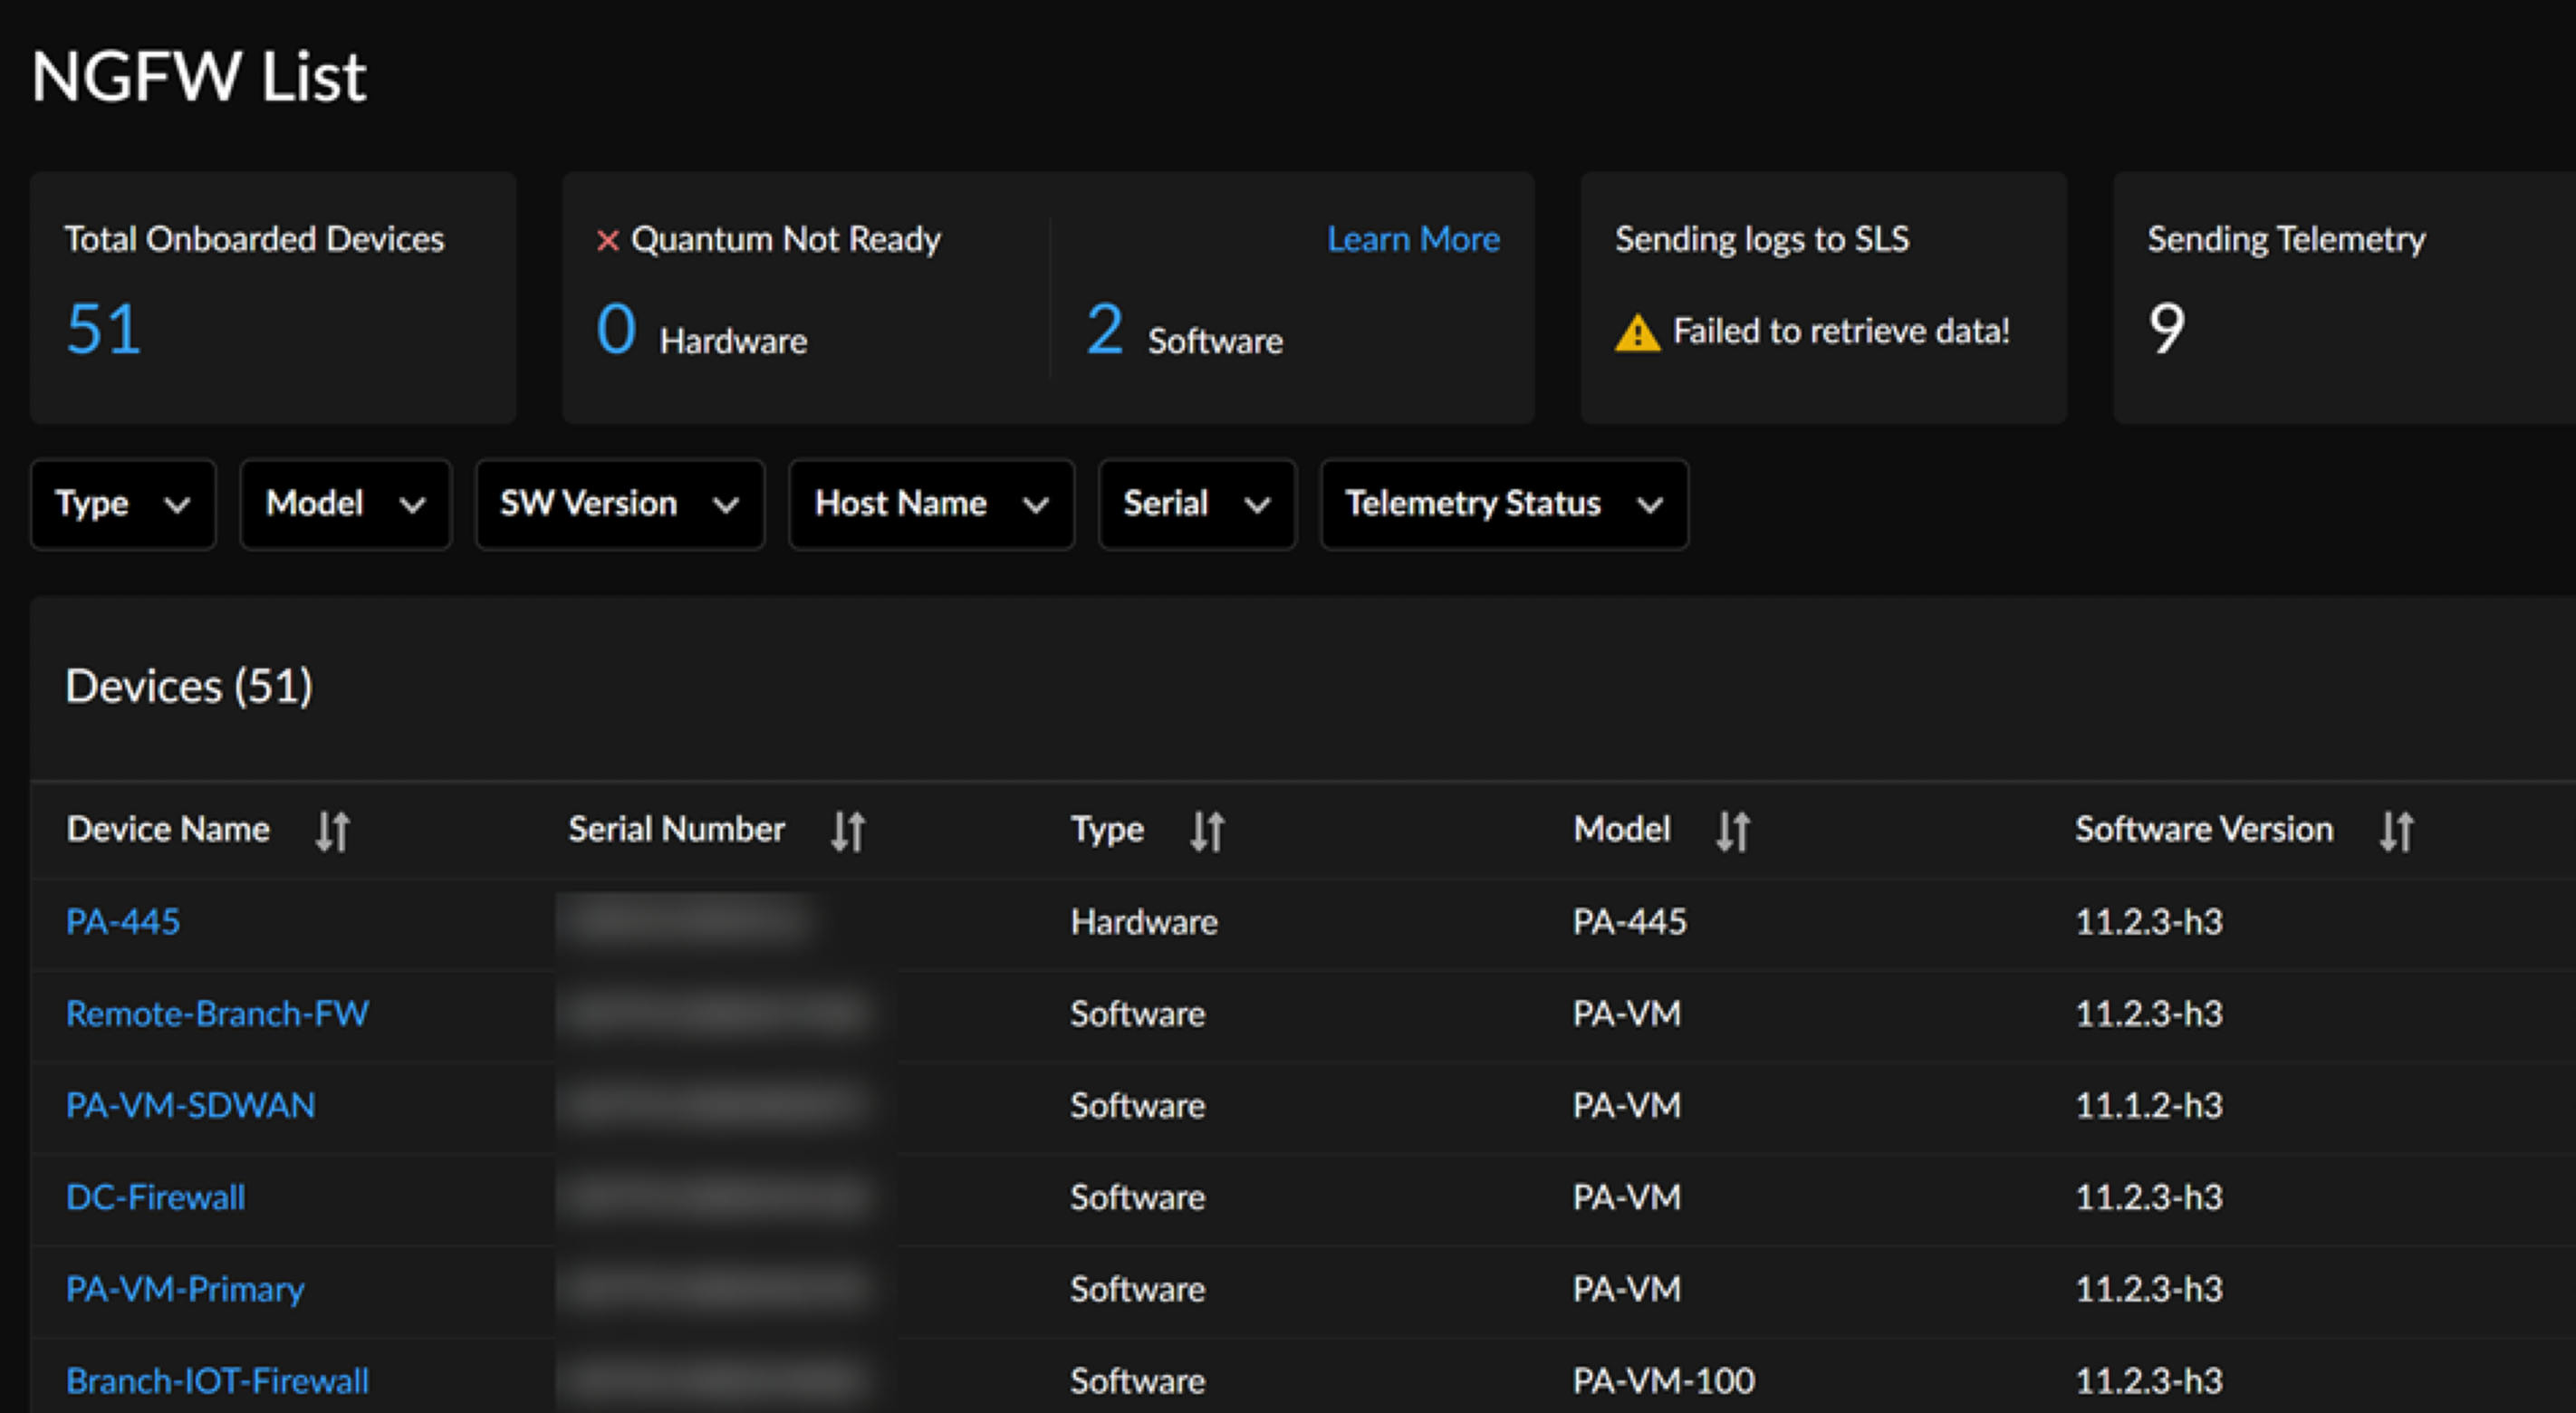
Gain insights into your deployed devices, including:
- Total onboarded devices
- Quantum readiness status
- Devices sending logs to SLS
- Devices sending telemetry
- Devices with delayed telemetry
- Devices with critical incidents
- Number of models
- Number of software versions
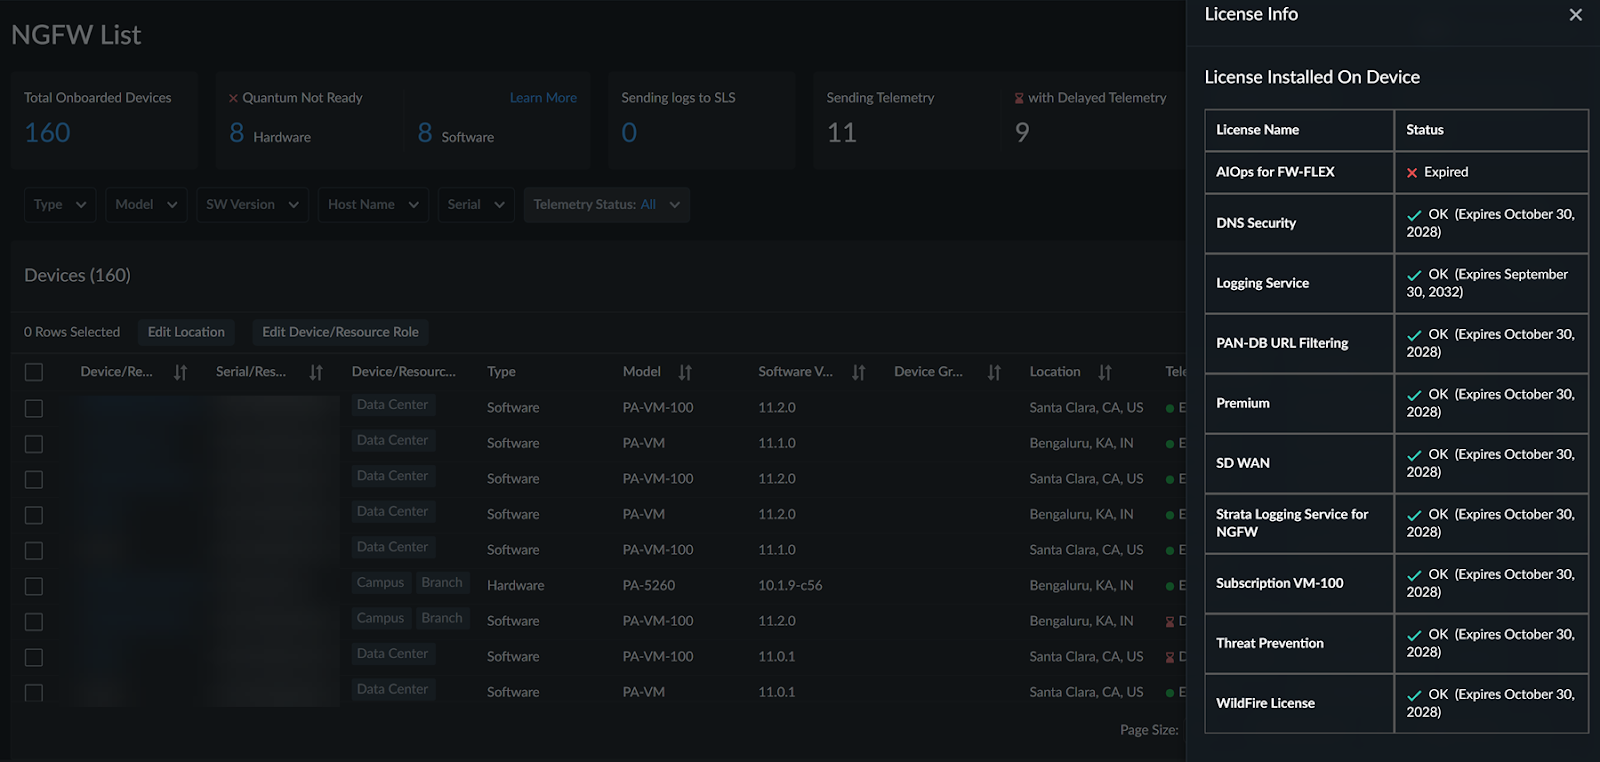
The Sending Telemetry widget displays the count of devices actively
transmitting telemetry data to the backend. Conversely, the with Delayed
Telemetry widget indicates the number of devices experiencing issues with
telemetry transmission. The Devices table provides a comprehensive view of
all devices, showing their telemetry status: enabled, delayed, or disabled. You can
further refine this view by filtering devices based on their Telemetry
Status.
You can filter the devices based on their type, model, software version,
host name, serial number and telemetry status. You can also Export the list
of devices.
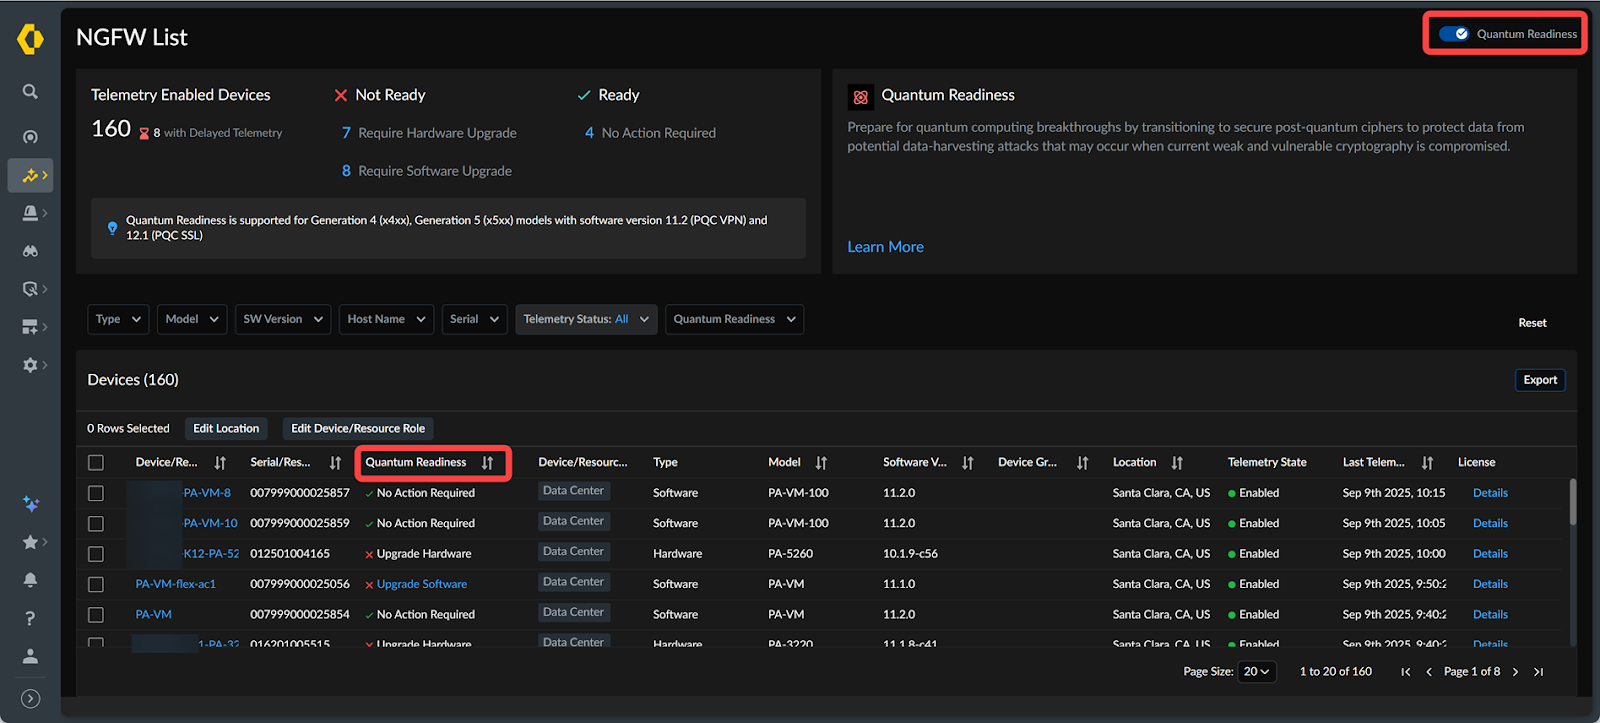
Toggle Quantum Readiness to view the devices that are quantum ready and not ready.
Filtering and Exporting Device Lists
Filter your device list by type, model, software version, hostname, serial number,
and telemetry status. To clear all filters and view the complete list, click
Reset. You can also Export the device list for further
analysis.
License Details
To view installed licenses and their expiry dates for each device, select
Details in the License column.
Quantum Readiness
Quantum Readiness assesses your organization's crypto posture, offering visibility,
identifying quantum-ready NGFW devices, and recommending remediation. Toggle
Quantum Readiness to see which devices are quantum ready and which are
not.
Edit Location of Devices
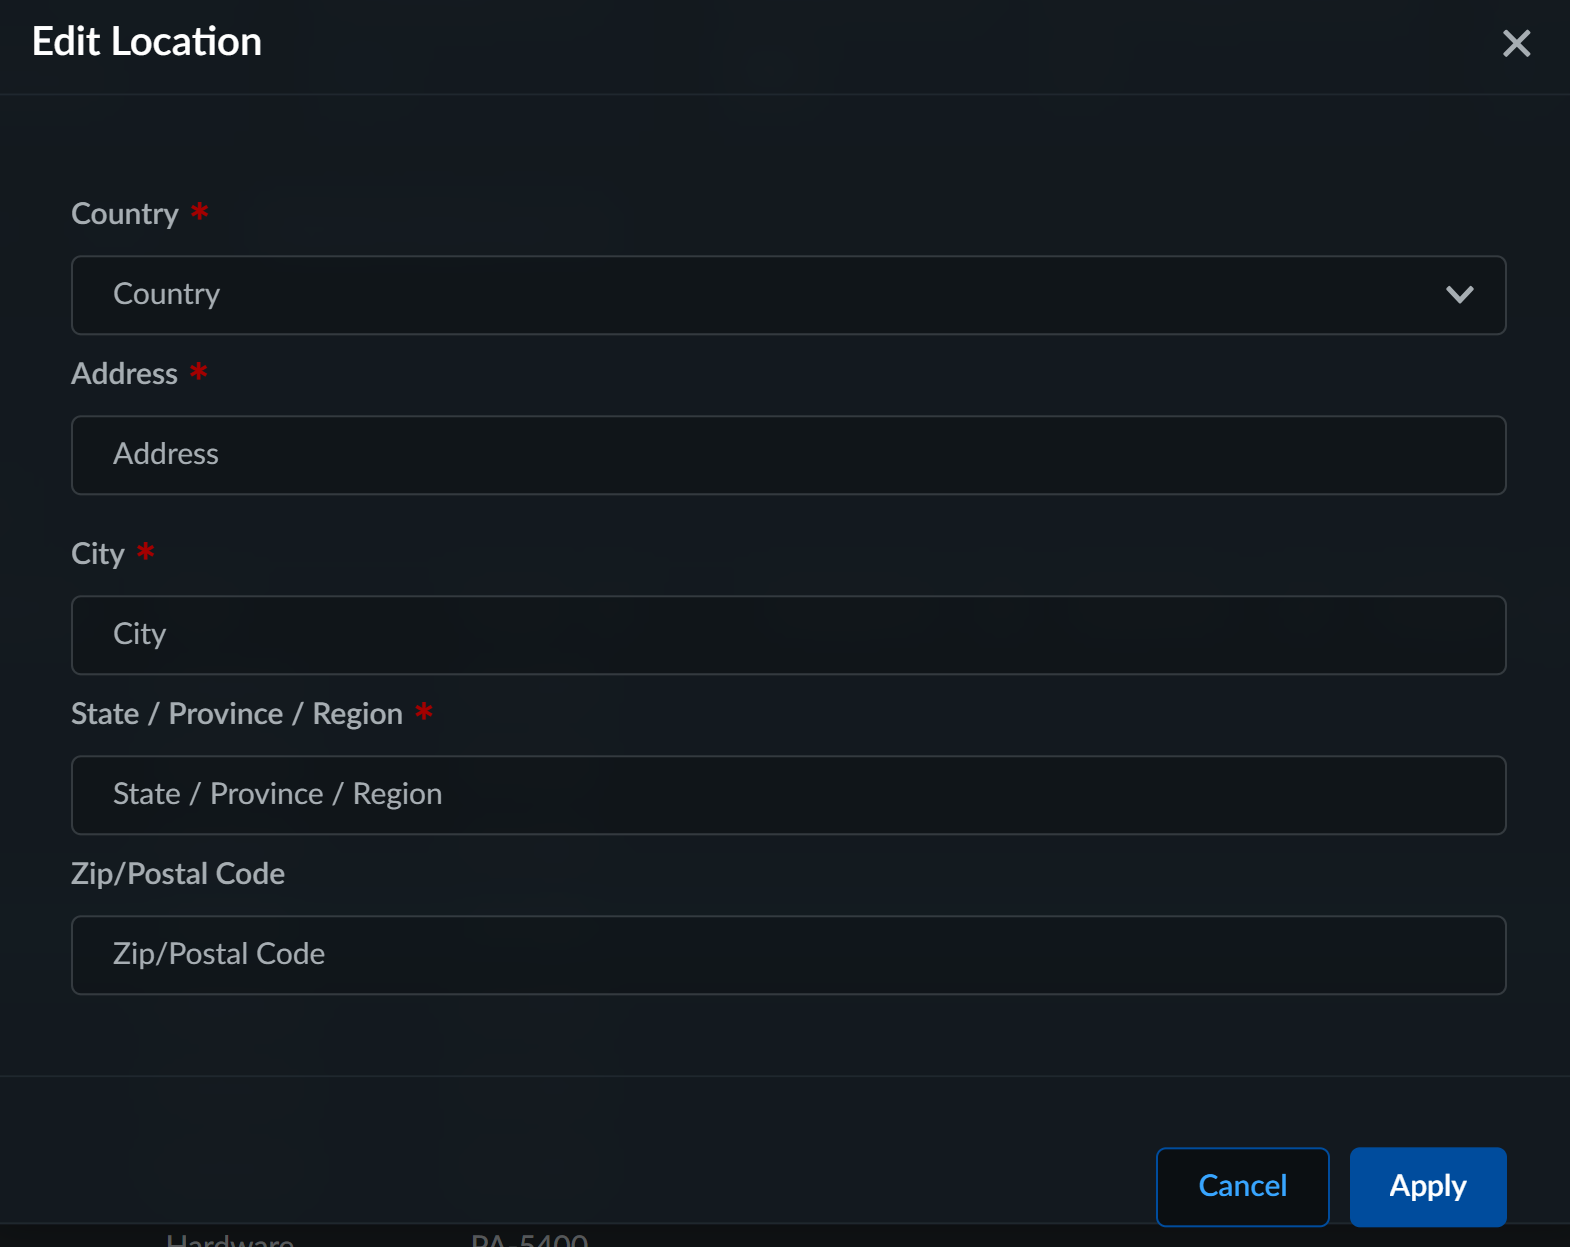
- Select the devices for which you want to modify or update the location.Edit Location.Enter the address information relevant to all chosen devices.
![]() Apply the location to all the selected devices.This location data appears on the NetSec Health dashboard's map.
Apply the location to all the selected devices.This location data appears on the NetSec Health dashboard's map.Edit Device Role
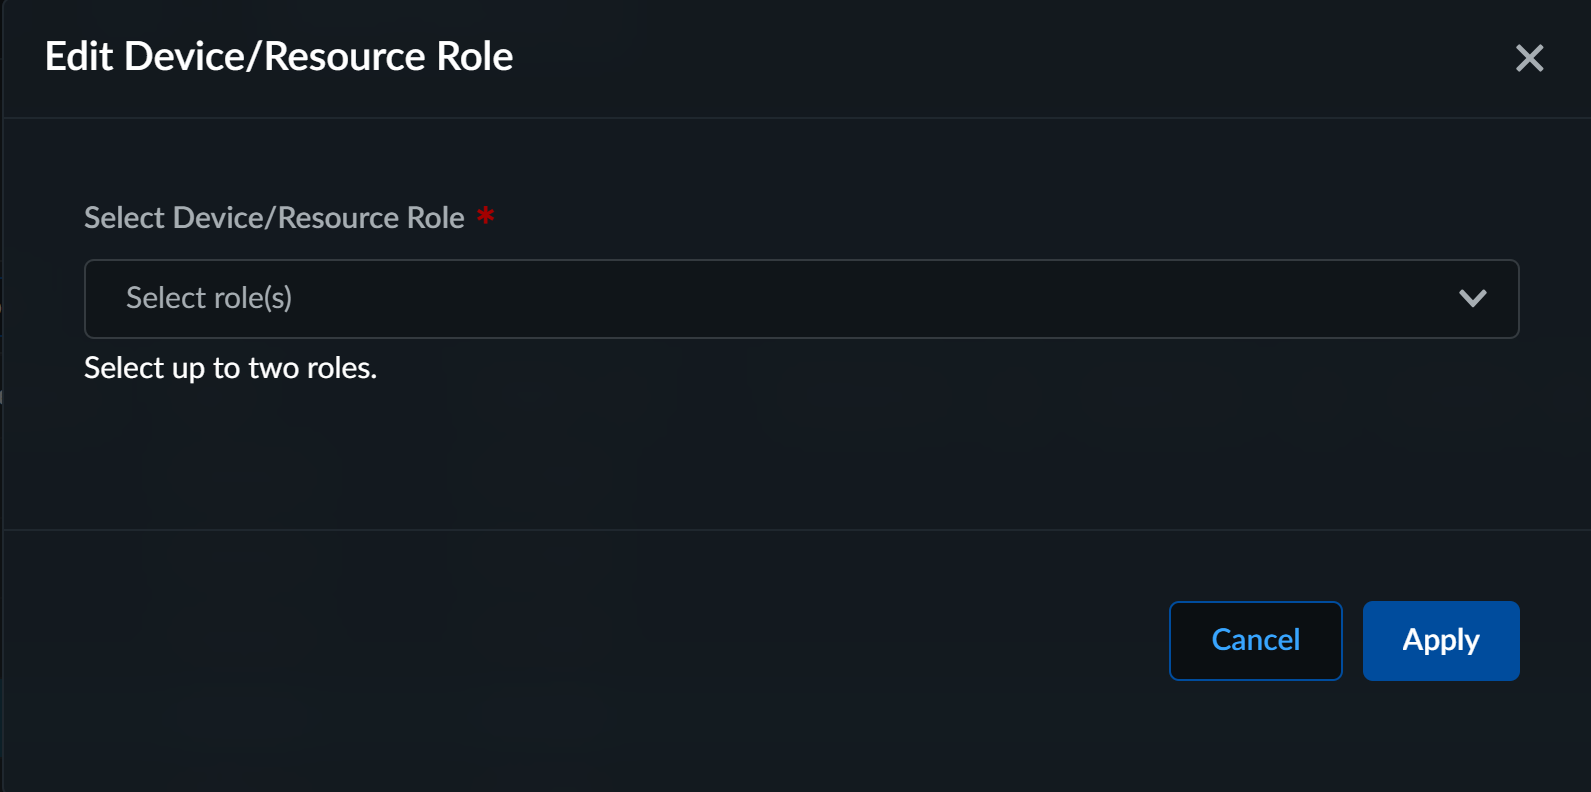
NGFW List includes the DeviceRole column, which specifies each device's function. This helps users who deploy firewalls in specific network roles, such as Application Firewall, Branch Firewall, Campus Firewall, Data Center Firewall, Edge Firewall, or IoT Firewall. This feature supports use cases like applying consistent policies and analyzing incidents based on the assigned role.- Select the devices for which you want to modify or update the devices role.Edit Device Role.Select up to two roles for the devices and Apply.
![]() You can only select a maximum of two roles. Selecting more than two roles will result in an error and prevent you from proceeding.
You can only select a maximum of two roles. Selecting more than two roles will result in an error and prevent you from proceeding.View Device Details
By selecting a device from NGFW List or by following a link from elsewhere in the application, you can view specific details about a firewall or Panorama appliance, such as resource metrics, traffic metrics, connections, and more.![]()
Device Information Select a device to view details like model, serial number, software version, management IP address, role, and geo-location.You can view the following information for the device:- Inbound and outbound packet rate
- Total raised incidents on this device
- Five of the top current incidents by severity on the device
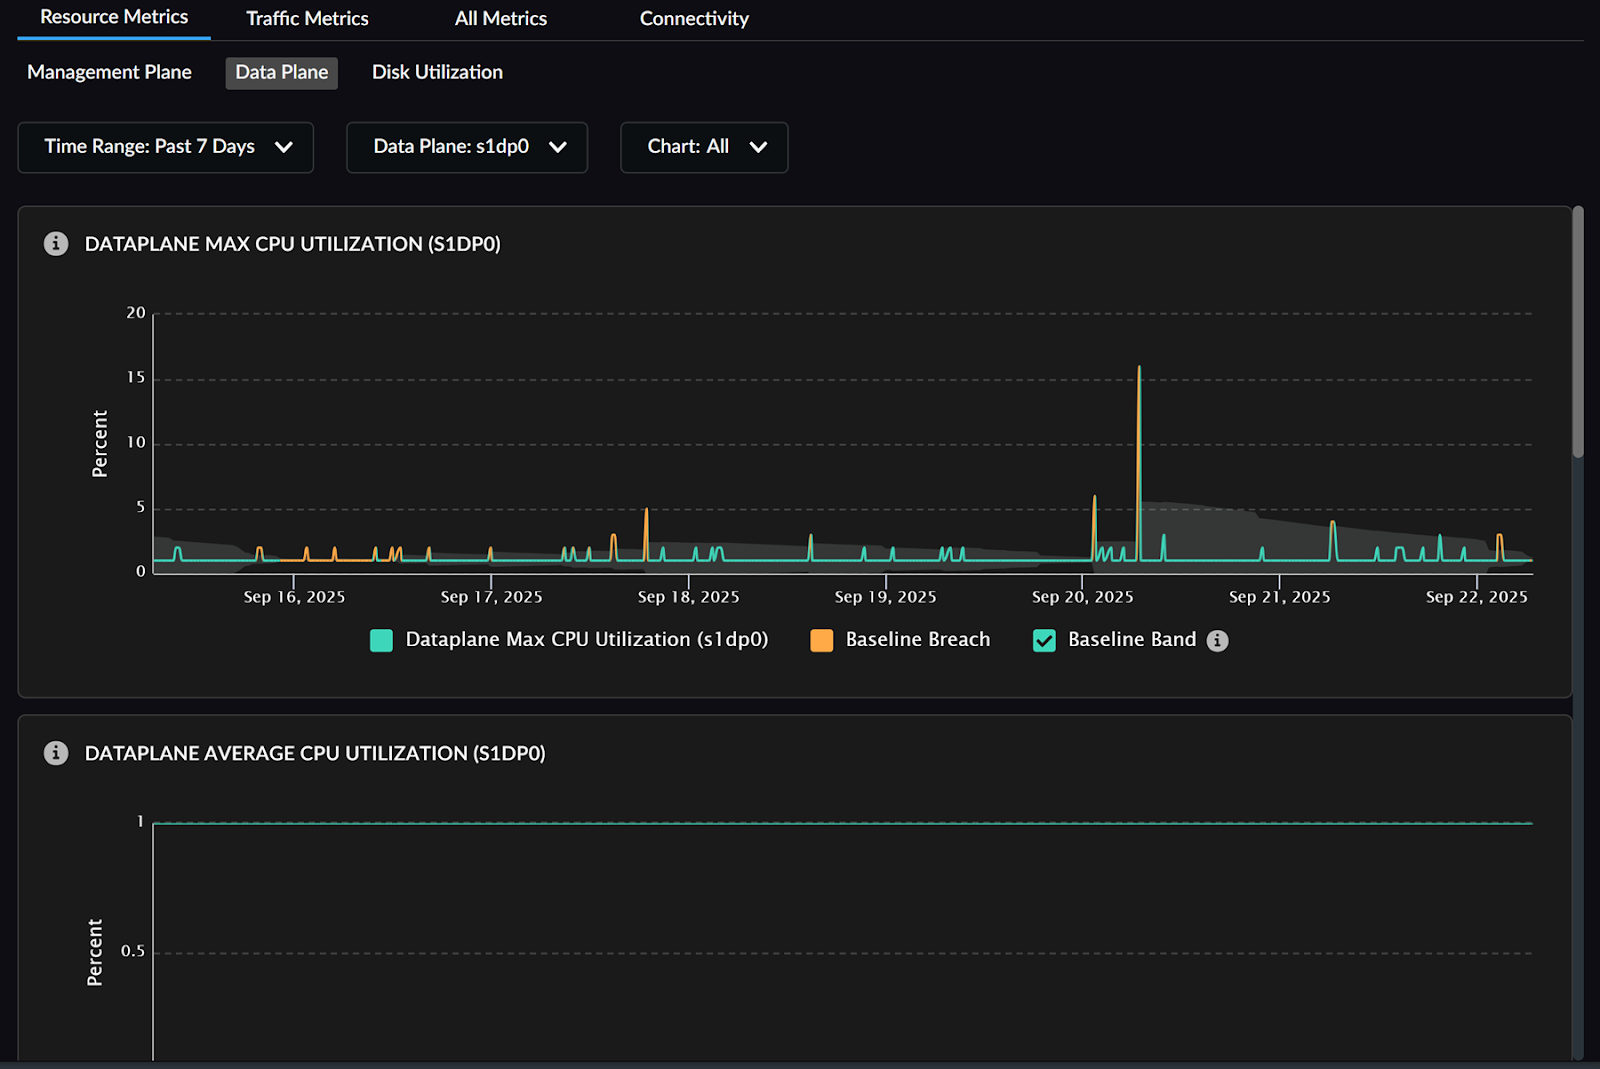
The current health grade of the device and a chart showing its history over the past 30<x> days. Possible health grades are Good, Fair, Poor, and Critical.Resource Metrics Resource metrics displays time series charts indicating the trend of the resource metric associated with the CPU or memory resources of the device. The gray area on the graph represents the metric's baseline performance range, plotted based on the historical behavior of the metric. You can view the below graphs:- Management Plane - CPU usage and memory usage utilization
- Data Plane
- Max and average CPU utilization
- Packet buffers and Packet descriptors utilization
- Disk Utilization indicating the memory allocated, used, available with the utilization as a percentage for the time filter duration.
![]() With Strata Cloud Manager Essentials or free tier licenses, you can view the resource and traffic metric graphs with static threshold values: 60% for the warning threshold and 80% for the critical threshold. In contrast, with a Strata Cloud Manager Pro or premium tier license, these graphs include a normality band (or baseline). Any data points that fall outside of this band are highlighted with red scatter plot dots.
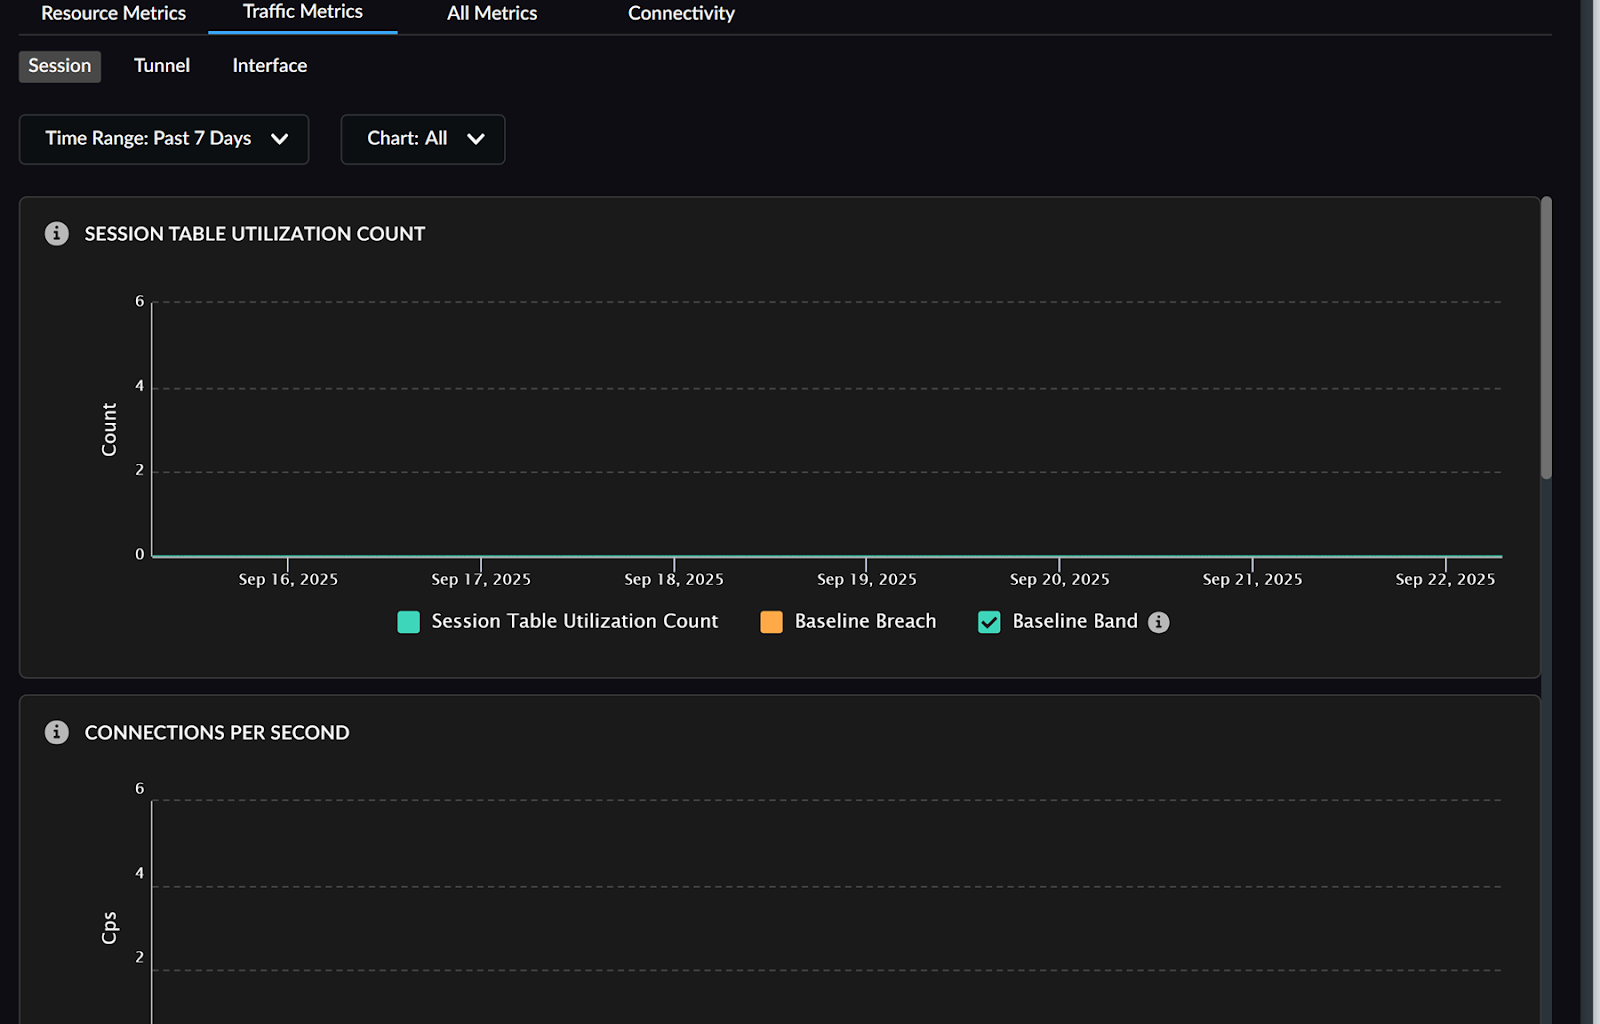
With Strata Cloud Manager Essentials or free tier licenses, you can view the resource and traffic metric graphs with static threshold values: 60% for the warning threshold and 80% for the critical threshold. In contrast, with a Strata Cloud Manager Pro or premium tier license, these graphs include a normality band (or baseline). Any data points that fall outside of this band are highlighted with red scatter plot dots.Traffic Metrics Traffic metrics provide time-series charts for NGFW devices, offering insights into network traffic on:- Session - Session table utilization, connections per second, packet rate, session table utilization, and decrypted sessions.
- Tunnel - List of all tunnels configured for the device indicating tunnel name, tunnel status, source IP address, and destination IP address.
- Interface - Select an interface to view information about its interface packet drops, packets received and transmitted, receive errors, bytes received and transmitted.
![]()
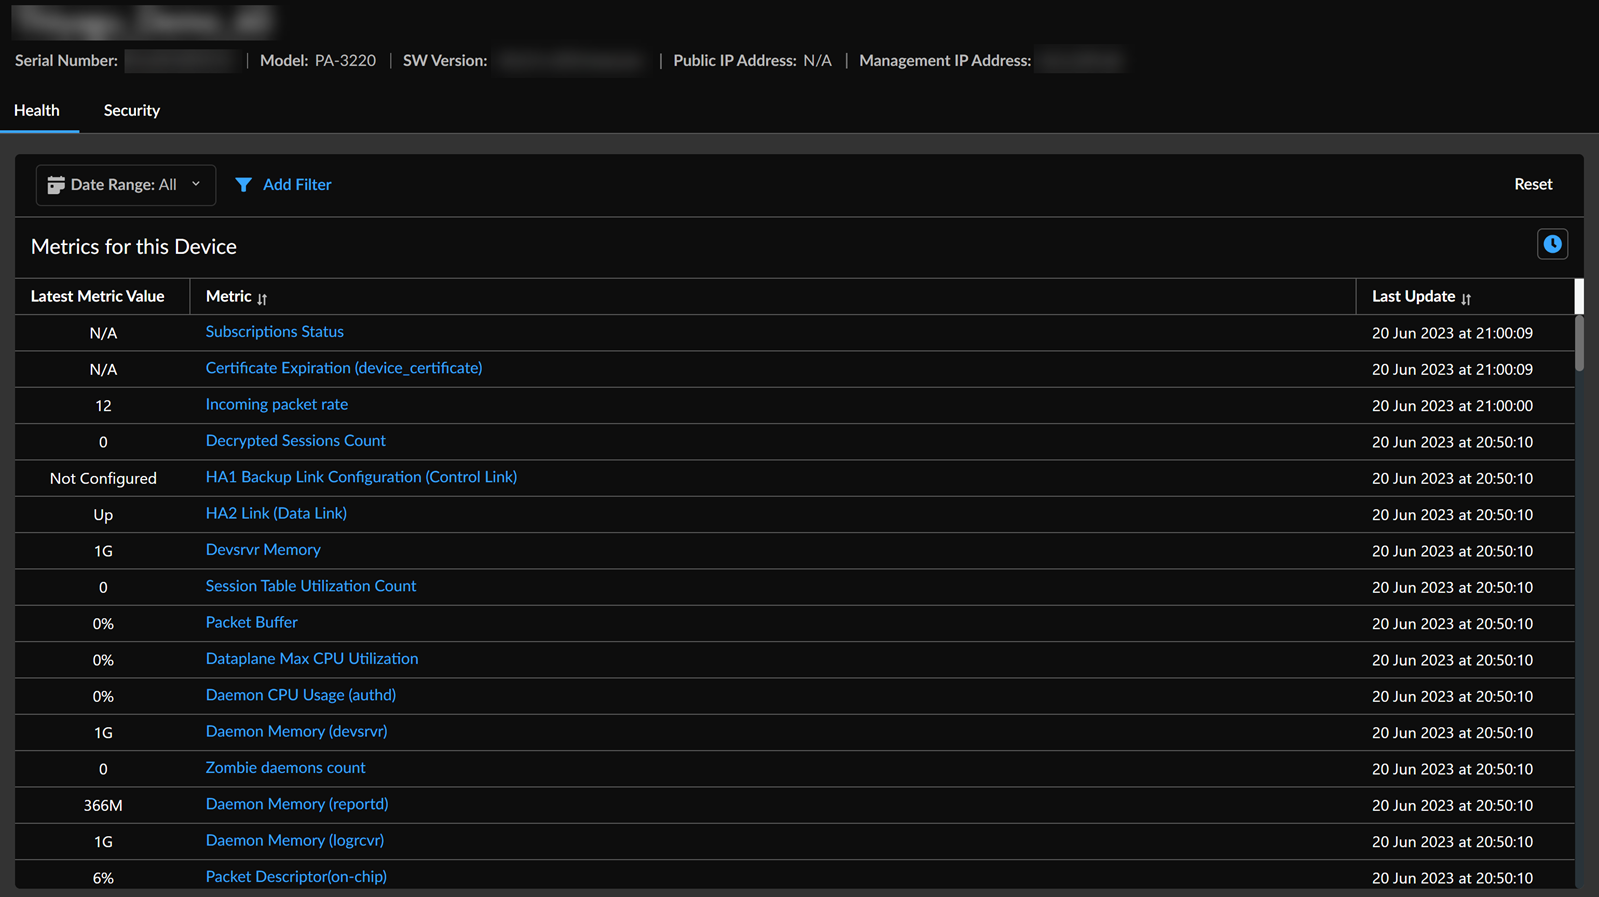
All Metrics View all the metrics collected for the device and its values associated with the device. You can click a metric to view its details.![]()
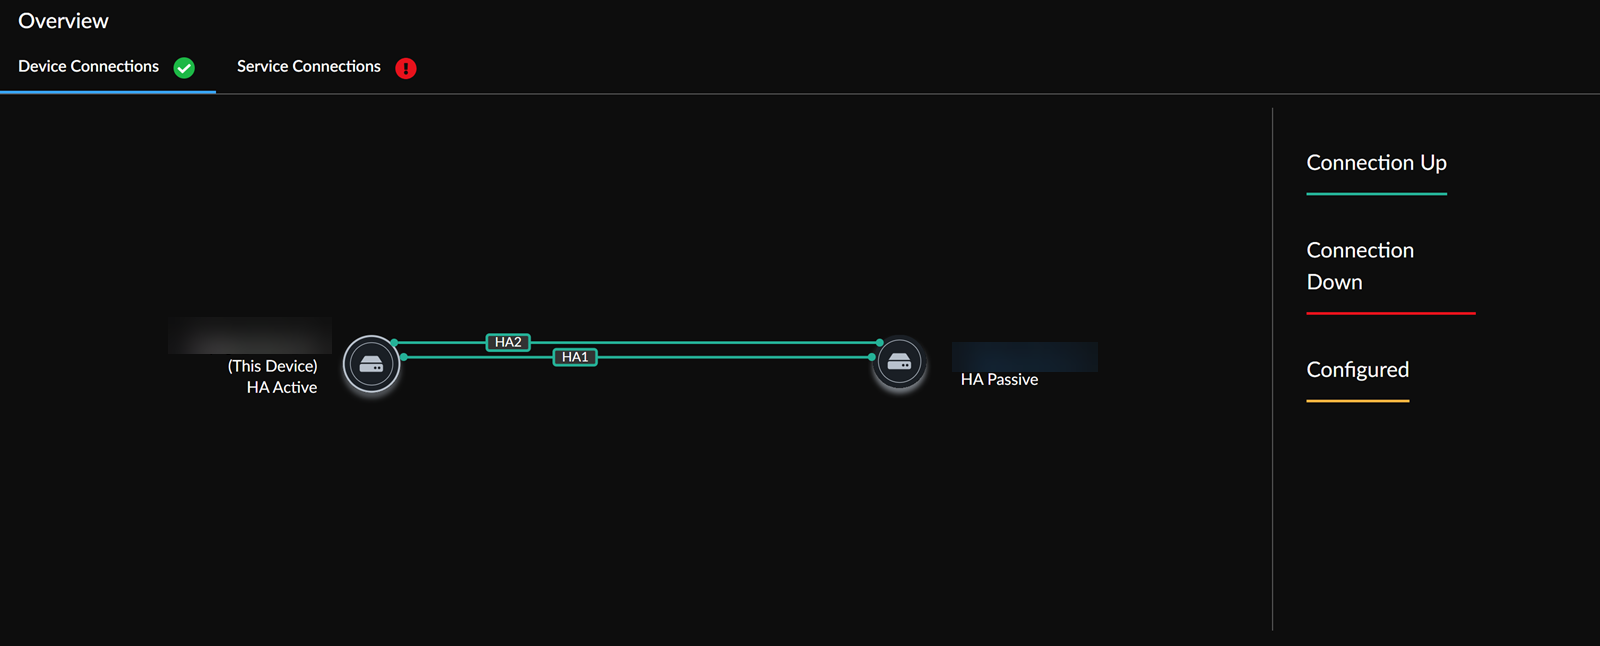
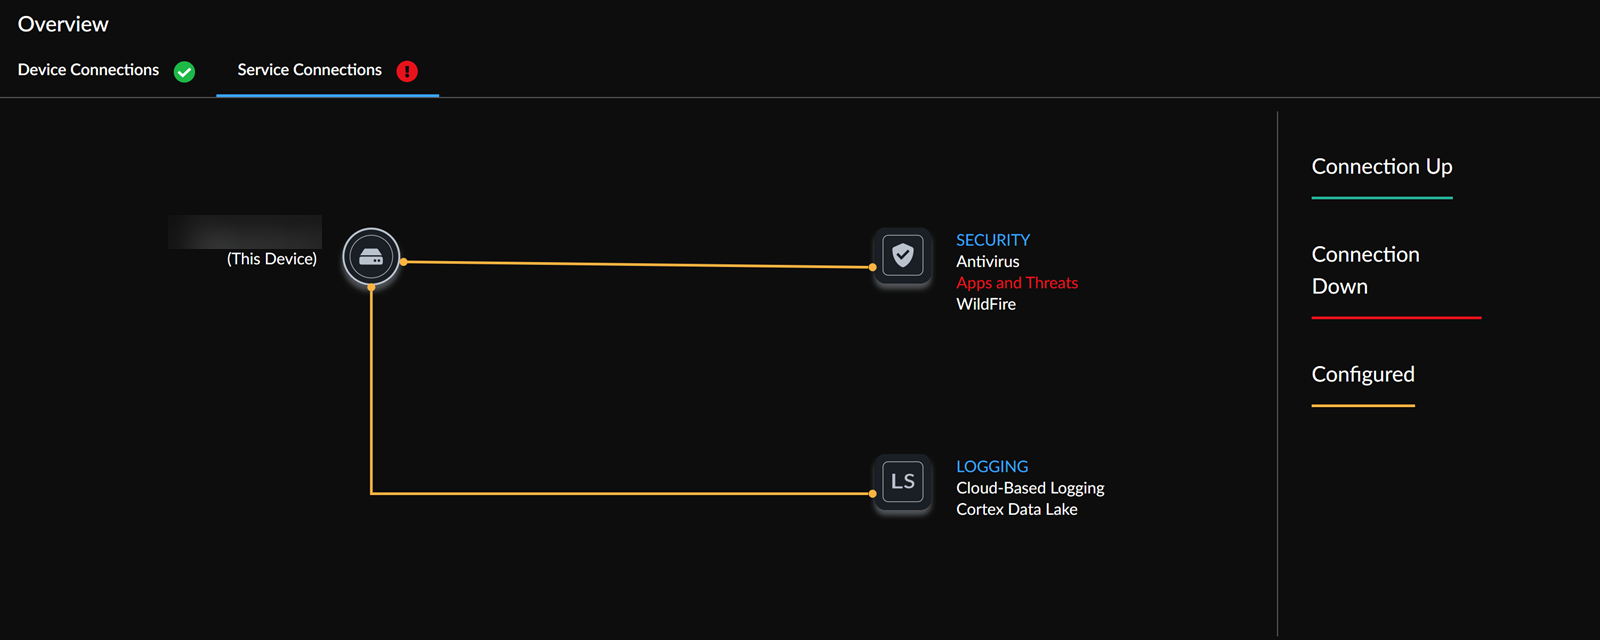
Connectivity Device Connections displays the other devices connected to the one you are currently viewing. Select a device to view its details.![]() Service Connections displays an overview of all Security and Logging services integrated with the device. Select a service to view its details.
Service Connections displays an overview of all Security and Logging services integrated with the device. Select a service to view its details.![]()