Autonomous DEM
Prisma Access Location Details
Table of Contents
Prisma Access Location Details
View the details of the health of any location by drilling down to it.
| Where Can I Use This? | What Do I Need? |
|---|---|
|
|
Click on a Prisma Access Location name in the
Prisma Access Locations table on page to open the location's details page.
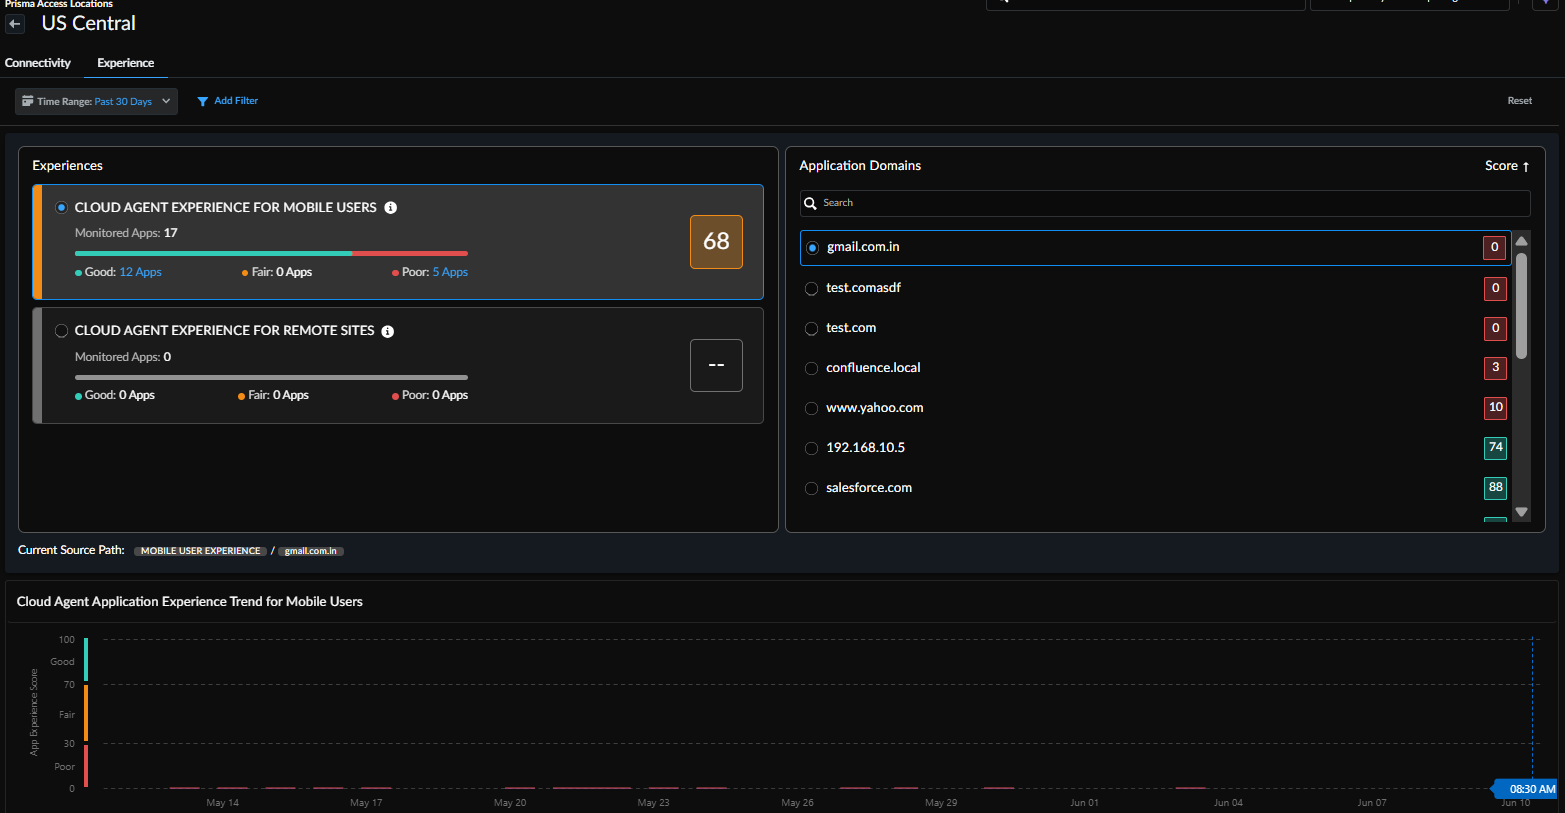
Experiences
View the end-to-end performance metrics from the selected Prisma Access Location
to the applications that are being monitored for that location. You can see the
total number of monitored applications for either the Mobile Users or Remote Sites
that are connected to the Location, as well as their health distribution. Click the
deployment type tile (MOBILE USER EXPERIENCE or
REMOTE SITE EXPERIENCE) to see the metrics for only that
deployment type in the widgets on this page. The Applications
pane displays a list of applications that are used by the deployment type
(Mobile Users or Remote Sites) along with the application experience score
(aggregated score for all application test targets) for each application. By
default, the applications are sorted using their experience score, from lowest
to the highest score. Use the search bar in the Applications pane to search for
an application. Selecting an application displays all the application test
targets that are set up for that application in the Application
Domains pane. By default, no domains are selected.
Select an application domain to display the
data for the target in the widgets on this page. If there are no domains for the
application test, the data displayed in the widgets will be the data for
application. The Current Source Path displays the source path
of the data that is displayed in the widgets.
Application Experience Trend
View the application experience score trend during the selected Time
Range for the application test that is selected in the
Data Sources widget. Click anywhere in this widget and
drag your mouse if you would like to see data for a specific time range within the
widget.
Synthetic Trends and Path Visualization
This widget shows you the responsiveness and availability for the application running
in the Prisma Access Location. Select the metrics that you would like to see by
selecting their check boxes.
If you selected a time slice in the Application Experience
Trend widget by clicking and dragging your mouse pointer, this tab
displays the network topology and path visualization for that time slice.