Autonomous DEM
Create an Application Test to Monitor Mobile User Experience
Table of Contents
Create an Application Test to Monitor Mobile User Experience
Learn how to start running Autonomous DEM synthetic testing on your Prisma Access endpoints so that you can collect digital experience metrics to help you isolate and
resolve performance issues.
| Where Can I Use This? | What Do I Need? |
|---|---|
|
|
In addition to Mobile Users, you can also create application tests for remote
sites.
After you’ve surveyed the applications running on your network and determined which
applications you want to monitor, you can create application tests and decide whether you
want to run the test for Mobile Users, Prisma Access Locations, or both.
To create an app test:
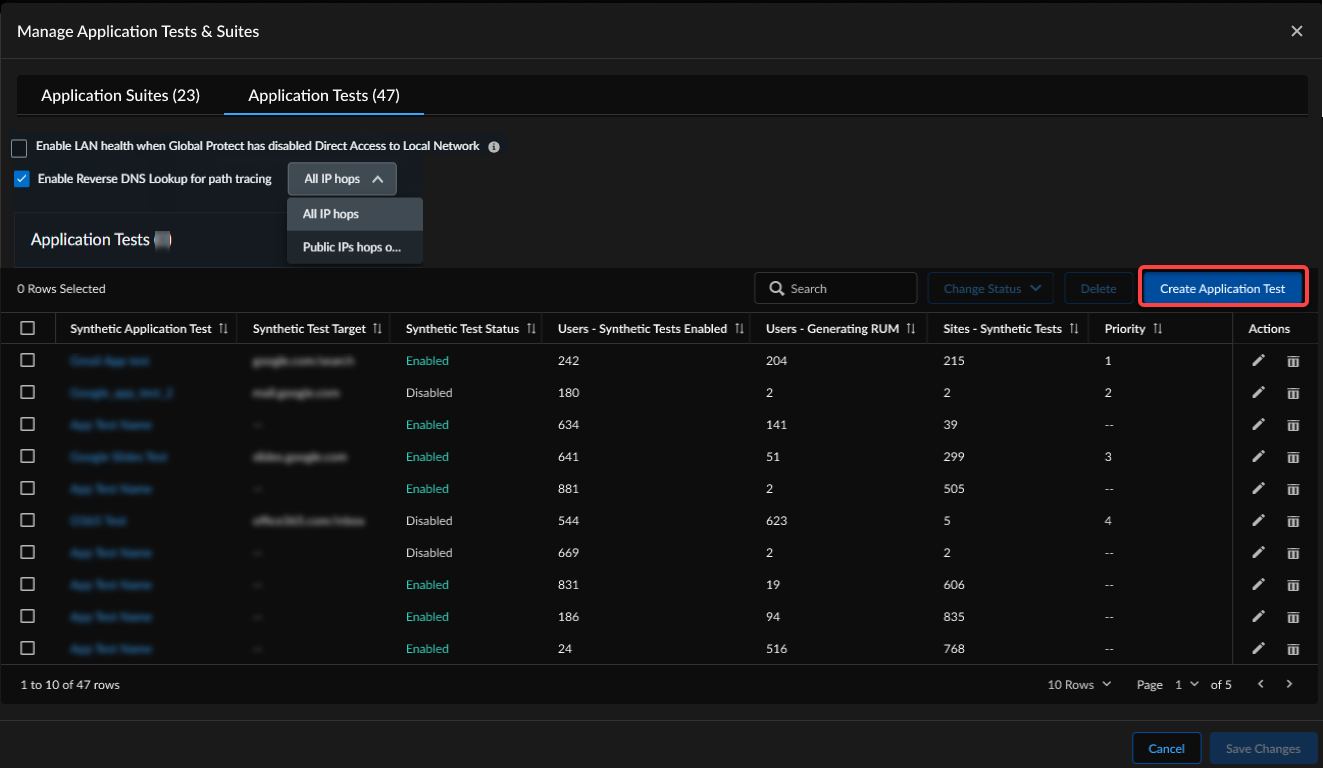
- Select .Select Create Application Test.
![]() Provide the Application Domain URL / Target IP Address for the application you want to test.ADEM validates the URL and if valid, populates the application test name and description.For a list of devices and the maximum number of tests they are capable of running, refer to Get Started for Remote Networks.Select the Source for the Mobile Users or Prisma Access Locations you want to monitor.
Provide the Application Domain URL / Target IP Address for the application you want to test.ADEM validates the URL and if valid, populates the application test name and description.For a list of devices and the maximum number of tests they are capable of running, refer to Get Started for Remote Networks.Select the Source for the Mobile Users or Prisma Access Locations you want to monitor.- Mobile Users: Define the Source Users that you want to run this app test. By default, all licensed ADEM users are assigned to run the test. If you want to limit this app test to specific users, click Mobile Users under Source and select Custom and click in the Search Mobile Users and Groups text box, then select the users and/or groups you want to run the test.
- Prisma Access Locations: Select the Prisma Access locations from which you want to run the application test.
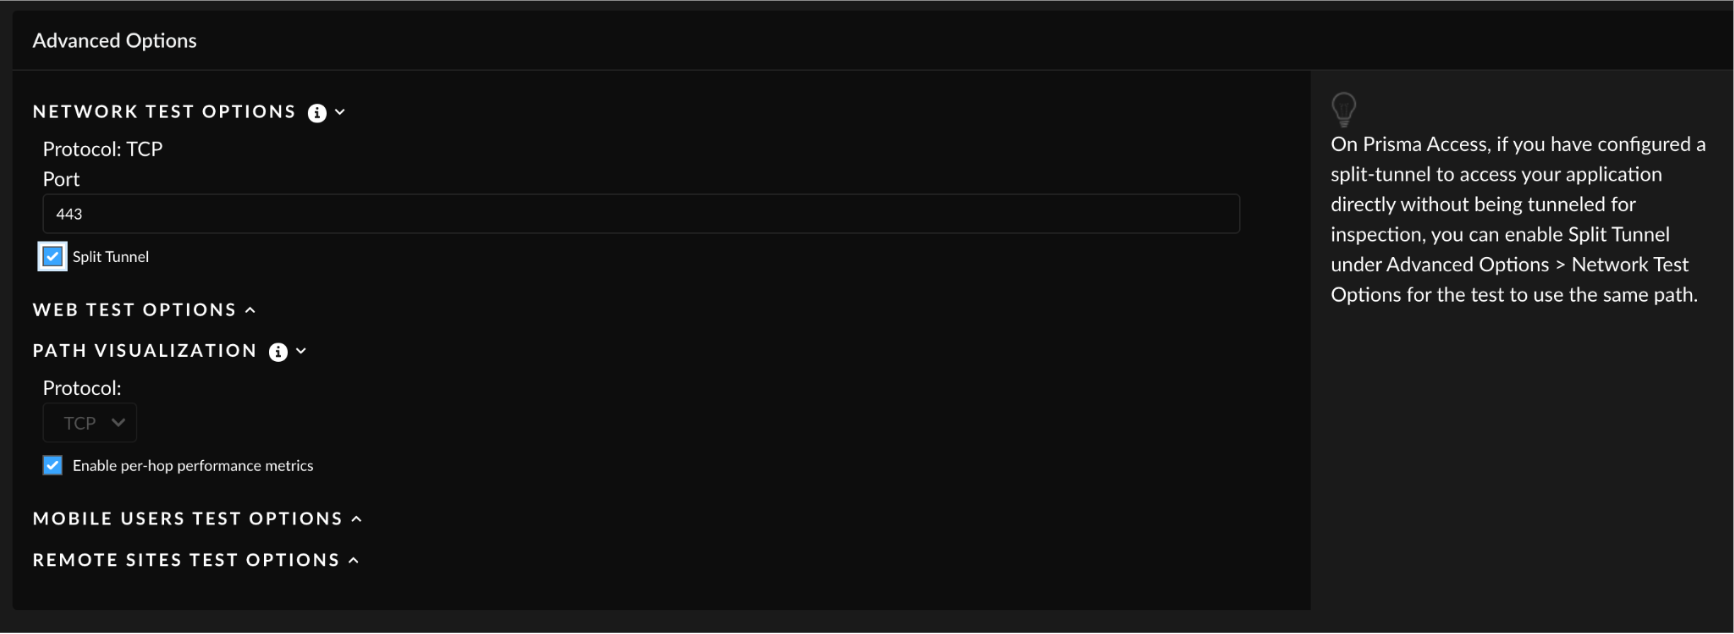
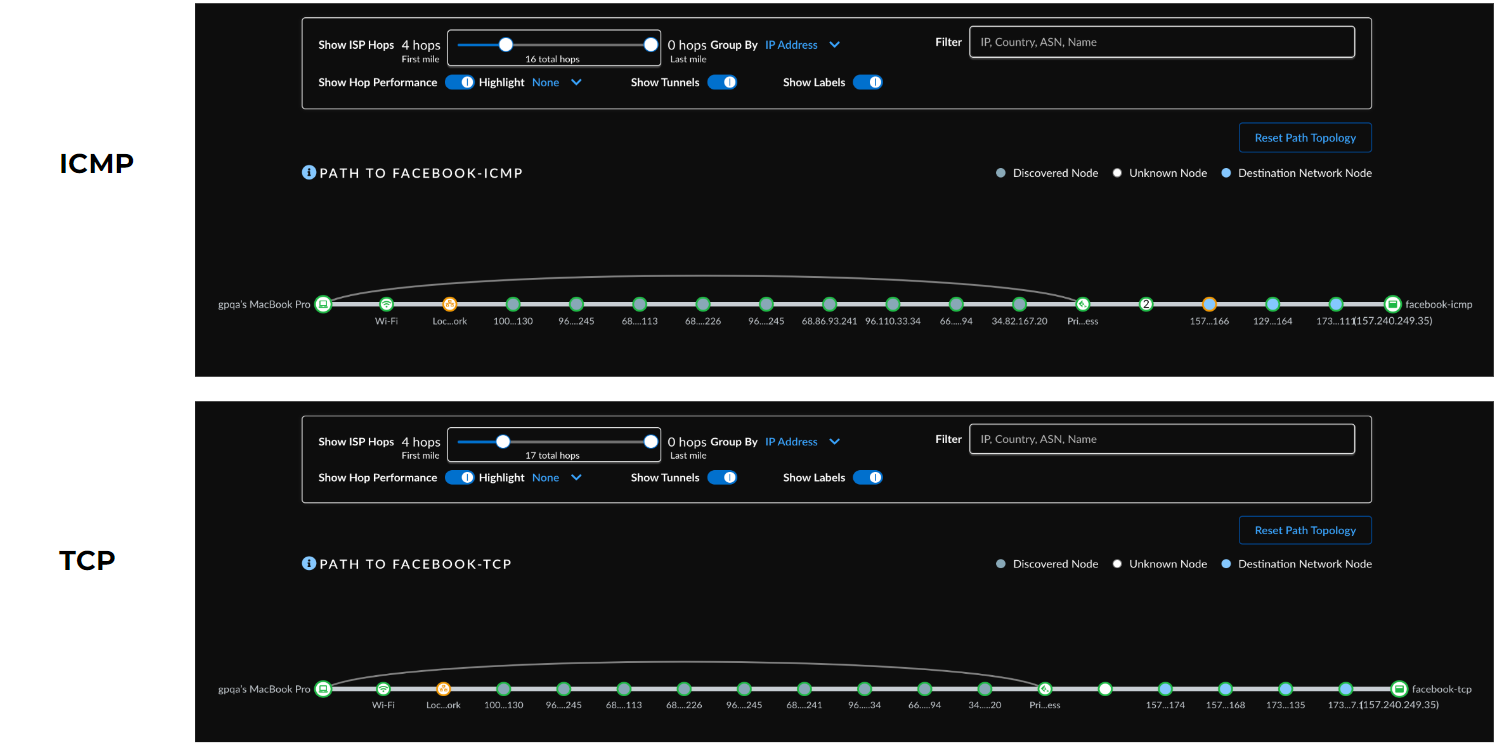
Set the Advanced Options:The options that you select in the Advanced Options section determine what you see in the Path Visualization widget. If the application has been configured in GlobalProtect to be split tunneled, select the Split Tunnel option in the Network Test Options section. To view the split tunneled traffic in the Path Visualization widget, enable the Enable per hop performance metrics option under the Path Visualization section.When creating tests for Zoom and Teams applications, be sure to set Split Tunnel to true and do not run the path tests.![]() Under Path Visualization, TCP or ICMP can be selected as the protocol for traceroute. Here is an example of TCP vs ICMP based traceroutes. Results for TCP and ICMP traceroutes can vary, but sometimes they can be the same. In general, TCP-based traceroutes can provide less unresponsive nodes.
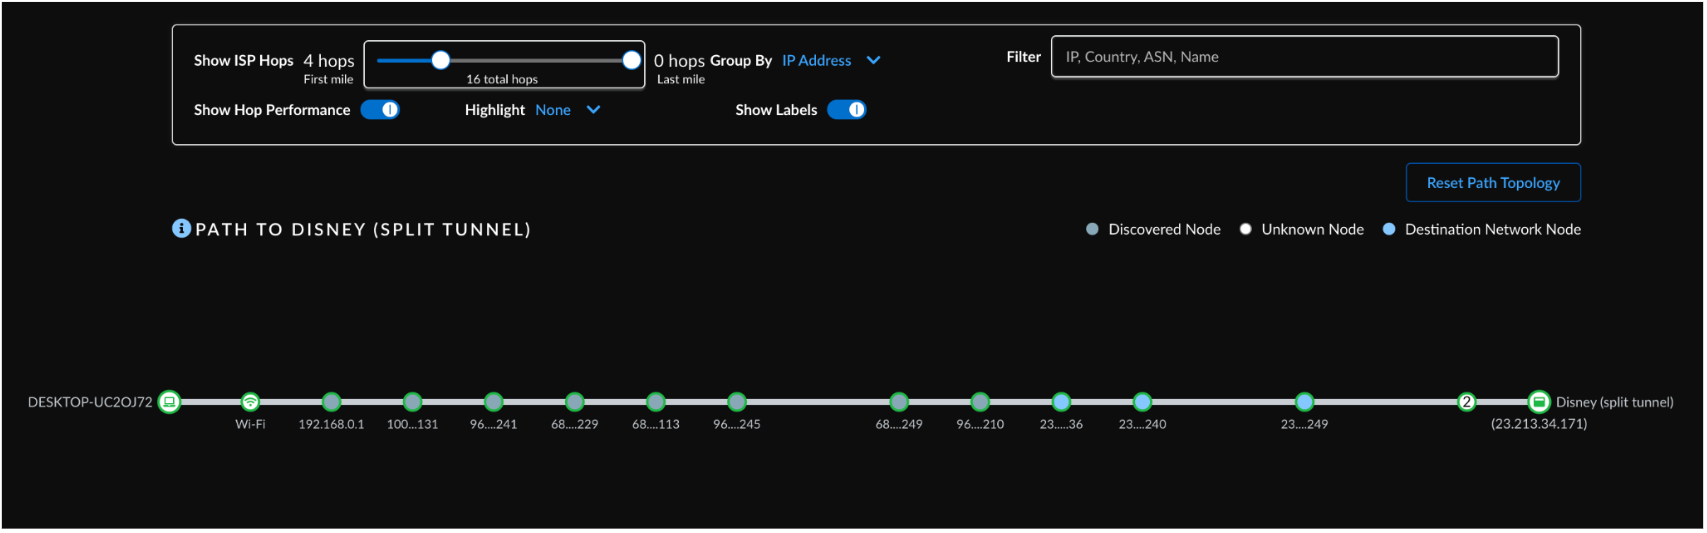
Under Path Visualization, TCP or ICMP can be selected as the protocol for traceroute. Here is an example of TCP vs ICMP based traceroutes. Results for TCP and ICMP traceroutes can vary, but sometimes they can be the same. In general, TCP-based traceroutes can provide less unresponsive nodes.![]() Here is an example of the Path Visualization widget for split tunneled applications. This is an example of when the Split Tunnel option under Network Test Options is selected along with the Enable per hop performance metrics option under Path Visualization.
Here is an example of the Path Visualization widget for split tunneled applications. This is an example of when the Split Tunnel option under Network Test Options is selected along with the Enable per hop performance metrics option under Path Visualization.![]() Network Test Options—measures end-to-end availability, latency, jitter, and packet loss
Network Test Options—measures end-to-end availability, latency, jitter, and packet lossField Description Protocol Protocol to be used for network tests. It is set to TCP and cannot be changed. Port The port that the network tests run on. Port 443 is selected by default. Change it only if the application test target uses a different port.Split Tunnel Select this check box if your application is split tunneled.If you select the Split Tunnel option along with selecting the Enable per hop performance metrics option under Path Visualization you will not be given the option to select a Protocol under Path Visualization. When you select Split Tunnel, the protocol for split tunnel applications will be chosen based on the operating system where the access experience agent resides. The Windows agent will run TCP-based traceroute for split tunnel applications, hence the Protocol under Path Visualization defaults to TCP on Windows. The MacOS agents will run ICMP-based traceroutes for split tunneled applications hence the Protocol defaults to ICMP on MacOS.Selecting the Split Tunnel option along with selecting the Enable per hop performance metrics option under Path Visualization shows per-hop network paths for split tunneled applications in the Path Visualization widget.Web Test OptionsSelection Description Enable HTTP/HTTPS testing When enabled the test uses HTTP/HTTPS to collect application performance metrics. You must clear the checkbox for non-web-based applications, such as SMB, to collect network performance metrics only. Ignore SSL warnings and errors Select this option to make sure that an application test does not fail due to SSL warnings and errors such as the ones caused due to certificate trust issues. Override the default HTTP/HTTPS port Select this box if you want to use the port that you specified under Network Test Options instead of the standard port for HTTP/HTTPS. Protocol Select the protocol to use (HTTP or HTTPS) when running end-to-end tests. Unless you chose to Override the default HTTP/HTTPS port, the tests use port 80 for HTTP and 443 for HTTPS. Path Optional. A custom path that will be appended to the target during the end-to-end test and allows clients to test different paths on the same server, for example, www.someserver.com/some/path. Headers Optional. Custom HTTP headers that are sent as part of the HTTP/S request to a given target for end-to-end tests. Path Visualization—measures per hop network paths with TCP/ICMPField Description Enable per hop performance metrics This check box is enabled by default. When enabled it displays per-hop network paths for split tunneled applications in the Path Visualization widget. If you select the Split Tunnel option in the Network Options section, along with selecting the Enable per hop performance metrics option, you will not be given the option to select a Protocol. When you select Split Tunnel, the protocol for split tunnel applications will be chosen based on the operating system where the access experience agent resides. The Windows agent will run TCP-based traceroute for split tunnel applications, hence the Protocol under Path Visualization defaults to TCP on Windows. The MacOS agents will run ICMP-based traceroutes for split tunneled applications hence the Protocol defaults to ICMP on MacOS.Protocol For non-Split Tunnel applications, you have the option to select TCP or ICMP protocol. - TCP—If you select TCP, the path visualization test will run on the port that you specified in Network Test Options. Choose TCP if you foresee that ICMP may get blocked along the path.
- ICMP—If you select ICMP, the path visualization test will not run on any port because ICMP does not have a port associated with it. Choose ICMP if TCP is not working and you have verified that a security policy rule is not blocking the TCP port.
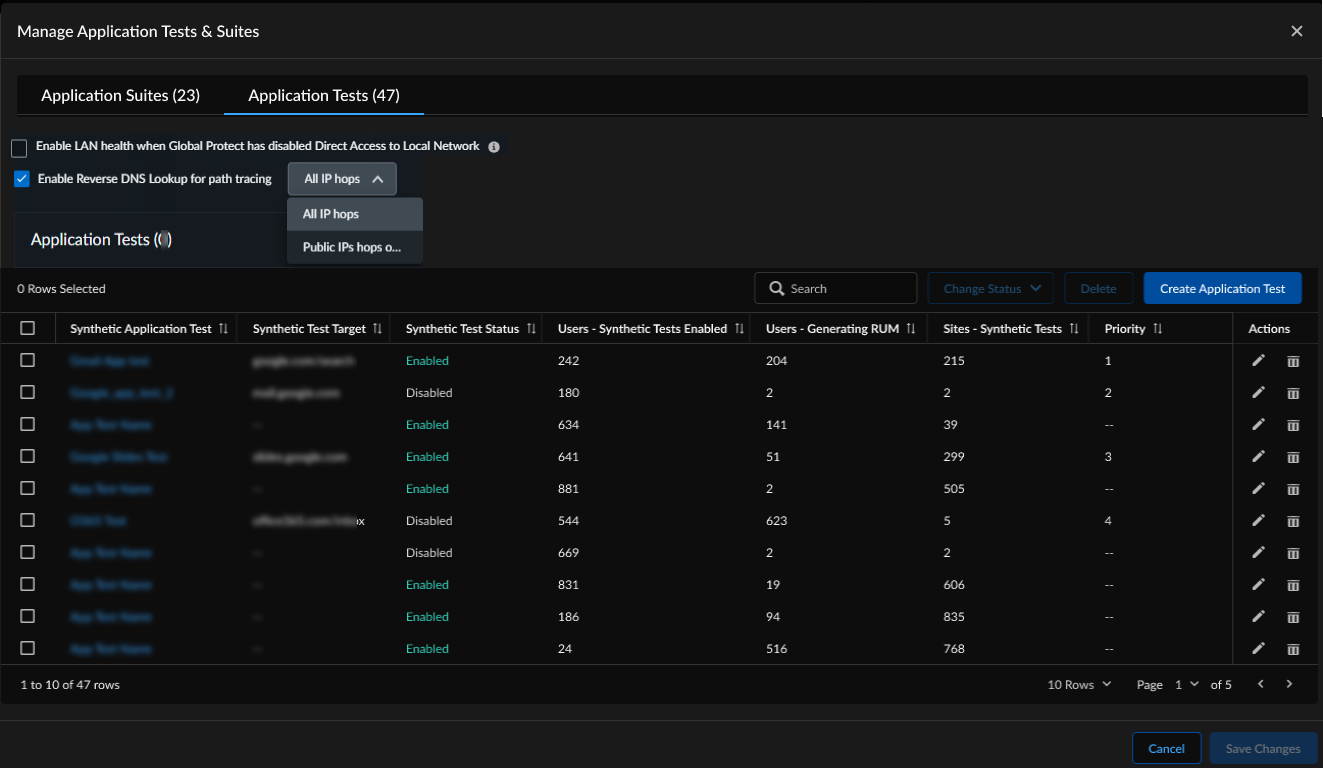
If your security policy is set to 'application-default' under 'Service/URL Category' or 'APPLICATION / SERVICE', your traffic may be getting dropped, causing traceroute to not run successfully. Update this field to 'any' so that any port can be used.If you select the Split Tunnel option in the Network Options section, along with selecting the Enable per hop performance metrics option, you will not be given the option to select a Protocol. When you select Split Tunnel, the protocol for split tunnel applications will be chosen based on the operating system where the access experience agent resides. The Windows agent will run TCP-based traceroute for split tunnel applications, hence the Protocol under Path Visualization defaults to TCP on Windows. The MacOS agents will run ICMP-based traceroutes for split tunneled applications hence the Protocol defaults to ICMP on MacOS.Mobile Users Test OptionsEnabling end-to-end Application Experience monitoring when mobile users are in Trusted Networks will consume additional session connections per Mobile User and per application on Remote Site devices.Selection Description End-to-end Application Experience monitoring from Trusted Networks (in Office) Select this option if you are in a trusted network environment. End-to-end Application Experience monitoring from Untrusted Networks when VPN is disabled Select this option if you are in an untrusted network environment such as using a public network with your VPN is disabled. Save the test.The tests get a priority assigned to them in the order that they were created.For example, the first test you create gets a priority order 1. The next test you create gets priority order 2, and so on. The tests are pushed to the mobile users and remote site according to the priority they are assigned. If the remote site devices have available capacity for the test, the test will be enabled. Otherwise, the remote site gets moved to the Excluded Remote Sites for the test.Even though the tests are assigned to both Mobile Users and Remote Sites, the priority in which the tests are pushed to the device is important particularly to the remote sites, since each device in a remote site is capable of running a different number of tests depending on the device size.So, if you have created a test, for example Test A which has a priority of 8, and attached it to multiple remote sites all of which can run Test A, if one of those sites, for example San Jose, has reached its limit on how many tests it can run, Test A will not be pushed to the site. That remote site (San Jose) will get moved under the Excluded Remote Sites column in the Application Tests table on the Application Tests page.But if you absolutely must run the Test A, you can change the priority of Test A from 8 to a higher location in the table, for example to the top of the list by clicking on the dots to the left of the check box and dragging and dropping it to the top of the list. Alternatively, you can select its check box and click the up arrow at the bottom of the page. You will see its priority change only after you click Save. Now Test A will get a higher priority and will be pushed to the San Jose remote site before the remaining tests that follow Test A in the table. This would mean though that the San Jose remote site will now be excluded in the configuration push from some other lower priority test (lower priority compared to Test A) that is pushed to it.View a summary of all the tests created in .![]() The next time the selected users connect to Prisma Access they will receive the new app test settings and begin running the tests. After the app tests start running, the ADEM service collects sample data from all assigned users every five minutes.
The next time the selected users connect to Prisma Access they will receive the new app test settings and begin running the tests. After the app tests start running, the ADEM service collects sample data from all assigned users every five minutes.