Next-Generation Firewall
Network Monitor Report
Table of Contents
Expand All
|
Collapse All
Next-Generation Firewall Docs
-
-
-
-
-
-
-
- PAN-OS 12.1
- PAN-OS 11.2
- PAN-OS 11.1
- PAN-OS 11.0 (EoL)
- PAN-OS 10.2
- PAN-OS 10.1
- PAN-OS 10.0 (EoL)
- PAN-OS 9.1 (EoL)
- PAN-OS 9.0 (EoL)
- PAN-OS 8.1 (EoL)
-
- PAN-OS 12.1
- PAN-OS 11.2
- PAN-OS 11.1
- PAN-OS 10.2
- PAN-OS 10.1
Network Monitor Report
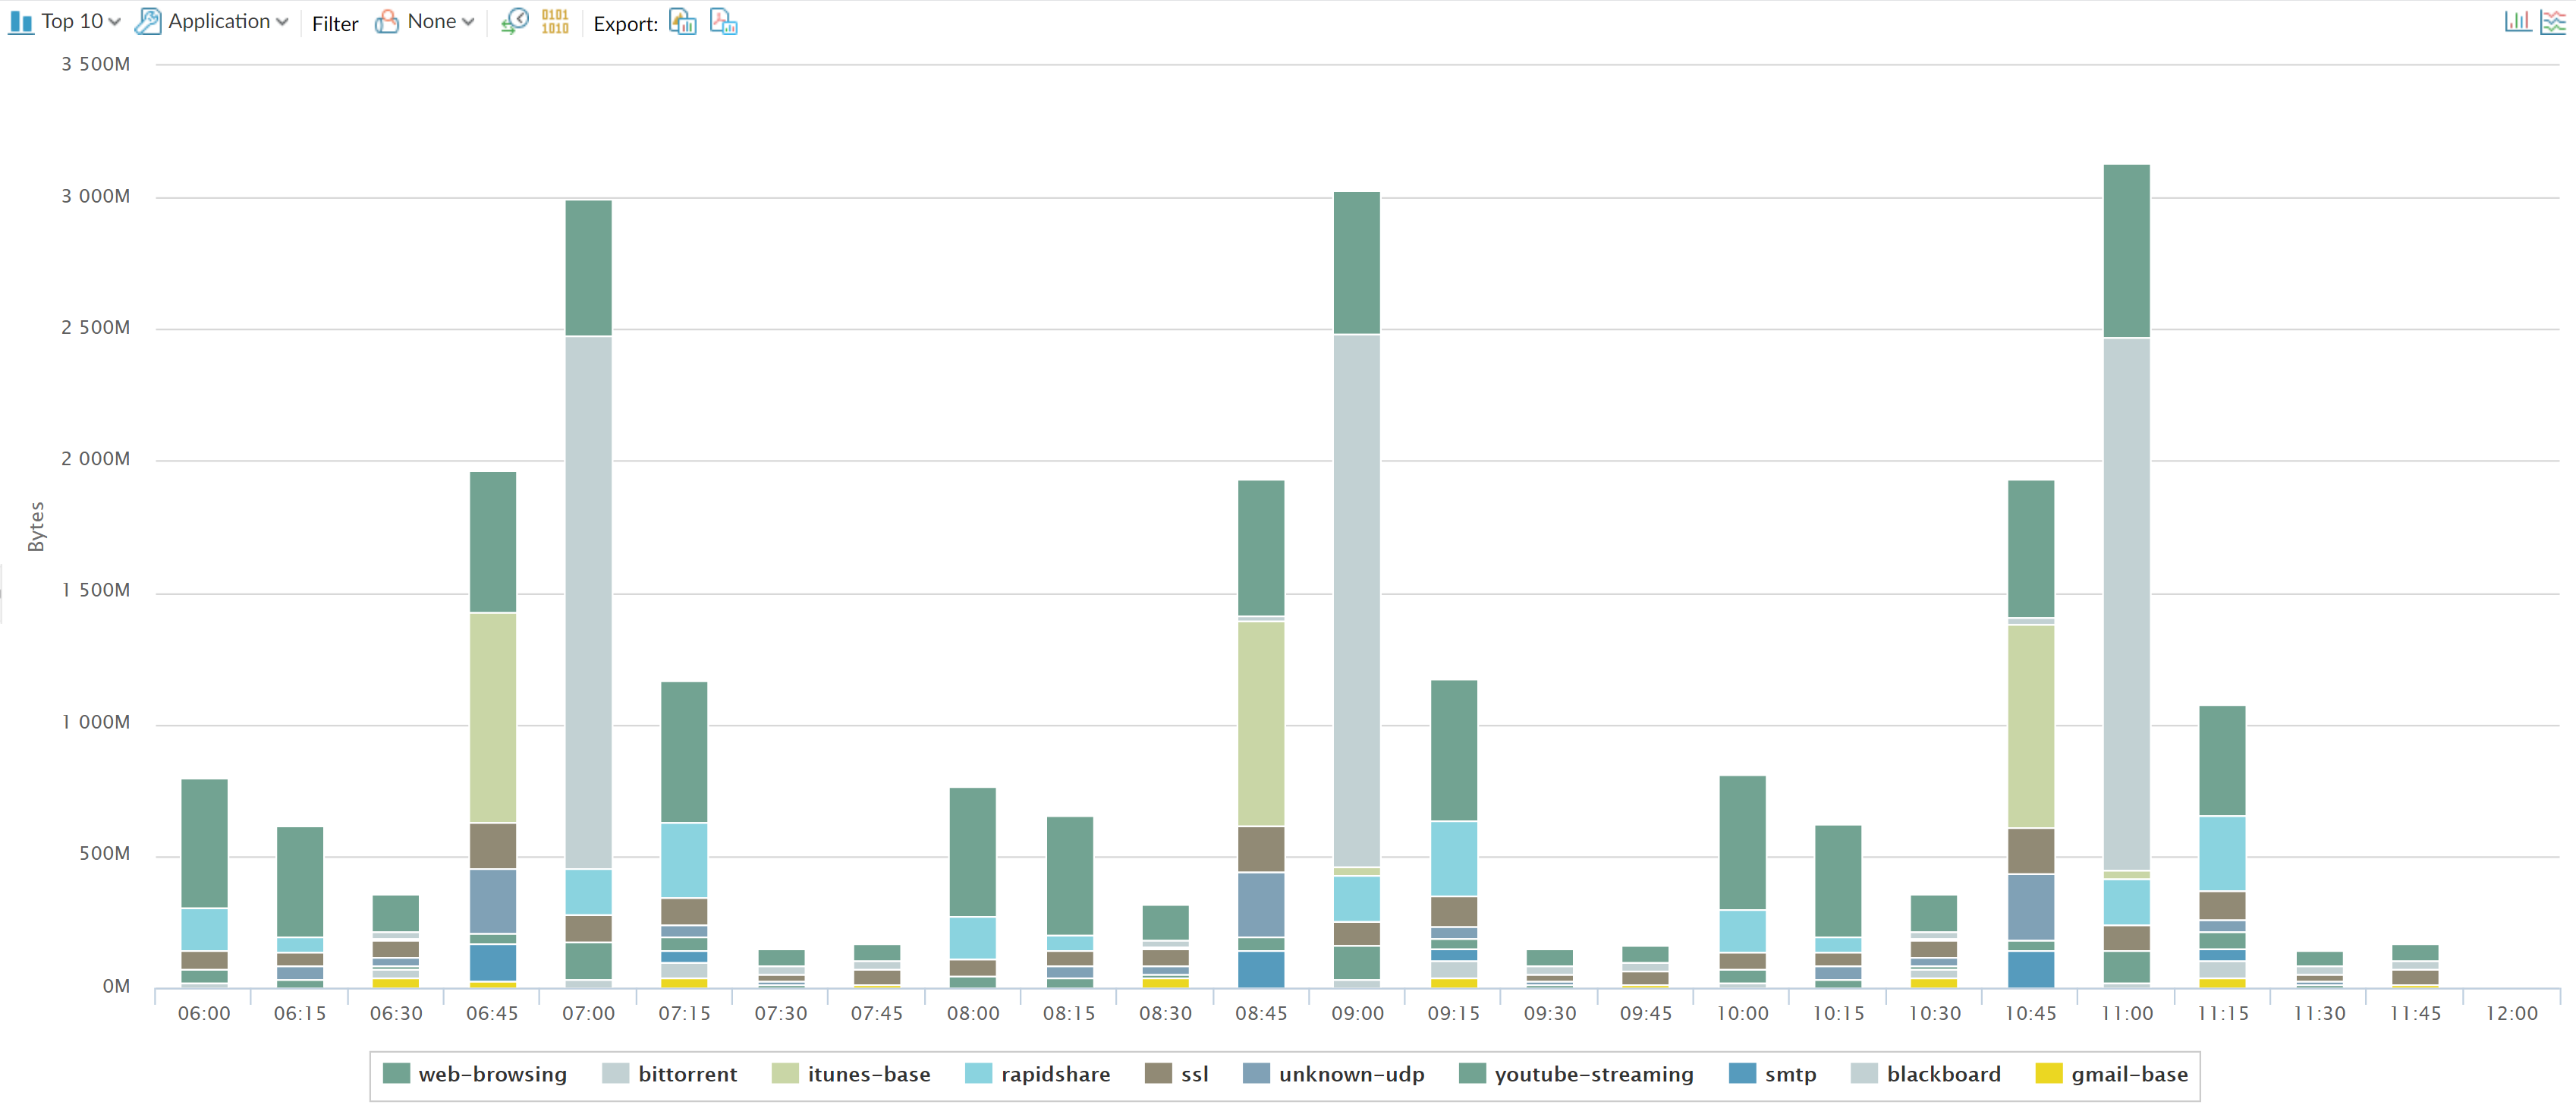
The App Scope Network Monitor report (MonitorApp ScopeNetwork Monitor) displays the
bandwidth dedicated to different network functions over the specified
period of time. Each network function is color-coded as indicated
in the legend below the chart. For example, the image below shows
application bandwidth for the past 7 days based on session information.

The Network Monitor report contains the following buttons and
options.
Button | Description |
|---|---|
Top 10 | Determines the number of records with the
highest measurement included in the chart. |
Application | Determines the type of item reported: Application, Application
Category, Source, or Destination. |
Filter | Applies a filter to display only the selected
item. None displays all entries. |
Determines whether to display session or
byte information. | |
Export | Exports the graph as a .png image or as
a PDF. |

| Determines whether the information is presented
in a stacked column chart or a stacked area chart. |
Indicates the period over which the change measurements
are taken. |


