ACC—First Look
Table of Contents
ACC—First Look
Take a quick tour of the ACC.
ACC—First
Look | ||
|---|---|---|

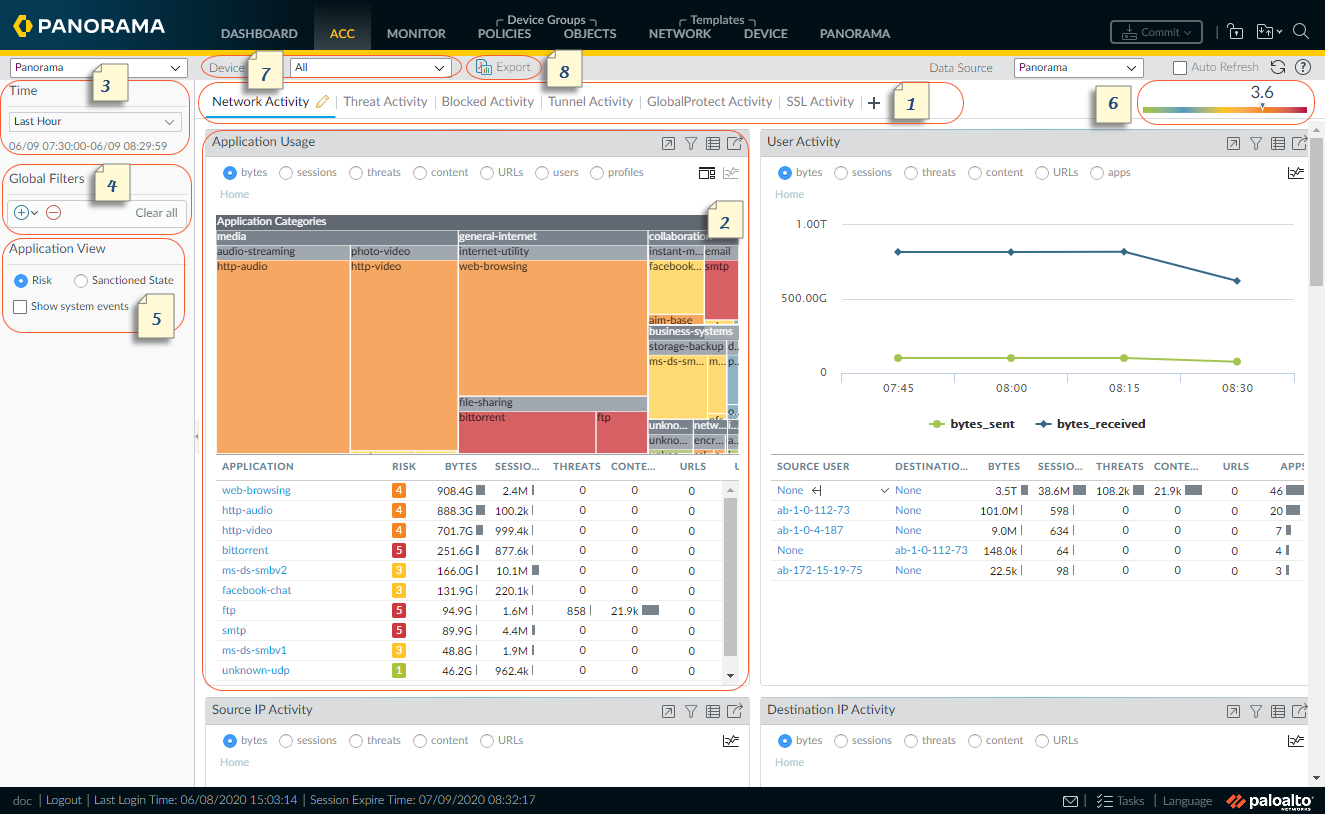
| Tabs | The ACC includes three predefined tabs that
provide visibility into network traffic, threat activity, and blocked
activity. For information on each tab, see ACC
Tabs. |

| Widgets | Each tab includes a default set of widgets
that best represent the events/trends associated with the tab. The
widgets allow you to survey the data using the following filters:
For information on each
widget, see ACC
Widgets. |

| Time | The charts or graphs in each widget provide
a summary and historic view. You can choose a custom range or use
the predefined time periods that range from the last 15 minutes
up to the last 90 days or last 30 calendar days. The selected time period
applies across all tabs in the ACC. The time period used to
render data, by default, is the Last Hour updated
in 15 minute intervals. The date and time interval are displayed
onscreen, for example at 11:40, the time range is 01/12 10:30:00-01/12
11:29:59. |

| Global Filters | The Global Filters allow you to set the
filter across all widgets and all tabs. The charts/graphs apply
the selected filters before rendering the data. For information
on using the filters, see ACC
Filters. |

| Application View | The application view allows you filter the
ACC view by either the sanctioned and unsanctioned applications
in use on your network, or by the risk level of the applications
in use on your network. Green indicates sanctioned applications,
blue unsanctioned applications, and yellow indicates applications
that are partially sanctioned. Partially sanctioned applications
are those that have a mixed sanctioned state; it indicates that
the application is inconsistently tagged as sanctioned, for example
it might be sanctioned on one or more virtual systems on a firewall
enabled for multiple virtual systems or across one or more firewalls
within a device group on Panorama. |

| Risk Factor | The risk factor (1=lowest to 5=highest)
indicates the relative risk based on the applications used on your network.
The risk factor uses a variety of factors to assess the associated
risk levels, such as whether the application can share files, is
it prone to misuse or does it try to evade firewalls, it also factors
in the threat activity and malware as seen through the number of
blocked threats, compromised hosts or traffic to malware hosts/domains. |

| Source | The data used for the ACC display. The options
vary on the firewall and on Panorama. On the firewall, if
enabled for multiple virtual systems, you can use the Virtual
System drop-down to change the ACC display to include
data from all virtual systems or just a selected virtual system. On
Panorama, you can select the Device Group drop-down
to change the ACC display to include data from all device groups
or just a selected device group. Additionally, on Panorama,
you can change the Data Source as Panorama data
or Remote Device Data. Remote
Device Data is only available when all the managed firewalls
are on PAN-OS 7.0.0 or later. When you filter the display for a
specific device group, Panorama data is used
as the data source. |

| Export | You can export the widgets displayed in
the currently selected tab as a PDF. The PDF is downloaded and saved
to the downloads folder associated with your web browser, on your
computer. |