Configure Custom URL Filtering Reports
Table of Contents
Configure Custom URL Filtering Reports
Learn how to configure a custom URL filtering report
that uses data from URL filtering logs.
To generate a detailed report that you can
schedule to run regularly, configure a custom URL Filtering report.
You can choose any combination of URL Filtering log fields on which
to base the report.
- Add a new custom report.
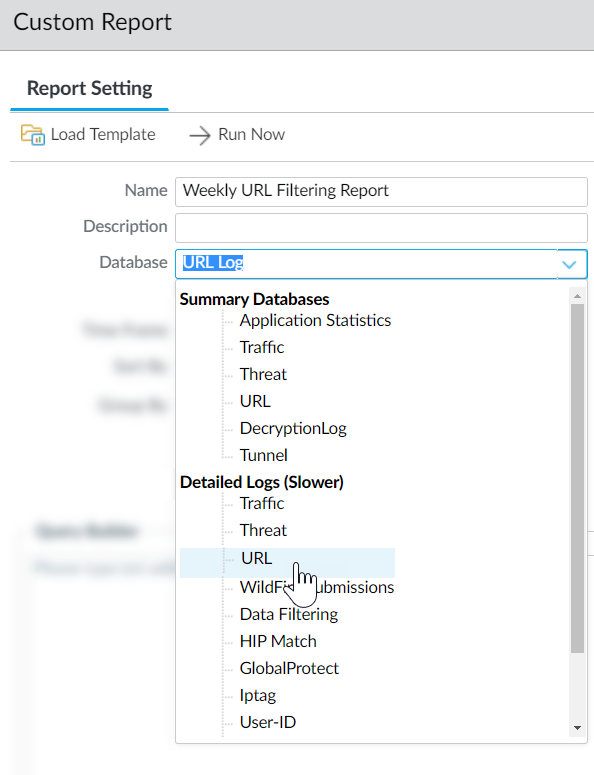
- Select and Add a report.Give the report a unique Name, and optionally a Description.Select the Database you want to use to generate the report. To generate a detailed URL Filtering report, select URL from the Detailed Logs section:
![]() Configure report options.
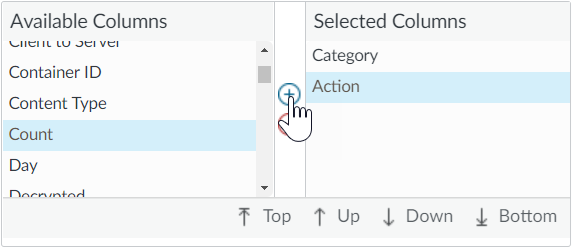
Configure report options.- Select a predefined Time Frame or select Custom.Select the log columns to include in the report from the Available Columns list add them () to the Selected Columns. For example, for a URL Filtering report you might select:
![]()
- Action
- App Category
- Category
- Destination Country
- Source User
- URL
![]() If the firewall is enabled to prevent credential phishing, select the Attribute Flags, the Operator has and the Value Credential Detected to also include events in the report that record when a user submitted a valid corporate credential to a site.
If the firewall is enabled to prevent credential phishing, select the Attribute Flags, the Operator has and the Value Credential Detected to also include events in the report that record when a user submitted a valid corporate credential to a site.![]() (Optional) Select a Sort By option to set the attribute to use to aggregate the report details. If you do not select an attribute to sort by, the report will return the first N number of results without any aggregation. Select a Group By attribute to use as an anchor for grouping data. The following example shows a report with Group By set to App Category and Sort By set to a Count of Top 5.
(Optional) Select a Sort By option to set the attribute to use to aggregate the report details. If you do not select an attribute to sort by, the report will return the first N number of results without any aggregation. Select a Group By attribute to use as an anchor for grouping data. The following example shows a report with Group By set to App Category and Sort By set to a Count of Top 5.![]() Run the report.
Run the report.- Click the Run Now icon to immediately generate the report, which opens in a new tab.When you are done reviewing the report, go back to the Report Setting tab and either tune the settings and run the report again, or continue to the next step to schedule the report.Select the Schedule check box to run the report once per day. This will generate a daily report that details web activity over the last 24 hours.Commit the configuration.View the custom report.
- Select .Expand the Custom Reports pane in the right column and select the report you want to view. The latest report displays automatically.To view the report for a previous date, select the date from the calendar. You can also export the report to PDF, CSV, or XML.