Prisma Access Agent
Audit Prisma Access Agent Configuration Activities
Table of Contents
Audit Prisma Access Agent Configuration Activities
| Where Can I Use This? | What Do I Need? |
|---|---|
|
|
You can audit any Prisma Access Agent configuration change in the log viewer or
Strata Logging Service.
For example, you can audit the configuration logs to see the configuration activities
that were performed in Prisma Access and who initiated the actions. You can also
view event details to identify the Prisma Access configuration before and
immediately after a configuration change.
All data is collected and sent to Strata Logging Service, which is viewable in
Strata Logging Service or the Prisma Access log viewer.
To learn how to use the log viewer, you can explore logs in detail.
- Open the log viewer or Strata Logging Service.
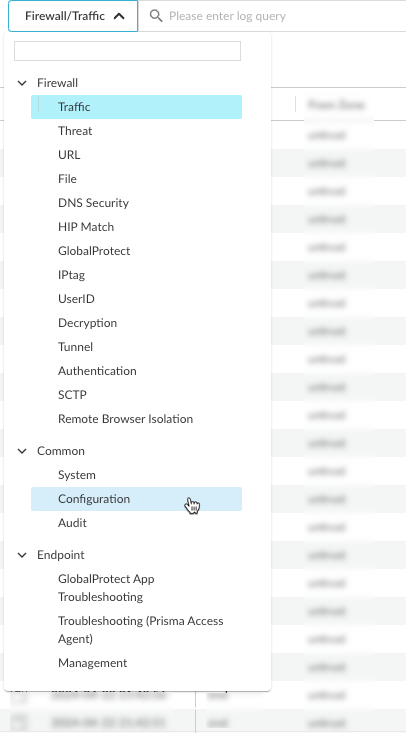
- In the log viewer, the following events will be logged under Log ViewerCommonConfiguration.
![]()
- In Strata Logging Service, select ExploreCommonConfiguration.
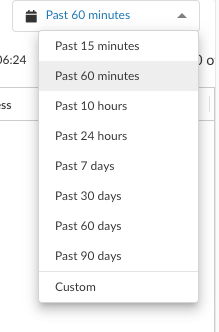
If no data is displayed, increase the different time range to show more entries.![]() To narrow the scope of the logs in the table, you can create queries based on the column headings in the log viewer, and save the queries as filters for use later.
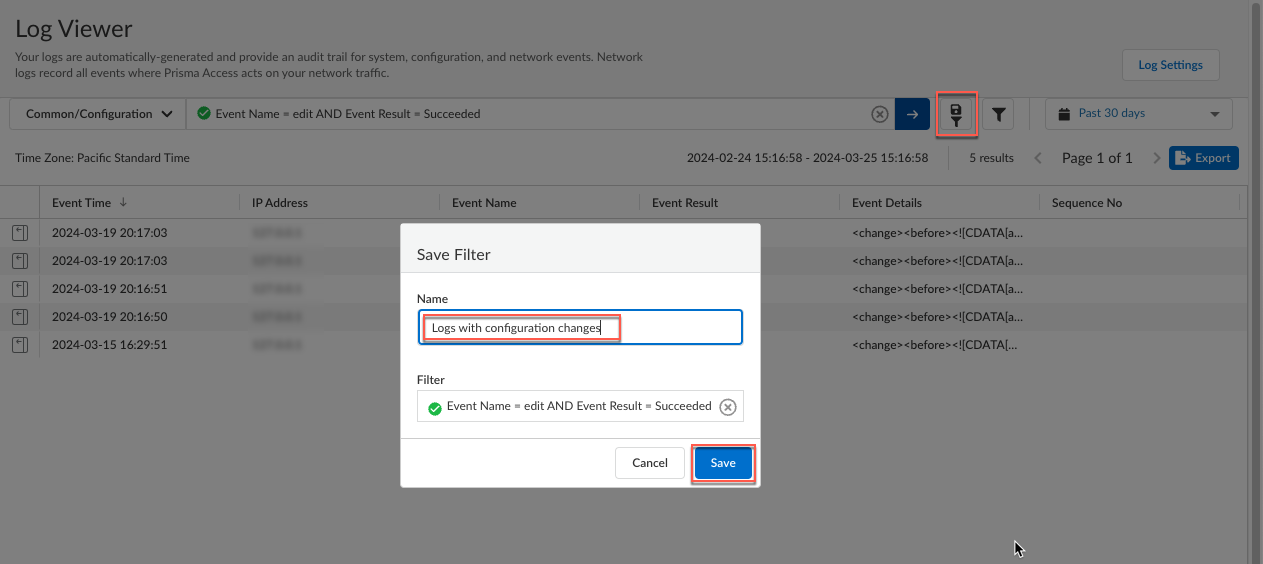
To narrow the scope of the logs in the table, you can create queries based on the column headings in the log viewer, and save the queries as filters for use later.- Enter a log query in the search field. Click to display a list of fields and select an item from the list or start entering the name of a field and select from the list of matching items.You can create queries base on the configuration schema.Select an operator, such as =, !=, < >, or LIKE and a value for the field. You can build on the query by adding AND or OR operators. For example, to show logs that have configuration changes, you can create a query such as:
Event Name = edit AND Event Result = Succeeded
You can use the LIKE operator to filter on values that match a pattern you provide. For example, to show all event ID values that start with gateway, you can specify:Event ID Value LIKE 'gateway%'
Select a different time range if needed.Click the right arrow to begin the query.![]() To save the query for future use, click the filter save icon. Then, enter a descriptive Name for the query and Save the filter for future use.
To save the query for future use, click the filter save icon. Then, enter a descriptive Name for the query and Save the filter for future use.![]() (Optional) Export the log query results to a .csv file and download the file to your computer for further analysis with a spreadsheet app.To view the details in a log, click the iconnext to a log in the table to open the LOG DETAILS window.
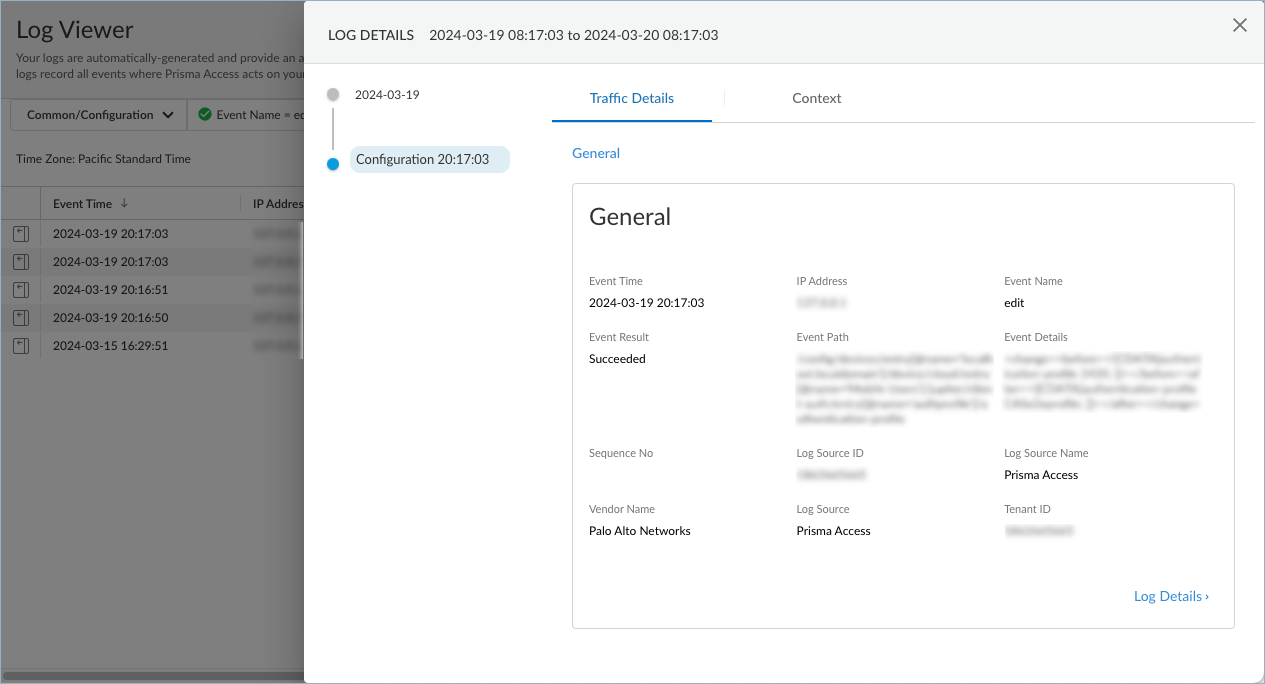
(Optional) Export the log query results to a .csv file and download the file to your computer for further analysis with a spreadsheet app.To view the details in a log, click the iconnext to a log in the table to open the LOG DETAILS window.![]()
![]() To show all the details in the log, select Log Details.
To show all the details in the log, select Log Details.
- In the log viewer, the following events will be logged under Log ViewerCommonConfiguration.


