View WildFire API Usage Statistics
Table of Contents
View WildFire API Usage Statistics
Keep track of your WildFire API usage by reviewing the statistics charts available on
the Palo Alto Networks Support Portal.
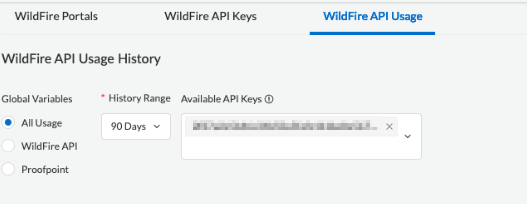
- Log in to the Palo Alto Networks Support Portal.Navigate to the page.Select the options for viewing the WildFire API Usage History; this must be done to generate the usage charts:
![]()
- Global Variables—Select from All Usage, WildFire API, or Proofpoint.
- Effective February 1, 2023, all submissions from Proofpoint integration will be counted against daily WildFire API limits. This change affects only Proofpoint integration through the WildFire API. It does not affect any WildFire file submissions via other Palo Alto Networks products, such as the NGFW platform, Prisma, or Cortex.
- History Range—The default and only available option is 90 Days.
- Available API Keys—Select one or more WildFire API keys for which to view the API history. You can remove an added WildFire API key by clicking on the 'x' next to the API entry.
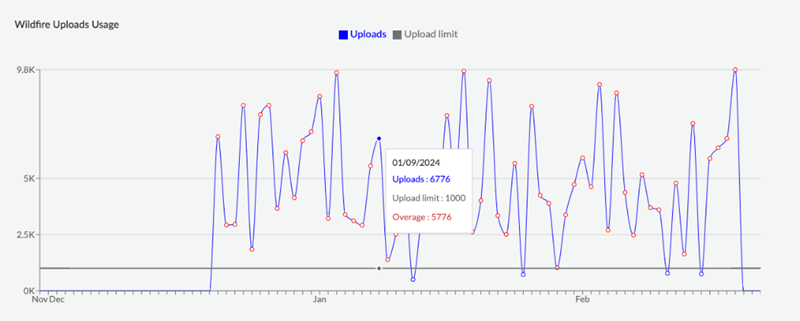
When the selections or updates to the variables have been made, two usage charts are generated:![]()
- WildFire Uploads Usage—This chart displays the WildFire API upload usage. You can optionally select Upload limit to set a visual indicator for your license limitation for WildFire API uploads. Hovering over the chart produces a tool tip which displays a data point for the number of Uploads and any Overage occurrences for a given day.
![]()
- WildFire Queries Usage—This chart displays the WildFire API query usage. You can optionally select Query limit to set a visual indicator for your license limitation for WildFire API queries. Hovering over the chart produces a tool tip which displays a data point for the number of Queries and any Overage occurrences for a given day.