Strata Logging Service
Interact with Query Results
Table of Contents
Expand All
|
Collapse All
Strata Logging Service Docs
Interact with Query Results
Learn how to interact with query results.
| Where Can I Use This? | What Do I Need? |
|---|---|
| One of these:
|
After you create the filter to display the set of logs that you're interested in, you
can choose to do the following:
- View log details from the log table.
- Configure the log table to show only the required fields.
- Save the filter to use later or to share with other users.
- Save the settings as preferences in profiles.
- Export the log details to a compressed CSV file in GZ format.
Save Filters
After you create the filter to display the set of logs that you're interested in,
you can choose to save the filter to use later or to share with other users.
- Selectand enter a query in the query field.
![]() (Optional) Name the filter.The default name is New Filter <date time>.Save the filter.After saving the query, clickto view, execute, edit, delete, or share it (
(Optional) Name the filter.The default name is New Filter <date time>.Save the filter.After saving the query, clickto view, execute, edit, delete, or share it (![]() ShareCopy Link) with other users.
ShareCopy Link) with other users.![]() The user must have access to the same Strata Logging Service tenant and the necessary permissions to view logs.
The user must have access to the same Strata Logging Service tenant and the necessary permissions to view logs.Configure Log Table
By default, the log table shows you a subset of the fields on the log record. These are shown in the order that they appear on the log record. The exception is the pinned field, which is shown as the first column in the table, and is by default the record's Time Generated field. You can sort this field in ascending or descending order.![]() You can change the fields that are displayed in the log table, their order, and which fields are pinned.
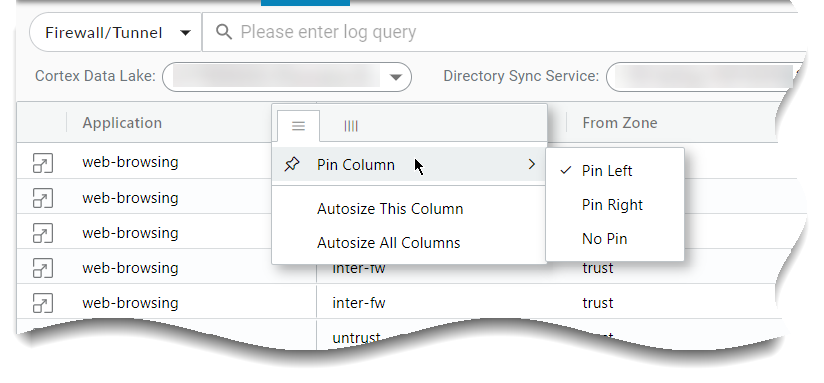
You can change the fields that are displayed in the log table, their order, and which fields are pinned.- To pin the column, click on the menu control in any table column header. In the resulting pop-up, you can configure your table settings. Use Pin Column to control whether the current column is pinned.
![]()
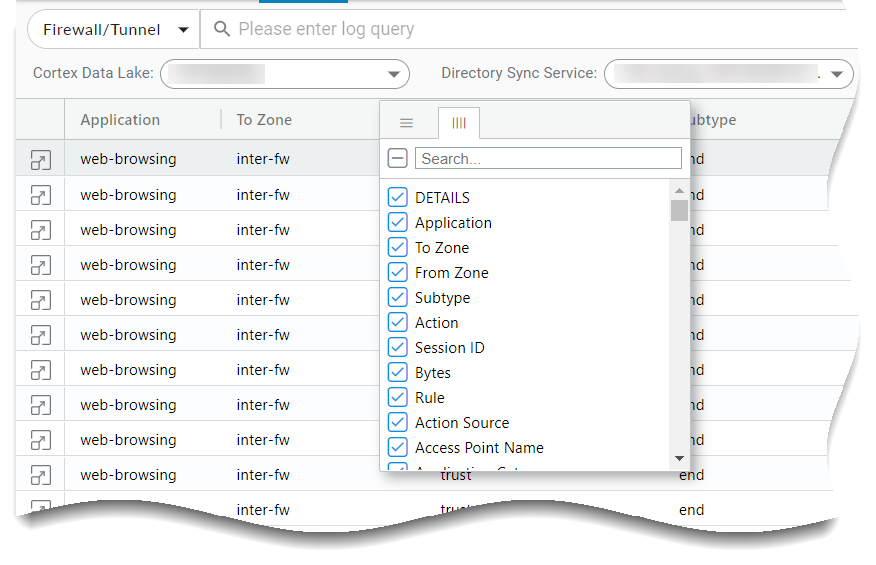
- Identify which fields appear in the log viewer table. Use the Search field to quickly find a specific field. Fields that are checked will appear in the log viewer table.
![]()
- Click and drag on any column header to reorder the table columns.
![]()
Save Preferences
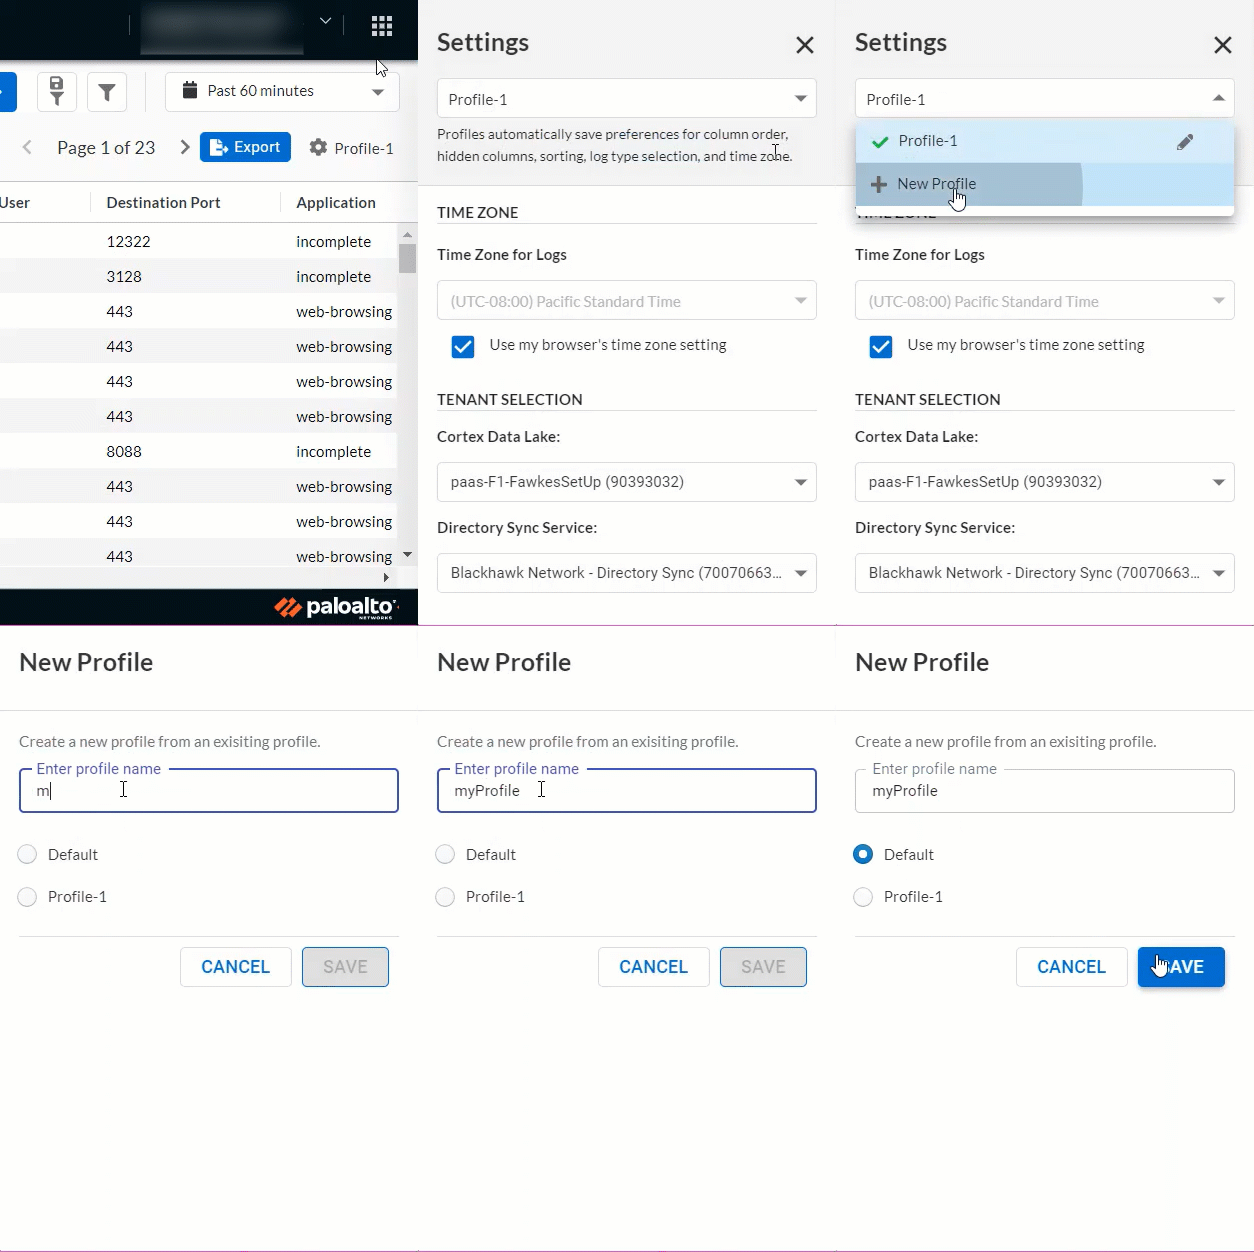
You can configure preferences, such as time zone and Cloud Identity Engine (CIE) instance, and save these preferences in named profiles. Profiles also save the columns you’ve chosen to display in the order that you have arranged them, and they retain any queries you’ve saved.- Select> + New Profile.
![]() Enter a profile name.Select an existing profile on which to base your new profile.Selecting Default begins your profile with the preferences that were set when you first installed the app.Save the profileAny preferences you change will automatically save to the currently selected profile.
Enter a profile name.Select an existing profile on which to base your new profile.Selecting Default begins your profile with the preferences that were set when you first installed the app.Save the profileAny preferences you change will automatically save to the currently selected profile.![]()
Export Log Records
Once you have retrieved log records, you can export them to a compressed CSV file in GZ format. No matter which time zone you selected, exported logs will always display UTC time.Exports are limited to a maximum of 1.5 million rows of data as long as it does not exceed 1 GB of total data. If the export exceeds 1 GB, try refining your query to return fewer than 1.5 million rows.Click Export to start exporting the log records. After a short period of time (which depends on how many records you are exporting), Export will turn into Download.![]() Click Download and the GZ file will appear in your downloads folder. Use file decompression software to extract the CSV file(s).The columns in the CSV file are organized under the field names you use in queries, not the column headers in the Explore UI. For example, the DESTINATION USER column in the UI appears as dest_user in the CSV file.
Click Download and the GZ file will appear in your downloads folder. Use file decompression software to extract the CSV file(s).The columns in the CSV file are organized under the field names you use in queries, not the column headers in the Explore UI. For example, the DESTINATION USER column in the UI appears as dest_user in the CSV file.View Log Details
It is possible for you to modify the log record summary table so that only some log fields are shown in it. If you want to see a log record in its entirety, click:![]()
![]() The Log Details window shows you the entire log record, with individual log fields placed into logical groupings. If the firewall generated other logs for the same session as the one you are viewing, you will see a list of those logs. Select one of the logs to view its details.
The Log Details window shows you the entire log record, with individual log fields placed into logical groupings. If the firewall generated other logs for the same session as the one you are viewing, you will see a list of those logs. Select one of the logs to view its details.![]()


