Enterprise DLP
Strata Cloud Manager
Table of Contents
Strata Cloud Manager
View the incident details for traffic that matches your Enterprise Data Loss Prevention (E-DLP) data
profiles on Strata Cloud Manager.
- Log in to Strata Cloud Manager.(Optional) Configure syslog forwarding for Enterprise DLP incidents.Select .Select a Scan Date and Region to filter the DLP incidents.Enterprise DLP Incidents are generated in the Region where the Public Cloud Server is located.For Prisma Access (Managed by Strata Cloud Manager) and NGFW (Managed by Strata Cloud Manager), Enterprise DLP automatically resolves to the closest Public Cloud Server to where the inspected traffic originated.When Palo Alto Networks introduces a new Public Cloud Server, Enterprise DLP automatically resolve to it if it’s closer to where the inspected traffic originated.This might mean that new DLP incidents generated after the release of a new Public Cloud Server are generated in a different Region.Review the Incidents and click the File name to review detailed information for a specific incident.You can Add New Filter to filter the DLP incidents by Action, Channel, Data Profile or Response Status to search for a specific incident you want to review.Review the Incident Details to review specific incident details.Make note of the Report ID for the DLP incident if you have not already done so. Use the Report ID to view additional Traffic log details regarding the DLP incident.
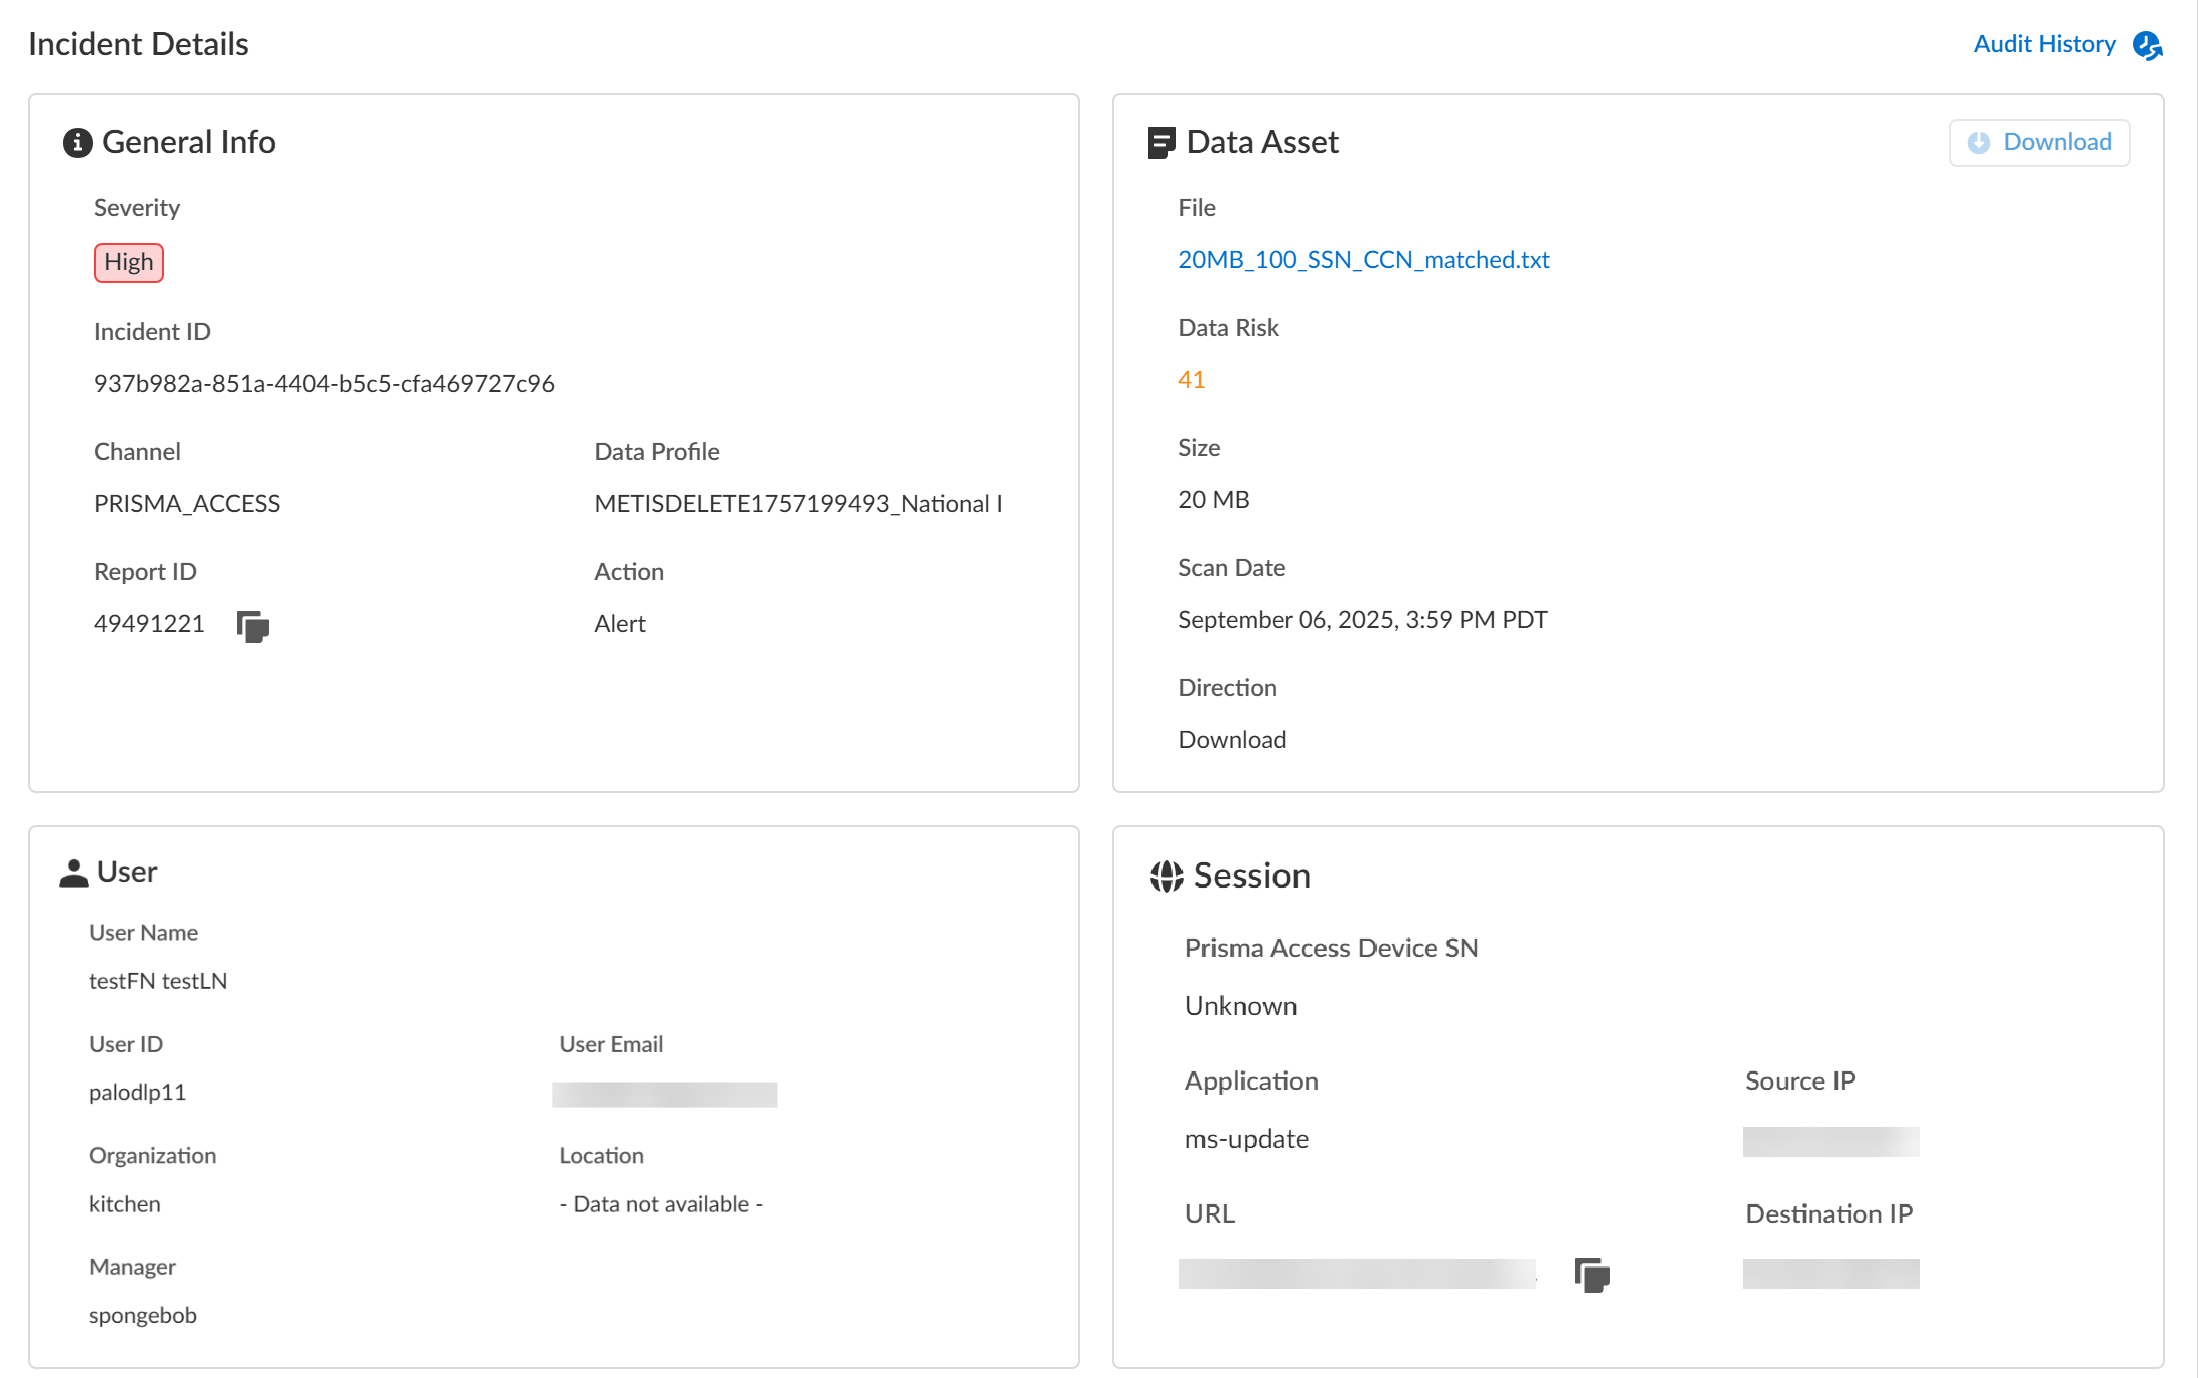
- General InfoThe General Info panel displays high-level information about the DLP incident.
- Severity—The incident severity configured in the DLP rule (Strata Cloud Manager) or the data filtering profile (Panorama).
- Incident ID—Unique ID for the DLP incident.
- Channel—The enforcement point that forwarded traffic to Enterprise DLP through which the incident occurred.
- Data Profile—Data profile that traffic matched against that generated the incident.
- Report ID—Unique ID used to view additional Traffic log details regarding the DLP incident.
- Action—The action Enterprise DLP took on the traffic that matched your DLP rule.
- Data
- File—Name of the file containing sensitive data that generated the incident. For non-file inspection, the filename is http-post-put.
- Data Risk—The data risk score associated with the incident. The data risk score provides quantifiable metrics to measure the overall data risk for your organization.
- Size—Size of the file or non-file traffic that generated the DLP incident.
- Scan Date—Date and time Enterprise DLP inspected the matched traffic and generated the DLP incident.
- Direction—Indicates whether the matched traffic was a Download or an Upload when the incident occurred.
- UserUser data requires integration with Cloud Identity Engine (CIE) to display. The User data displayed correspond to Palo Alto Networks Attributes that correlate to specific directory provider fields in CIE.
- User Name—Name of the user as configured in CIE that generated the DLP incident.Corresponding Palo Alto Networks Attribute is Name.
- User ID—ID of the user who generated the DLP incident.The User ID field does not require CIE integration. However, the corresponding Palo Alto Networks Attribute is User Principal Name.
- User Email—Email of the user who generated the DLP incident.Corresponding Palo Alto Networks Attribute is Mail.
- Organization—Organization the user who generated the DLP incident is associated with.Corresponding Palo Alto Networks Attribute is Department.
- Location—Location of the user who generated the DLP incident.Corresponding Palo Alto Networks Attribute is Location.
- Manager—Manager of the user who generated the DLP incident.Corresponding Palo Alto Networks Attribute is Manager.
- Session
- Prisma Access Device SN—Serial number of the Prisma Access tenant that blocked traffic or generated an alert.
- Source IP—Upload or download IP address of the app or user source.
- Destination IP—Target upload or download IP address of the app or user.
- Application—App-ID for the target app.
- URL—Fully Qualified Domain Name (FQDN) of the target app or user.
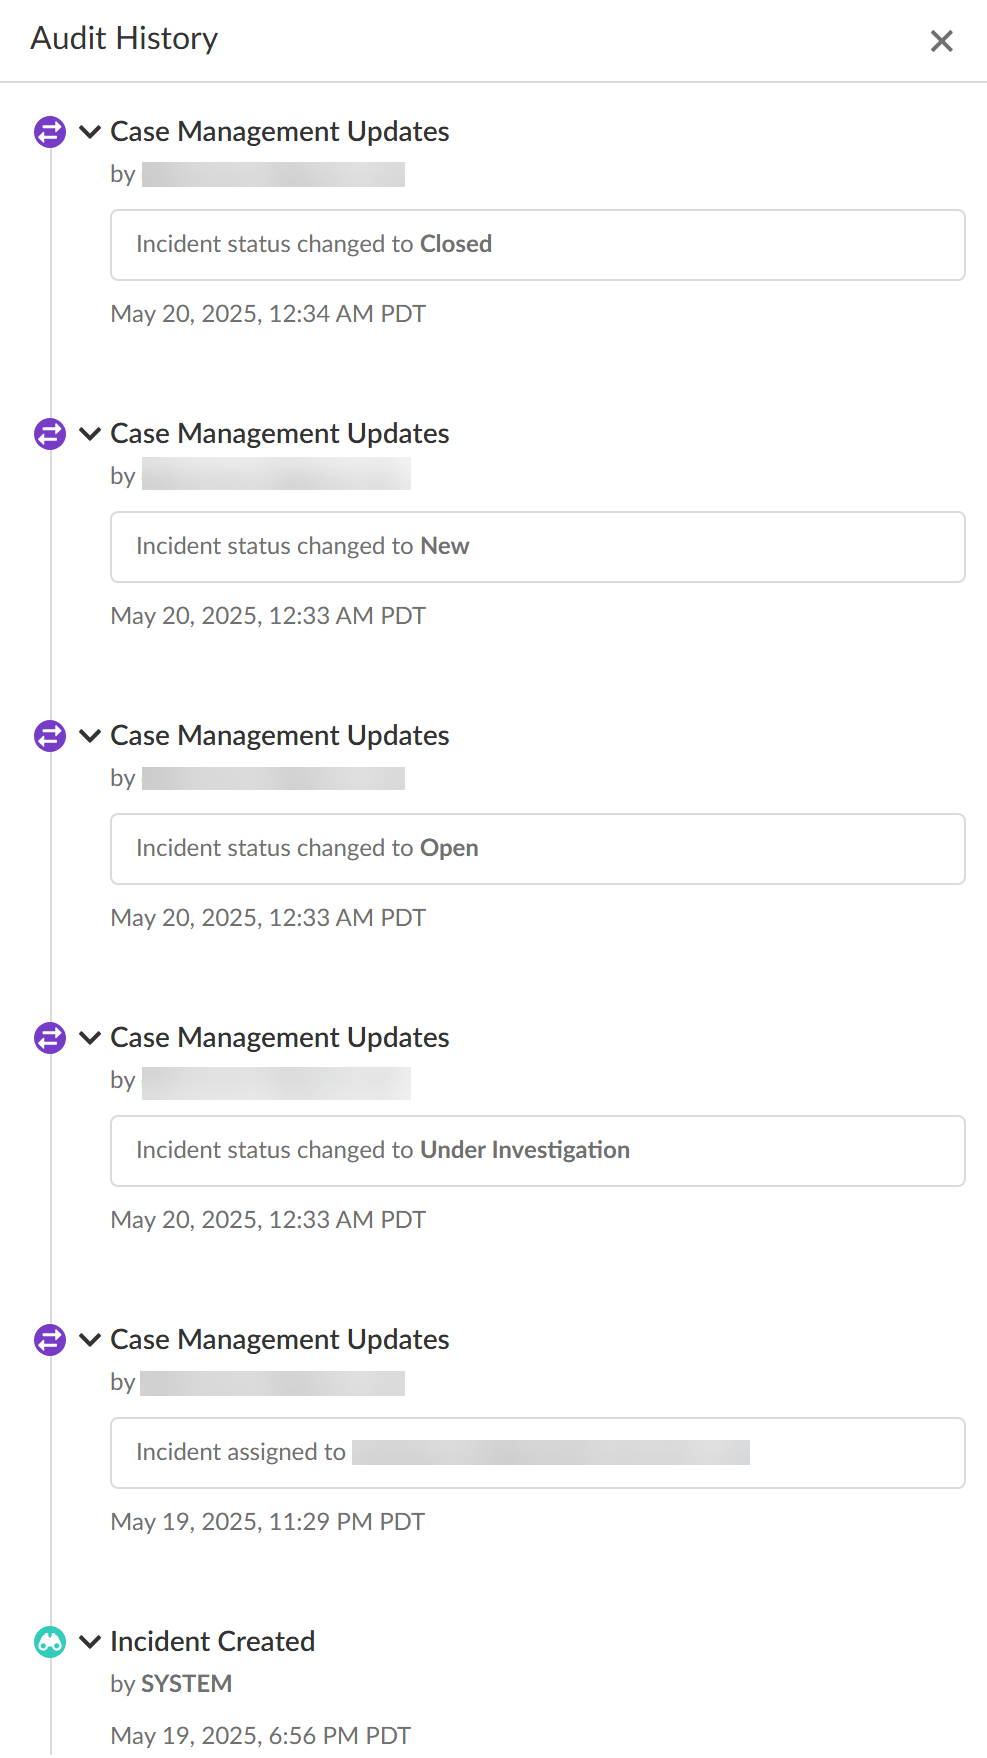
- Audit HistoryThe Audit History shows you the full Incident Case Management history for the specific DLP incident. It outlines every step of the case management process and the specific action taken by each user from when the incident case was assigned to when it was closed.
![]()
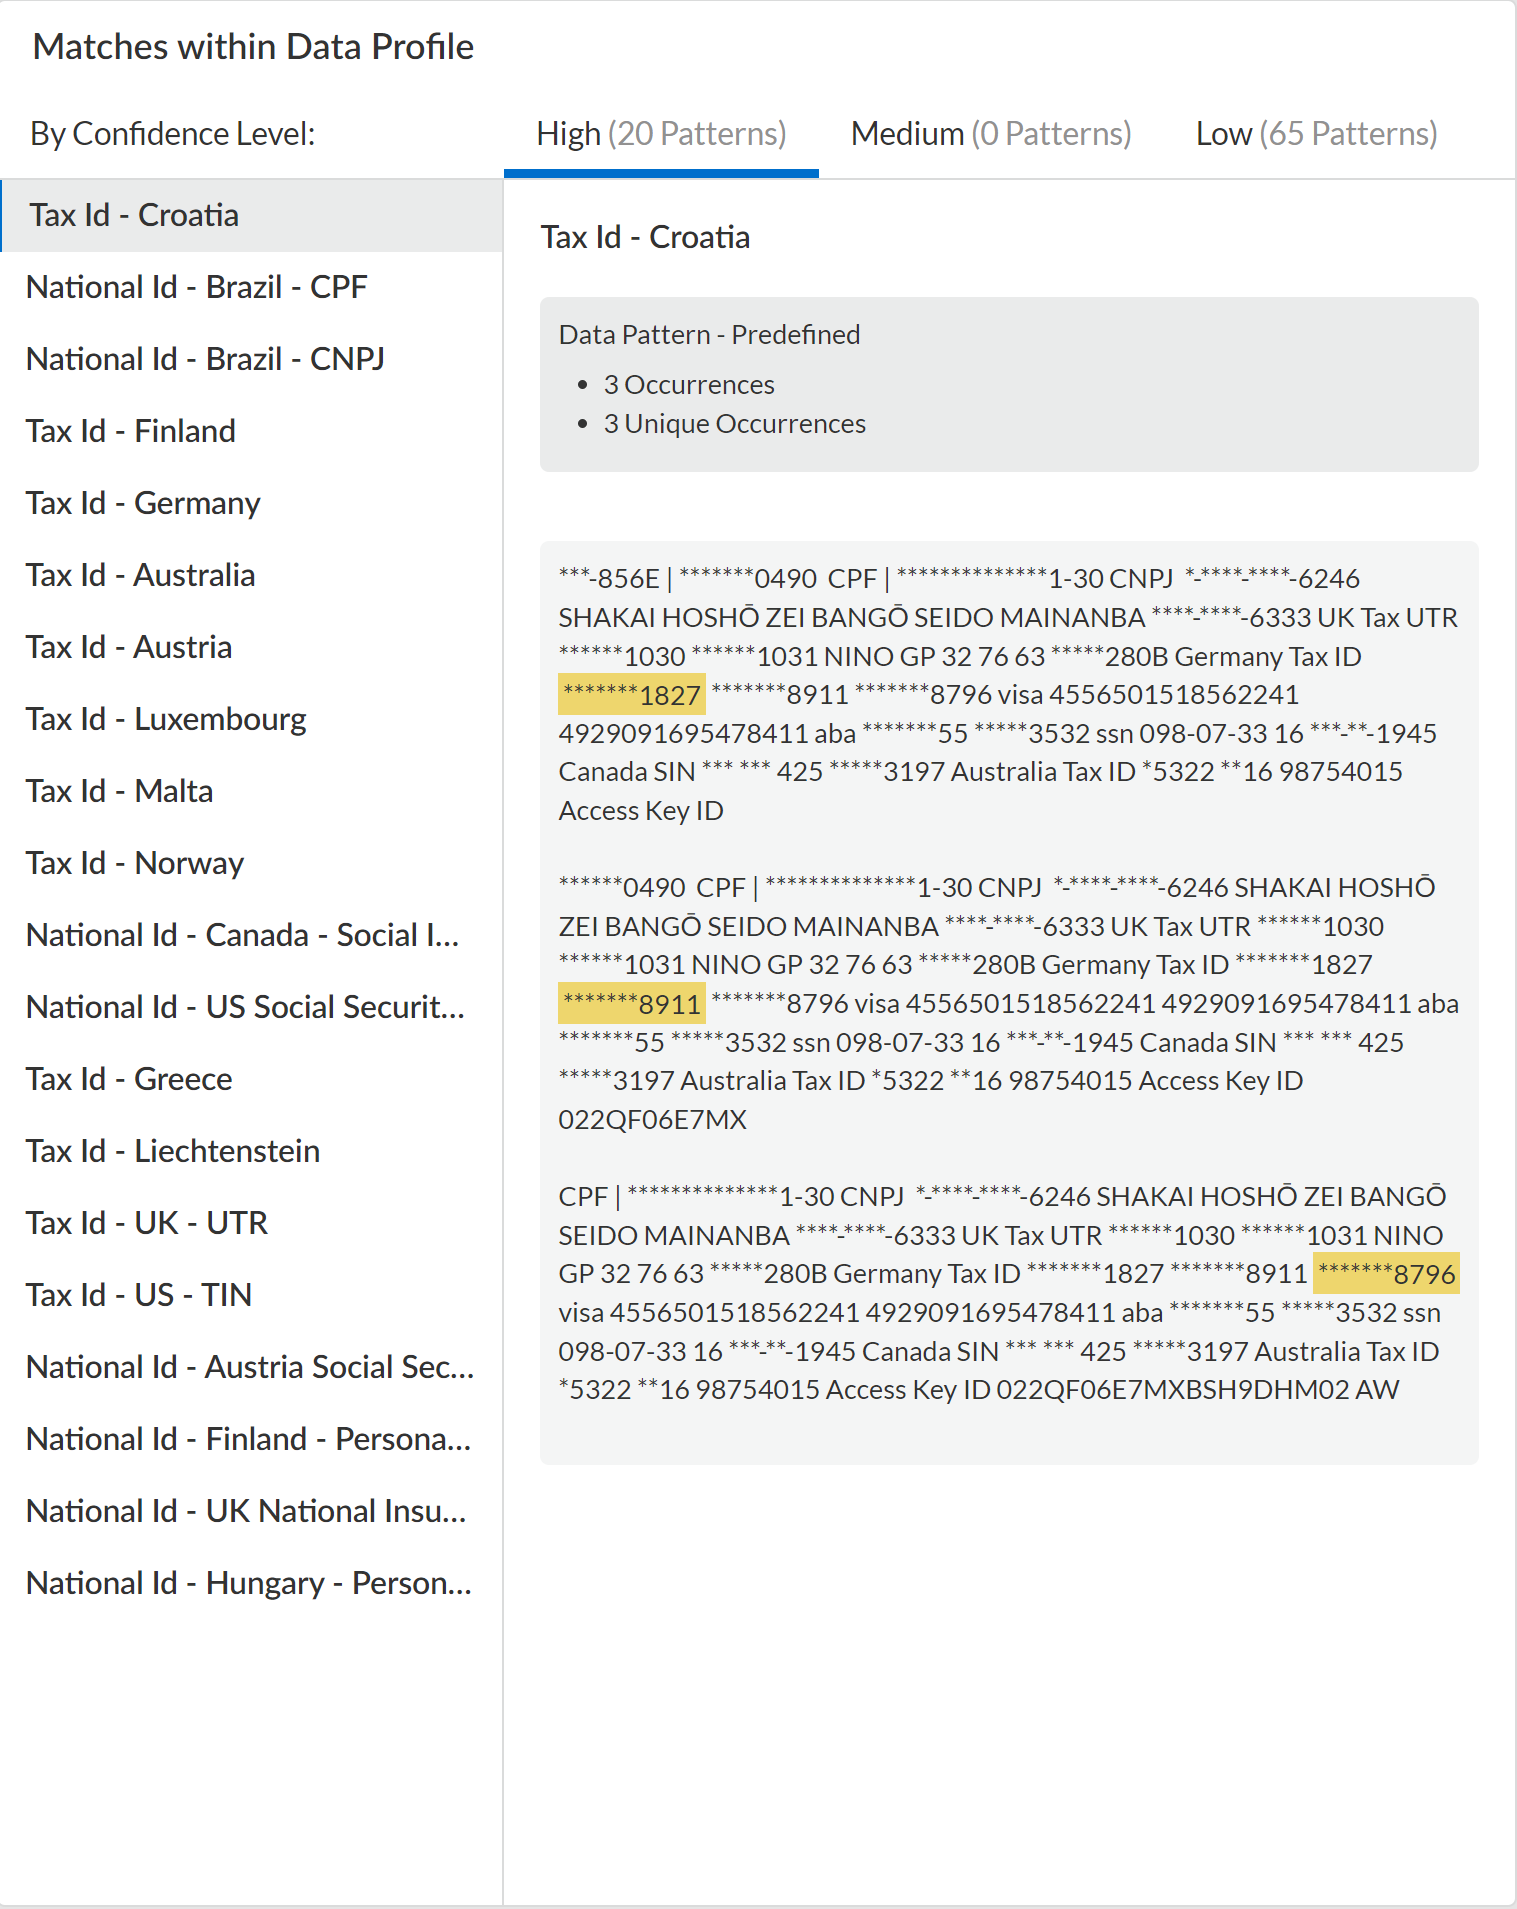
![]() Review the Matches within Data Profiles to review snippets of matching traffic and the data patterns that matched the traffic to better understand what sensitive data Enterprise DLP detected.For nested data profiles, Enterprise DLP displays the name of the nested data profile and not the specific data profile containing the match criteria that matched inspected traffic. For example, you create a DataProfile, with the nested profiles Profile1, Profile2, and Profile3. Enterprise DLP inspects traffic that matches Profile2 and blocks it. In this scenario, the Matches within Data Profile displays DataProfile.Additionally, you can filter the Matches within Data Profile for a nested data profile to display traffic matches against specific associated data profiles.
Review the Matches within Data Profiles to review snippets of matching traffic and the data patterns that matched the traffic to better understand what sensitive data Enterprise DLP detected.For nested data profiles, Enterprise DLP displays the name of the nested data profile and not the specific data profile containing the match criteria that matched inspected traffic. For example, you create a DataProfile, with the nested profiles Profile1, Profile2, and Profile3. Enterprise DLP inspects traffic that matches Profile2 and blocks it. In this scenario, the Matches within Data Profile displays DataProfile.Additionally, you can filter the Matches within Data Profile for a nested data profile to display traffic matches against specific associated data profiles.![]()
![]() Review the file log to learn about the traffic data for the DLP incident.
Review the file log to learn about the traffic data for the DLP incident.- Select .From the Firewall drop-down, select File.Filter to view the file log for the DLP incident using the Report ID.Report ID = <report-id>Review the file log to learn more about the traffic data for the DLP incident.Manage your Enterprise DLP incidents.