Download PDF
GlobalProtect
Report an Issue From the GlobalProtect App for Windows
Table of Contents
Expand All
|
Collapse All
GlobalProtect Docs
-
-
-
-
- 6.3
- 6.2
- 6.1
- 6.0
-
- 6.3
- 6.2
- 6.1
- 6.0
Report an Issue From the GlobalProtect App for Windows
| Where Can I Use This? | What Do I Need? |
|---|---|
|
|
When you experience unusual behavior such as poor network performance or a connection is not
established with the portal and gateway, you can report an issue directly to Strata
Logging Service to which your administrator can access. You no longer need to
manually collect and send the GlobalProtect app logs through email or to store them
on a cloud drive.
To display
the Report an Issue option on the GlobalProtect
app, your administrator must enable the GlobalProtect app
log collection for troubleshooting on the GlobalProtect portal.
- Connect to the GlobalProtect portal or gateway.
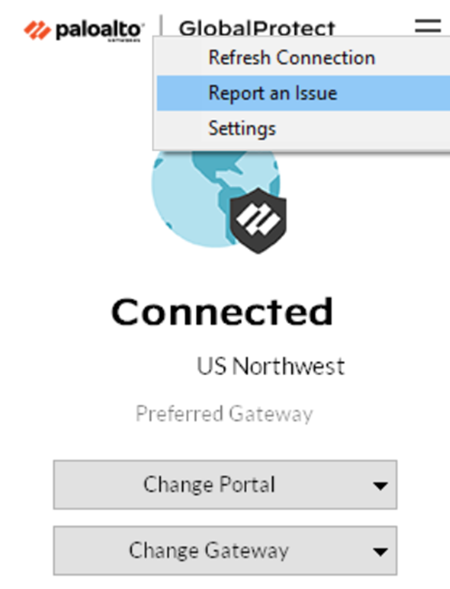
- Launch the GlobalProtect app by clicking the system tray icon. The status panel opens.(Optional) If you are logging in to the GlobalProtect app for the first time, enter the FQDN or IP address of the GlobalProtect portal, and then click Connect.(Optional) If multiple portals are saved on your app, select a portal from the Portal drop-down. By default, the most recently connected portal is pre-selected from the Portal drop-down.(Optional) By default, you are automatically connected to the Best Available gateway, based on the configuration that the administrator defines and the response times of the available gateways. To connect to a different gateway, click the gateway drop-down.Open the GlobalProtect app.Click the GlobalProtect system tray icon to launch the app interface.Report an issue from the GlobalProtect app from your endpoint.After you launch the app, click the hamburger menu on the status panel to report an issue to your administrator.
- Select Report an Issue.
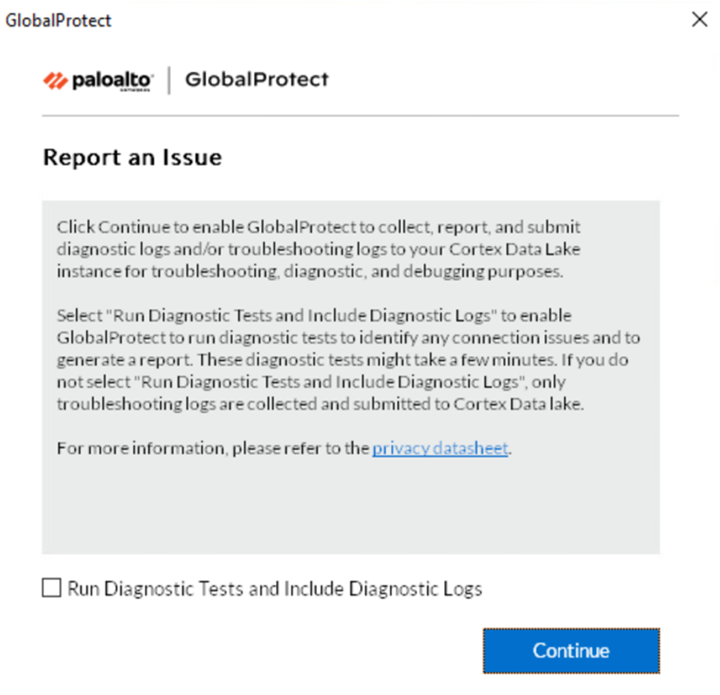
![]() Enable the GlobalProtect app to run diagnostic tests and to include diagnostic logs. Both diagnostic and troubleshooting logs are collected and sent to Strata Logging Service as a compact troubleshooting report.After the diagnostic tests are successfully completed, the GlobalProtect debug log files are uploaded to Strata Logging Service from your endpoint.If you do not enable the app to run diagnostic tests and to include diagnostic logs, only troubleshooting logs are collected and sent to Strata Logging Service as a compact troubleshooting report. The GlobalProtect app checks for the report files (pan_gp.trb.log or pan_gp_trbl.log) that are automatically generated in .json format. A notification message appears if no issues were found in the troubleshooting logs. Click Retry to check if the pan_gp.trb*.log files exist.Select the Run Diagnostic Tests and Include Diagnostic Logs check box.Click Continue to allow the app to create a troubleshooting log and to send the report to your administrator’s Strata Logging Service instance.The results of the end-to-end diagnostic tests are stored in the pan_gp_diag.log file in .json format and sent to your administrator’s Strata Logging Service instance along with the pan_gp.trb*.log files. The GlobalProtect app can run diagnostic tests with a tunnel or without a tunnel. For example, you might want to enter your GlobalProtect login credentials prior to the app connecting and running diagnostic tests through the tunnel.
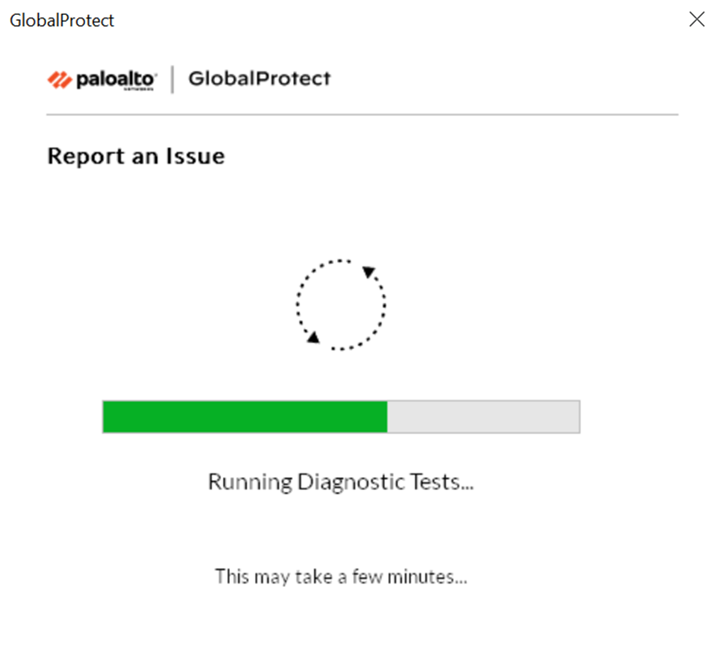
Enable the GlobalProtect app to run diagnostic tests and to include diagnostic logs. Both diagnostic and troubleshooting logs are collected and sent to Strata Logging Service as a compact troubleshooting report.After the diagnostic tests are successfully completed, the GlobalProtect debug log files are uploaded to Strata Logging Service from your endpoint.If you do not enable the app to run diagnostic tests and to include diagnostic logs, only troubleshooting logs are collected and sent to Strata Logging Service as a compact troubleshooting report. The GlobalProtect app checks for the report files (pan_gp.trb.log or pan_gp_trbl.log) that are automatically generated in .json format. A notification message appears if no issues were found in the troubleshooting logs. Click Retry to check if the pan_gp.trb*.log files exist.Select the Run Diagnostic Tests and Include Diagnostic Logs check box.Click Continue to allow the app to create a troubleshooting log and to send the report to your administrator’s Strata Logging Service instance.The results of the end-to-end diagnostic tests are stored in the pan_gp_diag.log file in .json format and sent to your administrator’s Strata Logging Service instance along with the pan_gp.trb*.log files. The GlobalProtect app can run diagnostic tests with a tunnel or without a tunnel. For example, you might want to enter your GlobalProtect login credentials prior to the app connecting and running diagnostic tests through the tunnel.![]() A message pops-up, confirming that the app is running diagnostic tests only if you selected the Run Diagnostic Tests and Include Diagnostic Logs check box.
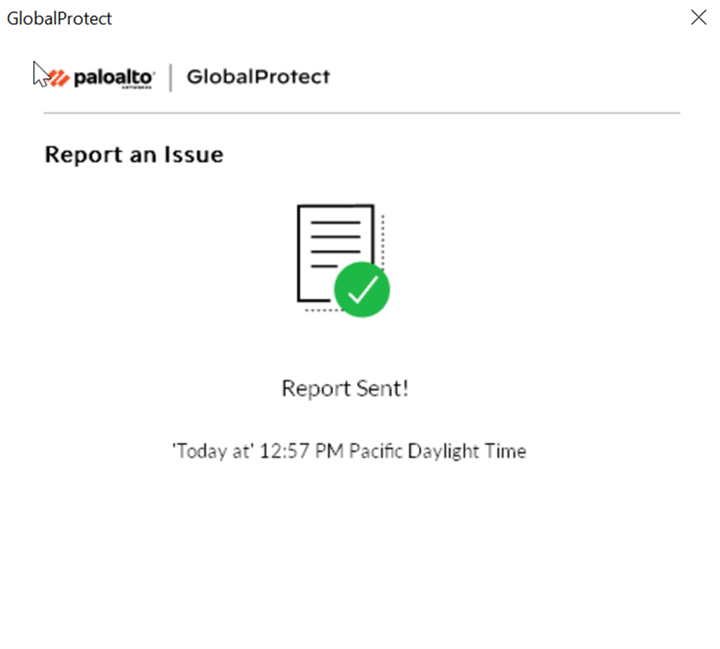
A message pops-up, confirming that the app is running diagnostic tests only if you selected the Run Diagnostic Tests and Include Diagnostic Logs check box.![]() Click Close to confirm that the app successfully sent the report to Strata Logging Service. This confirmation message displays the date and time when the report was processed and sent.
Click Close to confirm that the app successfully sent the report to Strata Logging Service. This confirmation message displays the date and time when the report was processed and sent.![]()


