SD-WAN
Monitor App and Link Performance
Table of Contents
Expand All
|
Collapse All
SD-WAN Docs
-
-
-
-
- 3.4
- 3.3
- 3.2
- 3.1
- 3.0
- 2.2
- 2.1
- 2.0
- 1.0
-
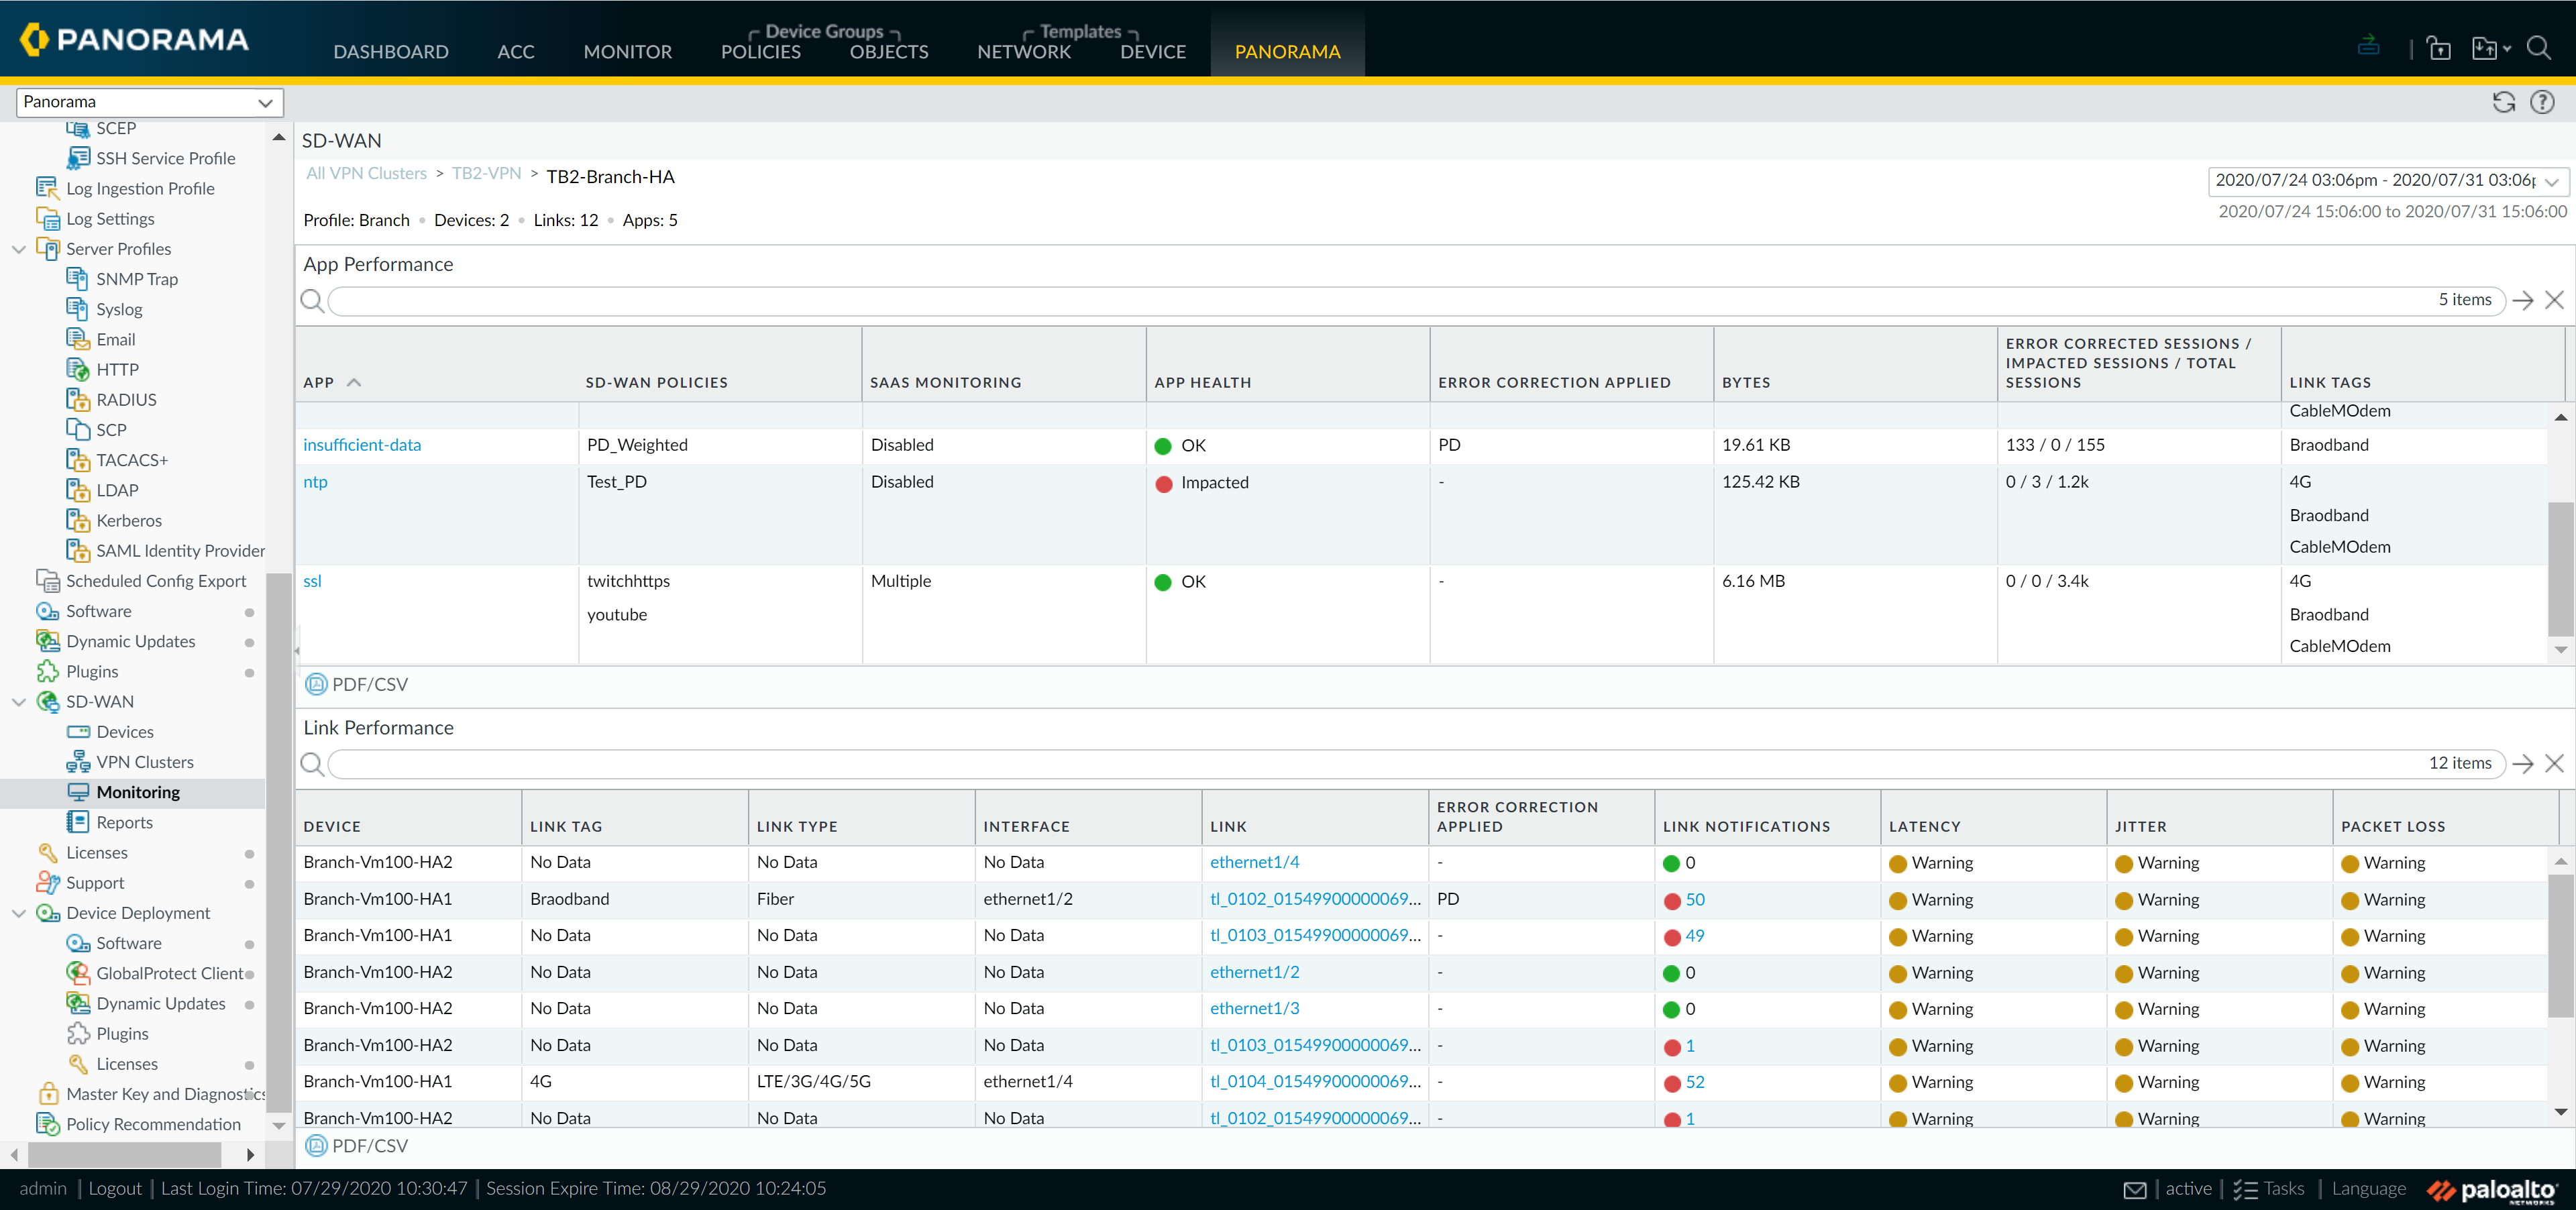
Monitor App and Link Performance
View a detailed, aggregated summary of all the application
and link health data for a specific SD-WAN site or Prisma Access
Hub-Spoke deployment. This allows you view which applications paths
are experiencing degraded health. For your applications, you can
view app health for each application, whether error correction was applied
for impacted applications, and the number of error corrected sessions
and impacted sessions out of the total number of sessions within
the specified timeframe. Click on an App to
monitor traffic characteristics for the selected application.
For your configured links, you can view whether error correction
was applied for an impacted link, the number of notifications that
were generated due to link health degradation, as well as the health
status for latency, jitter, and packet loss for each link configured
for the site or Prisma Access Hub-Spoke deployment.

Field | Description |
|---|---|
|
Prisma Access Onboarding (Prisma Access Hub-Spoke deployment
only)
| |
|
Interface
|
The physical, sub-interface, or aggregate ethernet interface for
which you have enabled SD-WAN functionality for the Prisma
Access deployment.
|
|
Tenant
|
The Prisma Access deployment tenant leveraging SD-WAN.
|
|
Region
|
Location where the Prisma Access deployment is located.
|
|
IPSec Termination Node
|
The IPSec Termination Node associated with the remote network
secured by the Prisma Access deployment. Up to four (4) IPSec
Termination Nodes may be displayed for a Single Prisma Access
deployment.
|
|
Link Tag
|
Link tag configured to identify the Prisma Access hub when
applications and service use this link during SD-WAN traffic
distribution and failover.
|
|
BGP
|
The BGP status. Displays Enable if
enabled and Disable if
disabled.
|
|
Advertise Default Route
| Displays if the Prisma Access deployments advertises a default route for the remote network using eBGP. Displays Enable if enabled and Disable if disabled. |
|
Summarize Mobile User Routes Before Advertising
|
Displays if Prisma Access summarizes mobile user IP subnets
advertisements to reduce the number of mobile user IP
advertisements displayed over BGP to customer premises equipment
(CPE). Displays Enable if enabled
and Disable if disabled.
|
|
Don’t Advertise Prisma Access Routes
|
Displays if Prisma Access prevents the BGP peer from forwarding
routes into your organization’s network. Displays
Enable if enabled and
Disable if disabled.
|
|
Tunnel Monitor IP
|
The IP address used to monitor the tunnel between the Prisma
Access hub and branch. The IP address is automatically generated
based on the Infrastructure Subnet you configured your Prisma
Access deployment.
|
|
Peer AS Number
|
The Infrastructure BGP AS Number when you set up your Prisma
Access deployment.
|
|
Service IP
|
Service IP address for the IPSec Termination Node.
|
|
Comment
|
Descriptive comment added when onboarding a Prisma Access
deployment.
|
|
App Performance
| |
|
App
|
Name of the application specified by an SD-WAN policy rule.
|
|
SD-WAN Policies
|
Name of the SD-WAN policy rule(s) that matched the app traffic
matched. Multiple SD-WAN policy rules may be listed if the app
traffic matched multiple SD-WAN policies.
|
|
SaaS Monitoring
|
Displays whether the app is a SaaS application configured in a
SaaS Quality profile that is associated with one or more SD-WAN
policy rules.
|
|
App Health
|
Indicates the app health based on available links to swap to. Can
be Impacted,
Warning, or
OK.
|
|
Error Correction Applied
|
Specifies the type of forward error correction applied. If empty
(blank), then no error correction was applied.
|
|
Bytes
|
Total byte count of transfered data for the application within
the specified time frame.
|
|
Error Correction Sessions/Impacted Sessions/Total Sessions
|
Number of error corrected sessions and impacted sessions out of
the total number of sessions within the specified time frame. If
the application is impacted, this helps indicate how extensive
the issue is.
|
|
Link Tags
|
Name of the link tag(s) identifying the physical link the app
used during traffic distribution and failover.
|
|
Link Performance
| |
|
Device
|
Name of the SD-WAN firewall containing the interface that
processed the link traffic.
|
|
Link Tag
|
Name of the link tag identifying the physical link the app used
during traffic distribution.
|
|
Link Type
|
The physical link type.
|
|
Interface
|
Ethernet interface for the physical link.
|
|
Link
|
Name of the link.
|
|
Max Upload/Download Speed
|
Maximum upload and download speed of a physical or tunnel
interface for the selected site in a VPN cluster.
|
|
Error Correction Applied
|
Specifies the type of forward error correction applied. If empty
(blank), then no error correction was applied.
|
|
Link Notifications
| When Impacted, click to view the error message description for the degraded health status. |
|
Latency
|
Displays the latency health status of the tunnel. Can be
Impacted,
Warning, or
OK.
|
|
Jitter
|
Displays the jitter health status of the tunnel. Can be
Impacted,
Warning, or
OK.
|
|
Packet Loss
|
Displays the packet loss health status of the tunnel. Can be
Impacted,
Warning, or
OK.
|
