Prisma SD-WAN
Assign Chatbot to a Channel/Team
Table of Contents
Expand All
|
Collapse All
Prisma SD-WAN Docs
-
-
- Prisma SD-WAN Controller
-
- CloudBlade Integrations
- CloudBlades Integration with Prisma Access
-
-
-
-
- 6.5
- 6.4
- 6.3
- 6.1
- 5.6
- Prisma SD-WAN Controller
- Prisma SD-WAN On-Premises Controller
- Prisma SD-WAN CloudBlades
- Prisma Access CloudBlade Cloud Managed
- Prisma Access CloudBlade Panorama Managed
Assign Chatbot to a Channel/Team
Learn to assign the Chatbot to a Channel/Team and view the chatbot supported
commands.
| Where Can I Use This? | What Do I Need? |
|---|---|
|
|
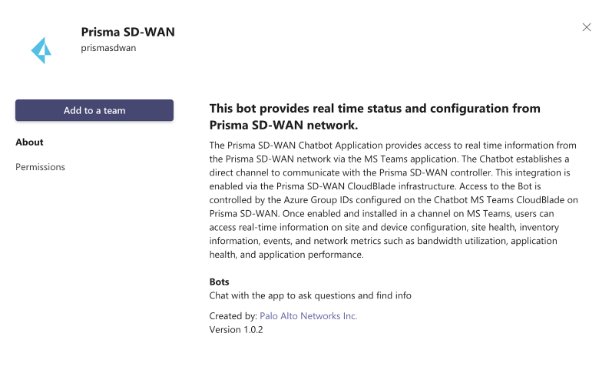
- Go to Microsoft Teams App store and search for Prisma SD-WAN Chatbot.You must install the bot specific to the region your tenant is deployed. The Microsoft App Store will contain a Chatbot for each Prisma SD-WAN Controller region; Elcapitan, Sugarloaf, and Hood. You can determine the region your tenant is hosted from the controller URL.
![]() Click on the Prisma SD-WAN Chatbot-MS Team tile, select Add to a Team from the options.
Click on the Prisma SD-WAN Chatbot-MS Team tile, select Add to a Team from the options.![]() Select the team(s) where you want to set up the bot from the drop-down.The teams where you can configure the Chatbot are listed on the left navigation pane.You can now start a chat conversation with the Chatbot supported commands.
Select the team(s) where you want to set up the bot from the drop-down.The teams where you can configure the Chatbot are listed on the left navigation pane.You can now start a chat conversation with the Chatbot supported commands.Chatbot Supported Commands
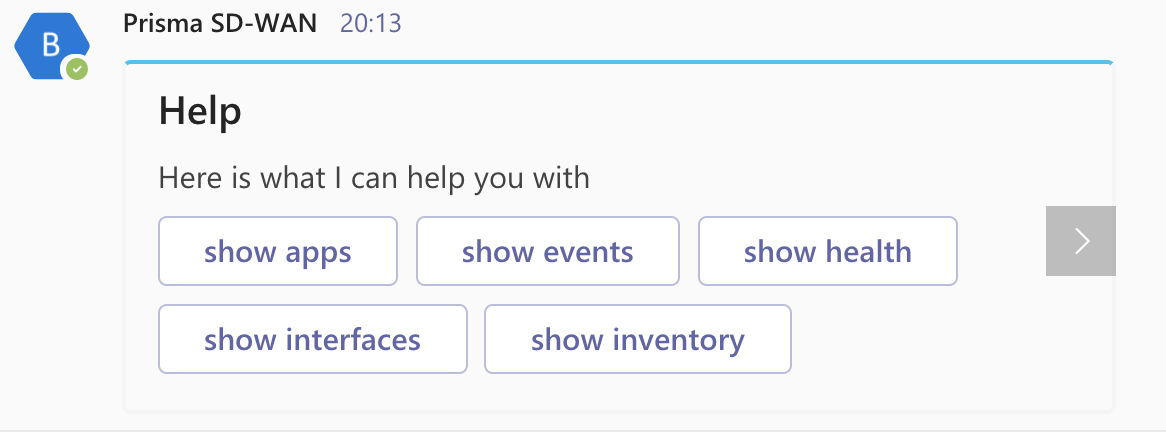
You can start a session by either typing Help or directly entering the command. The format of the command must include @Prisma SD-WAN Chatbot <command>. For example:@Prisma SD-WAN Chatbot show sitesYou can continue the conversation in the same window OR click New Conversation to start a new chat session. When the response for a command exceeds the supported size, the bot chunks the response. The bot will retrieve a maximum of 500 records for any category in the initial release. You will require to type at least one of the options. If the site names have a space, enter the site name in double quotes. The commands, supported options, and their descriptions are listed below:Commands Command Descriptions help help Lists all the supported commands. <command> help Displays the command syntax acceptable by the bot with all the options mentioned in the command. ![]()
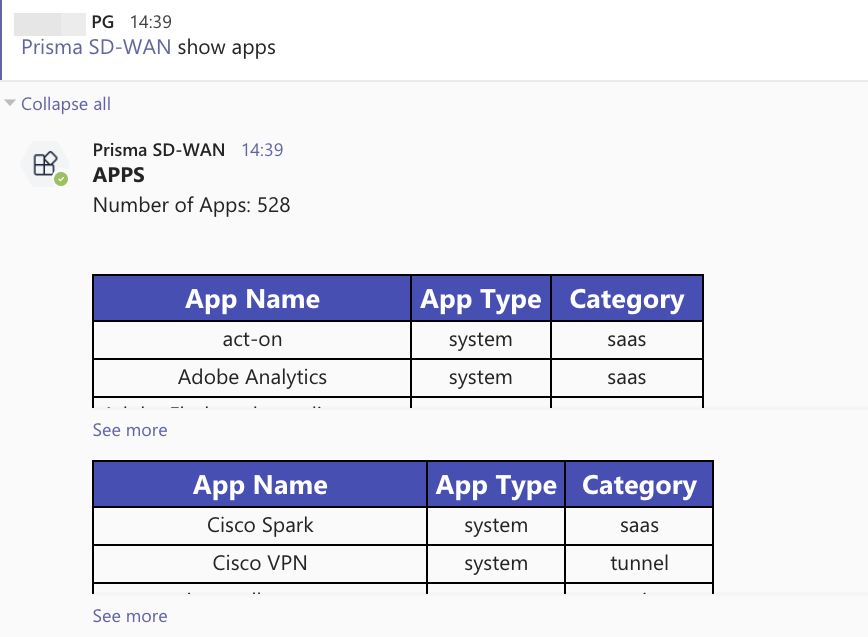
show apps show apps Lists all apps defined on the system. ![]()
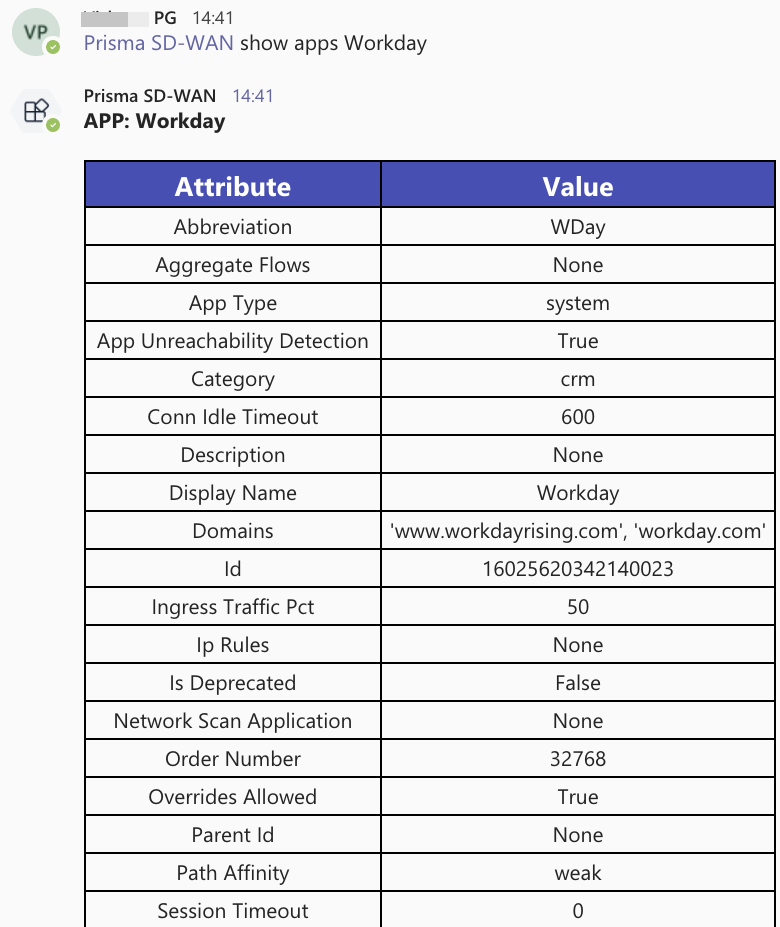
show apps <appname> Lists all the application-specific attributes for the application app name. ![]()
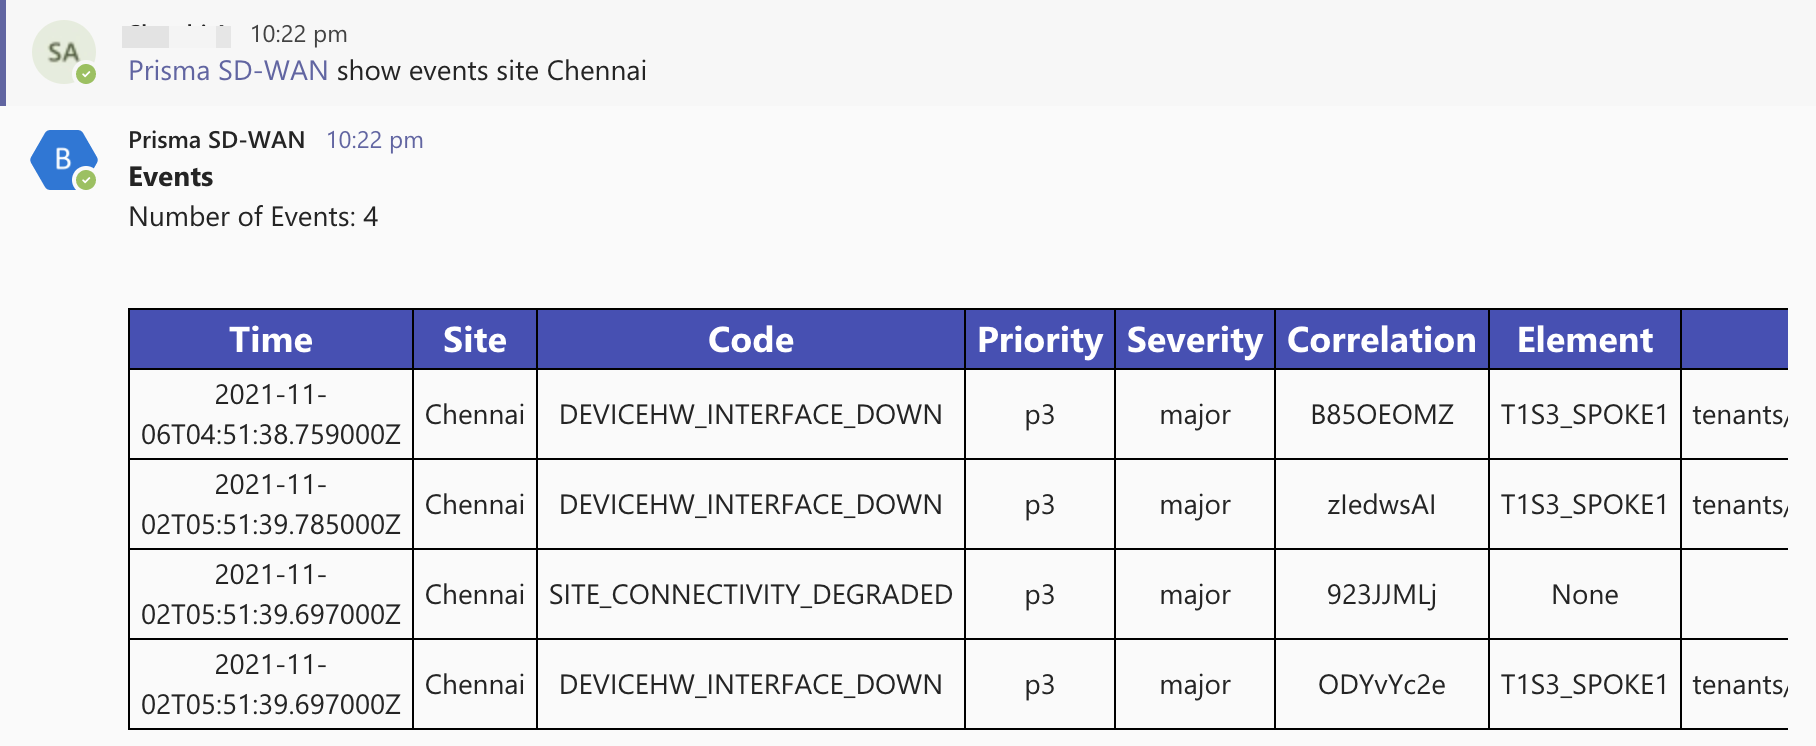
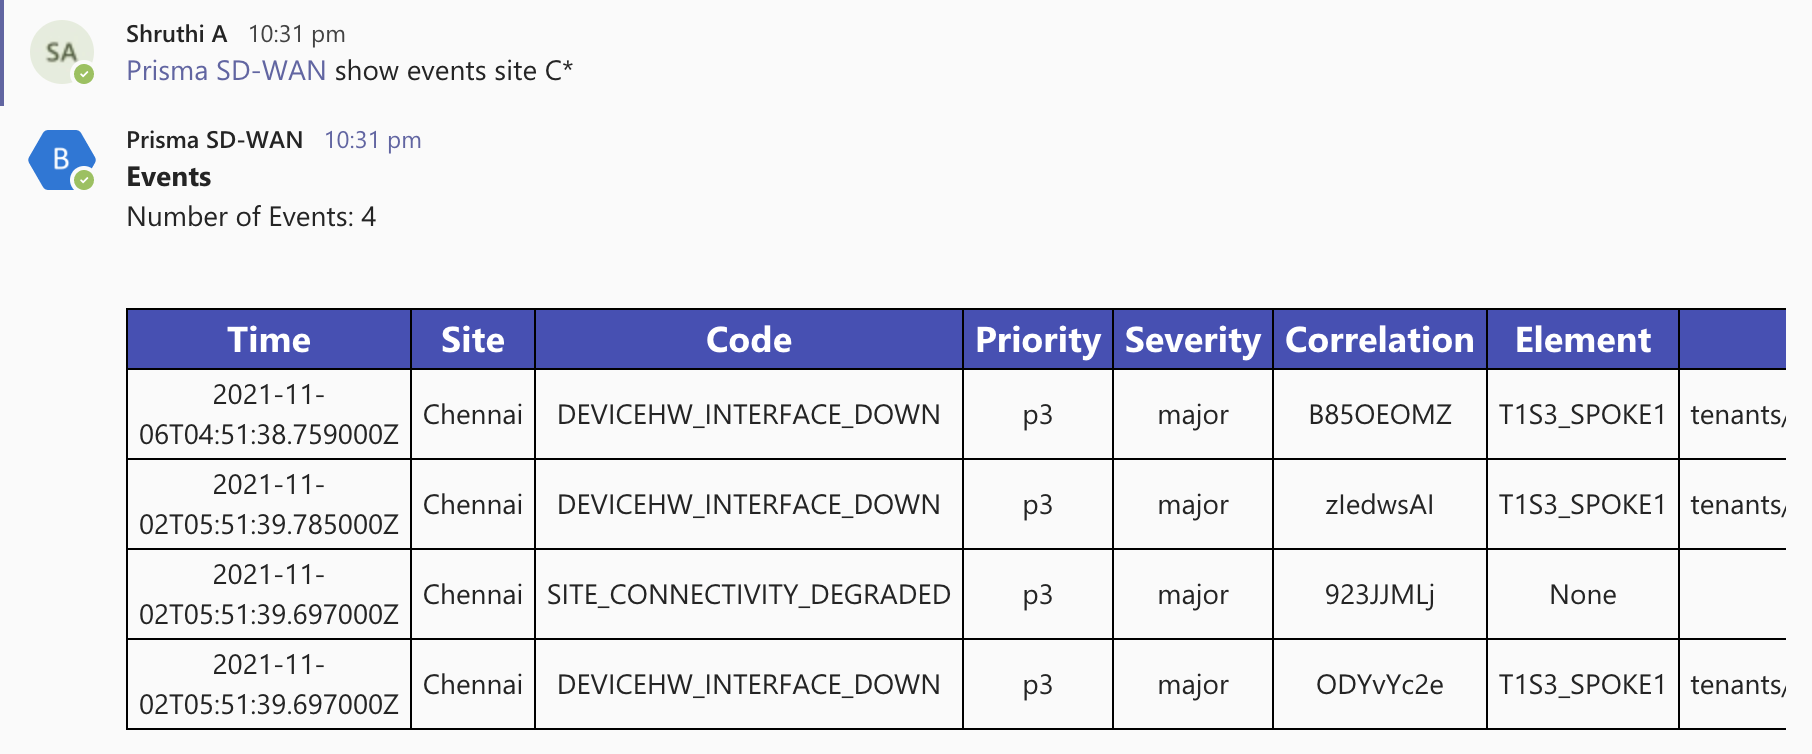
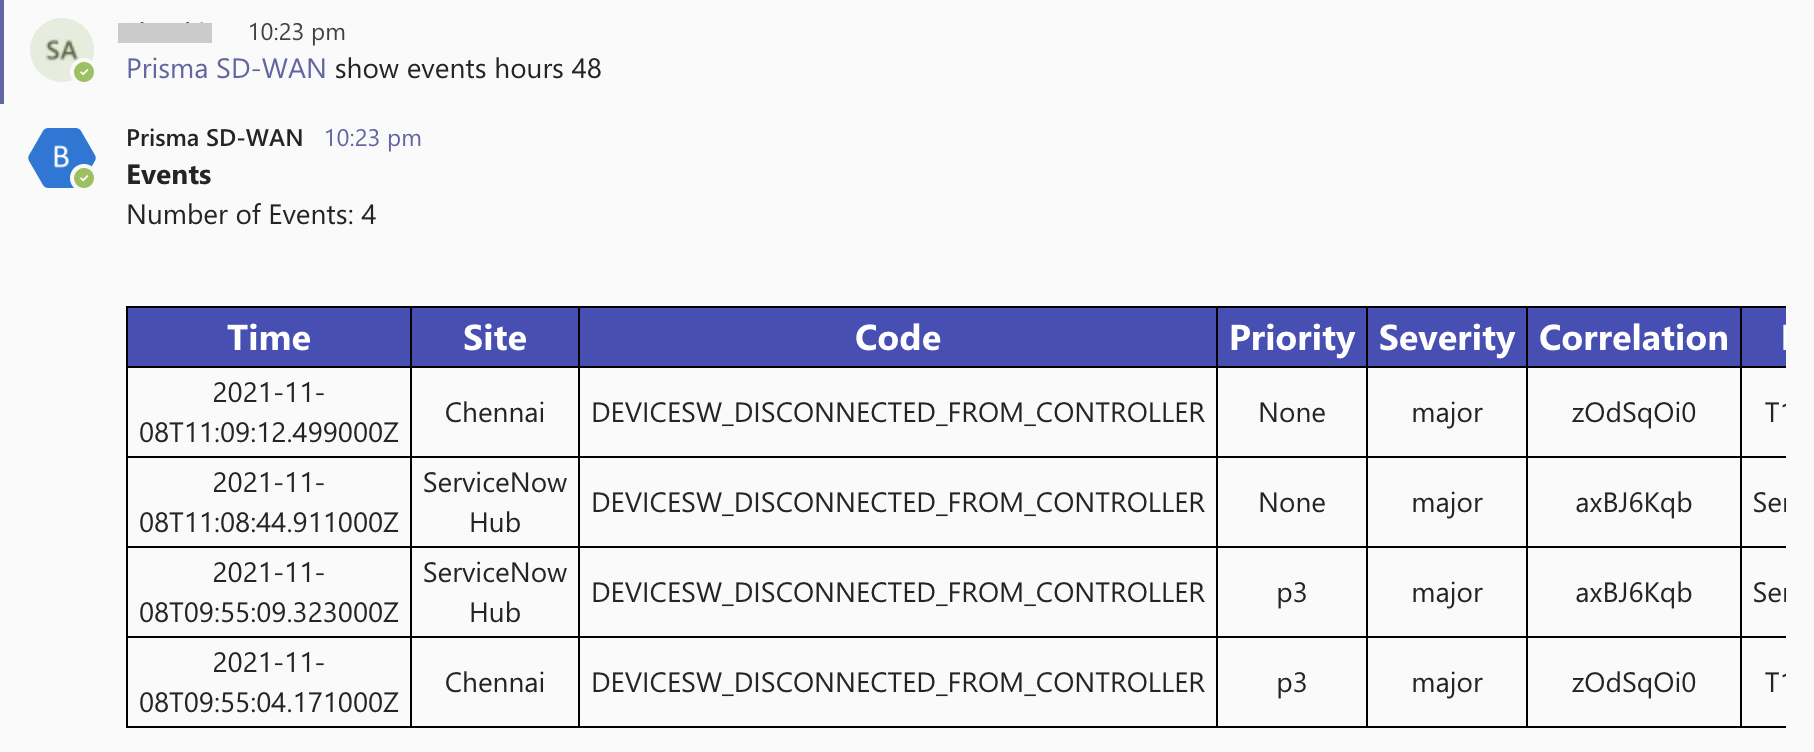
show events show events site <sitename> Filters the list of events for a particular site. ![]()
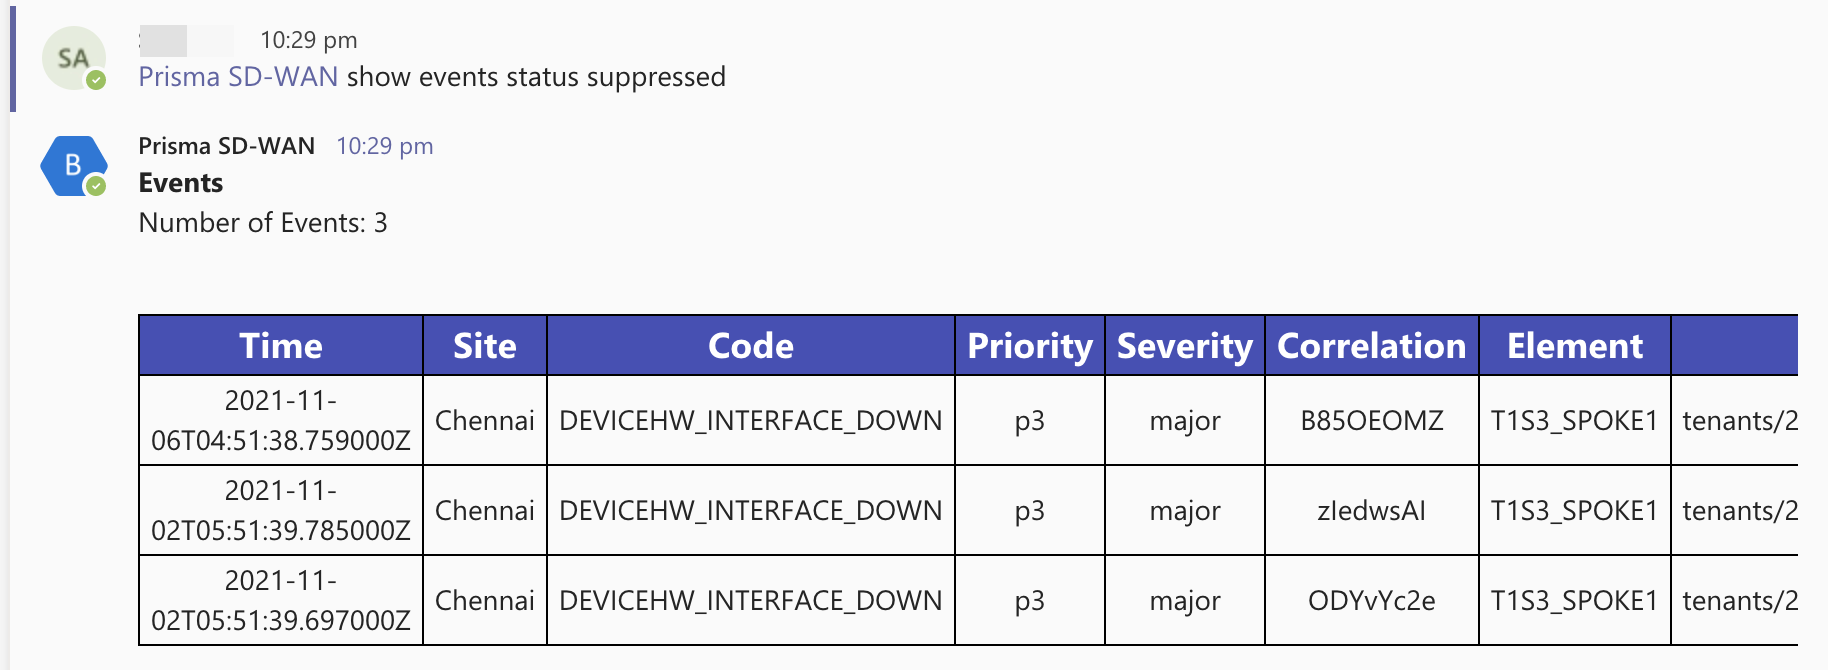
show events <status><suppressed|resolved|open|acknowledged> Filters the output to display the status of the events. ![]()
show events site <sitename> priority <priority> Filters the events for a site based on the event priority. ![]()
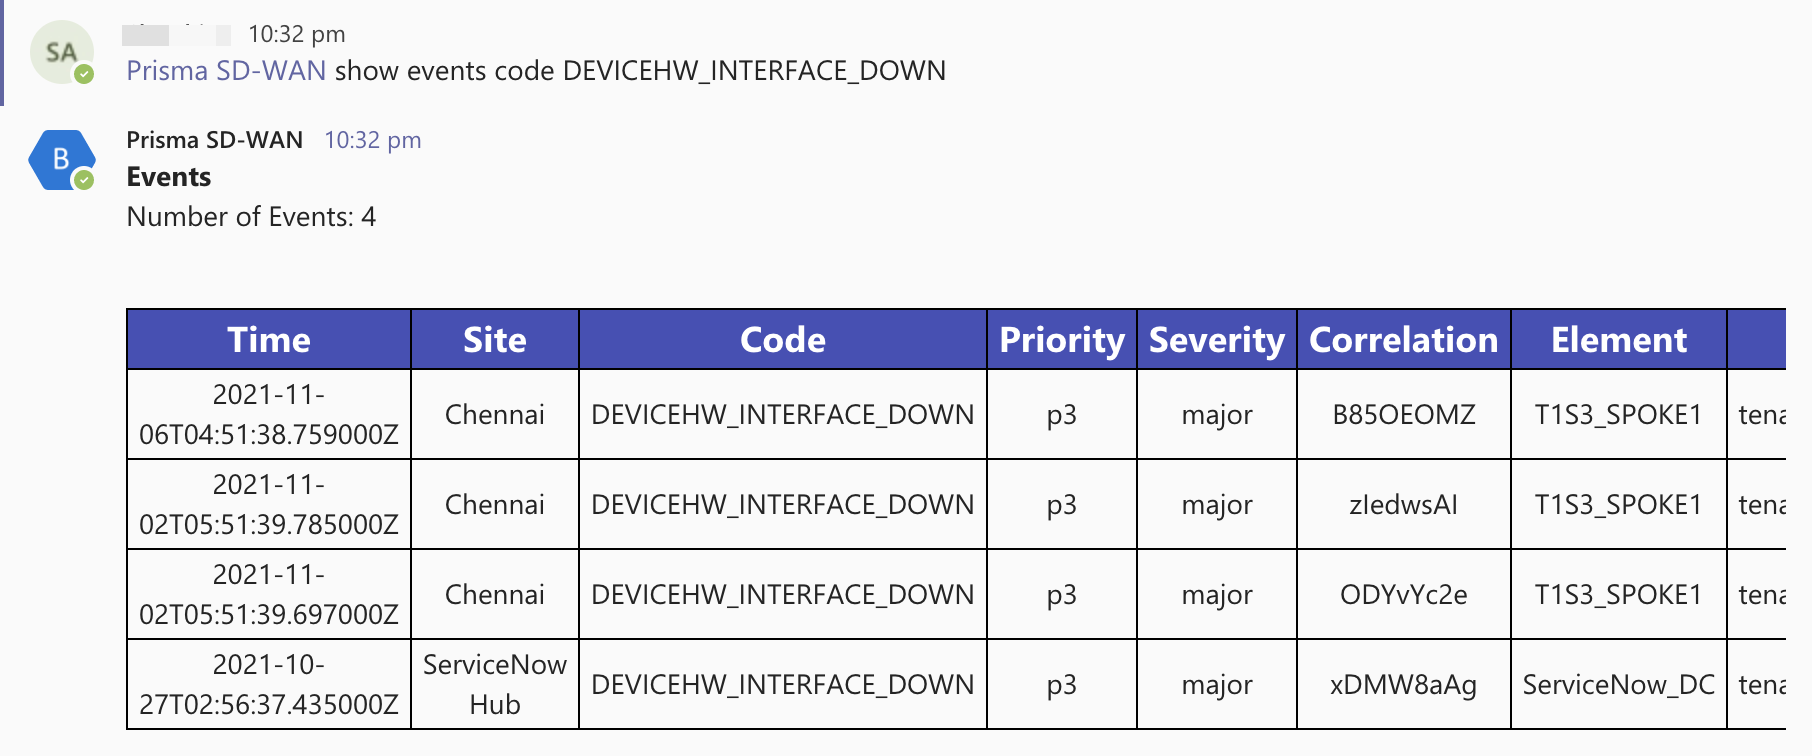
show events code <eventcodes> Filters the events for a particular event code. ![]()
show events correlation <correlationID> Filters the events for a particular correlation ID. ![]()
show events hours <numhours> Filters the events for a particular time frame. ![]()
show health show health <sitename> Displays the following attributes depicting the health of the site:- ION device connectivity status
- critical and significant events
- number of active events count by severity
- physical link status
- VPN health (Prisma SD-WAN and 3rdparty)
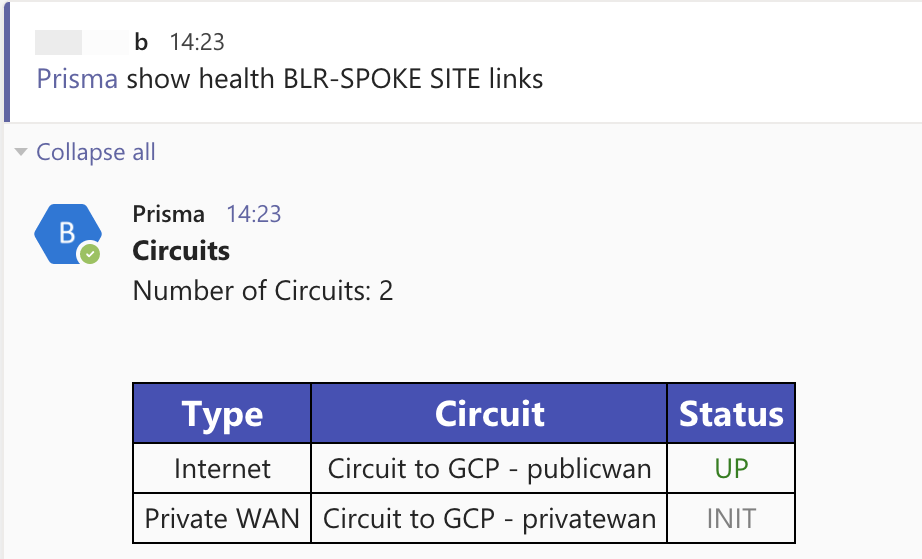
show health <sitename> links Filters the output to only display physical link health. ![]()
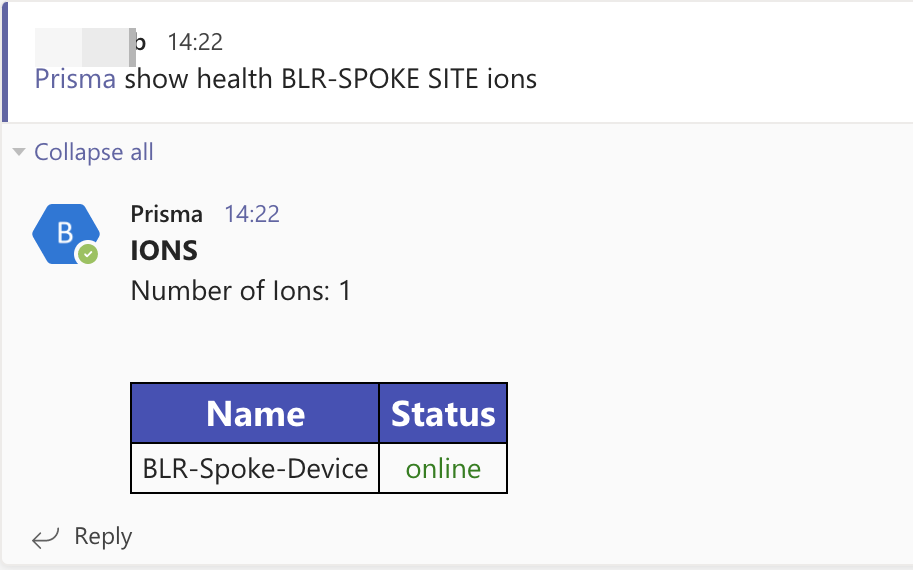
show health <sitename> ions Filters the output to only display device health. ![]()
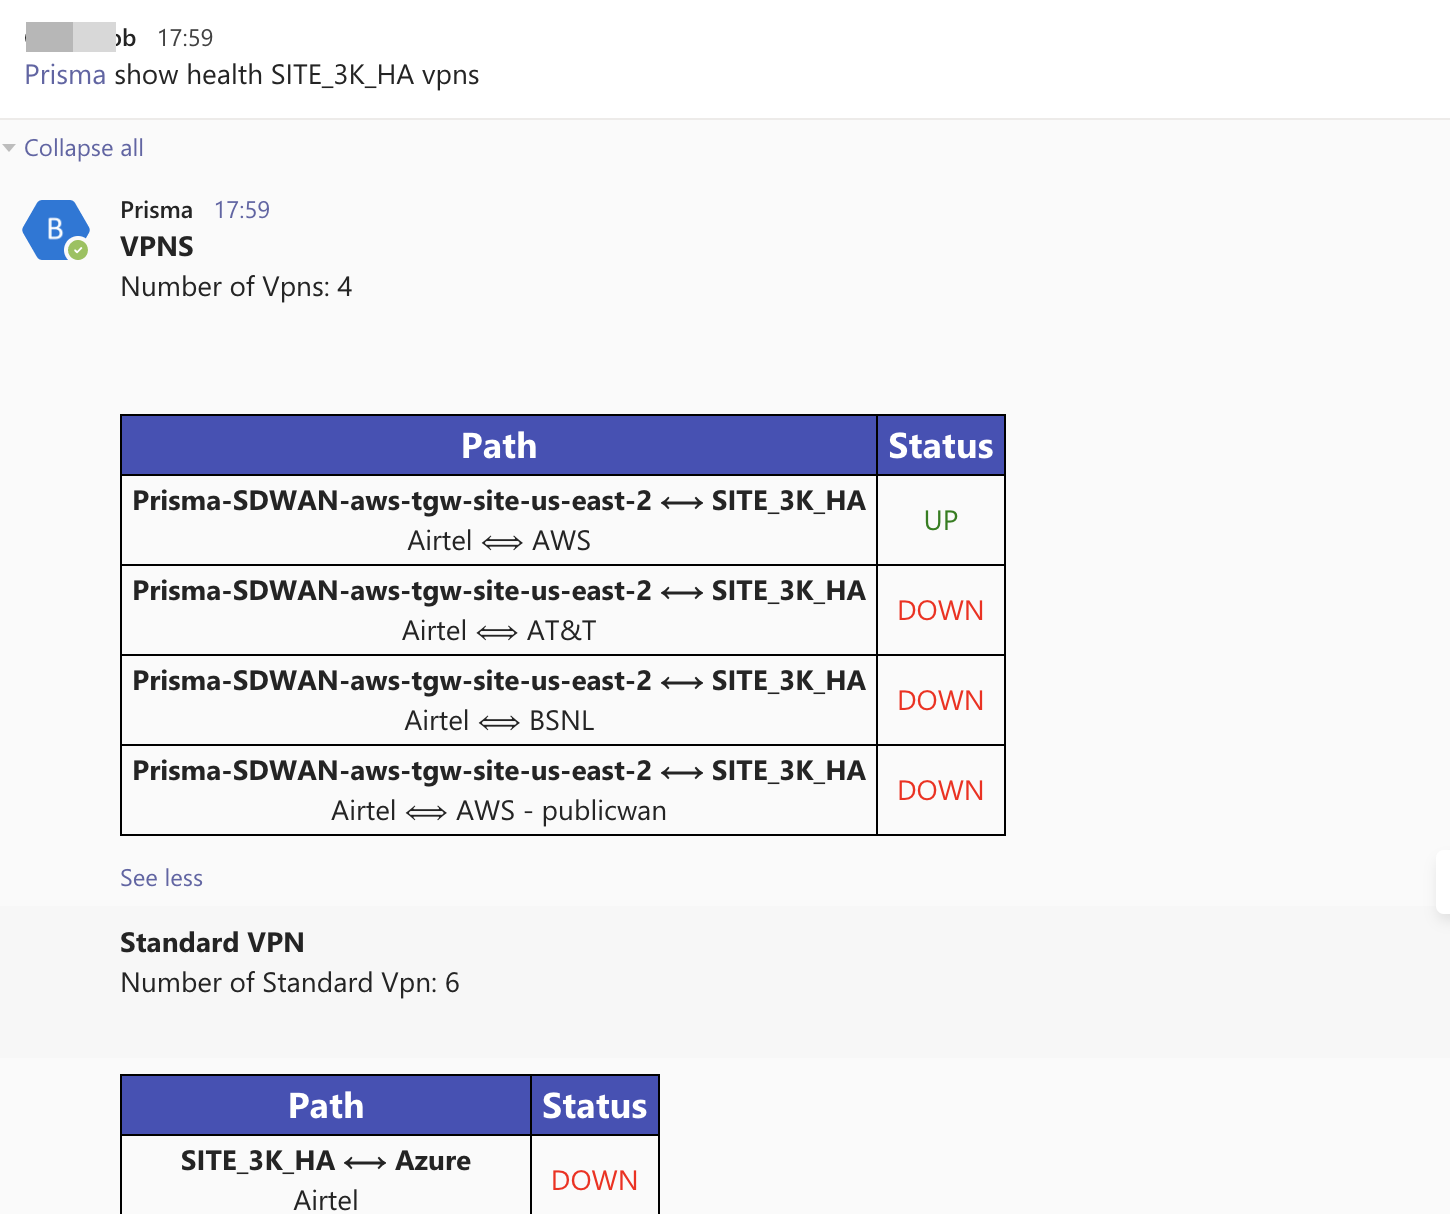
show health <sitename> vpns Filters the output to only display VPN link health. ![]()
show health <sitename> alarms Filters the output to only display alarms. ![]()
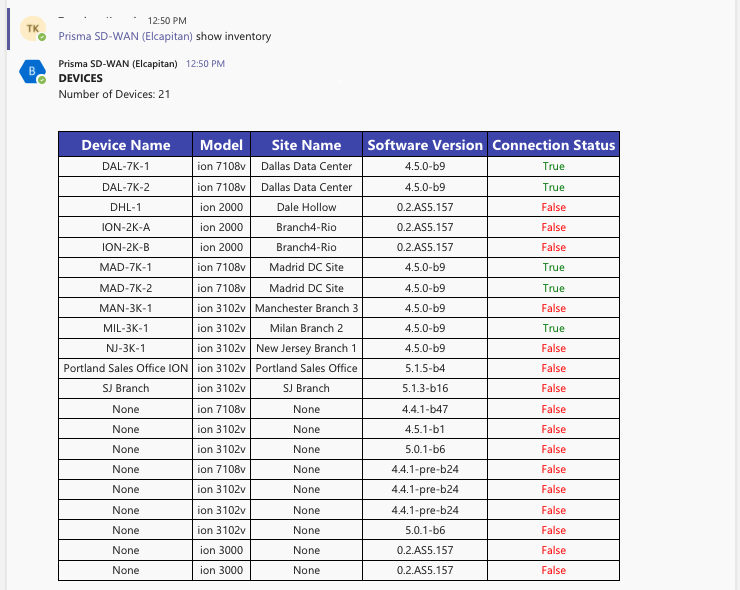
show inventory show inventory Lists all the devices in the system (both claimed and unclaimed) with the device name, model, site name, software version, and connection status attributes. ![]()
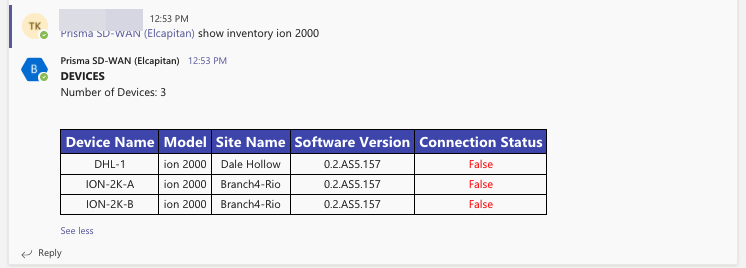
show inventory <modelname> Lists the inventory to display devices of the specified model type. ![]()
show inventory at site <sitename> Lists the inventory to display devices at the specified site. ![]()
show inventory <modelname> at site <sitename> Lists the inventory assigned to a site(s). ![]()
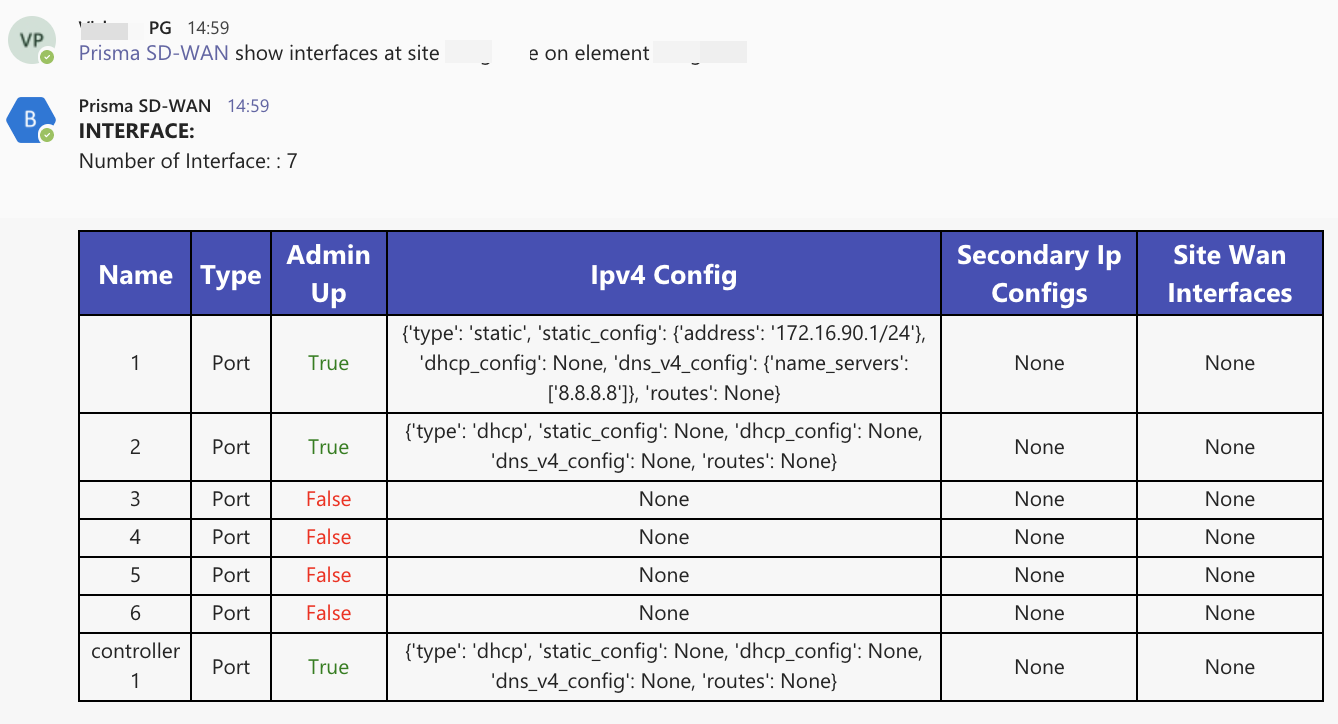
show interfaces show interfaces at site <sitename> on element<elemname> Displays the following interface attributes of admin status, type, name, ipv4_config, secondary_ip_configs, and site_wan_interface_ids. ![]()
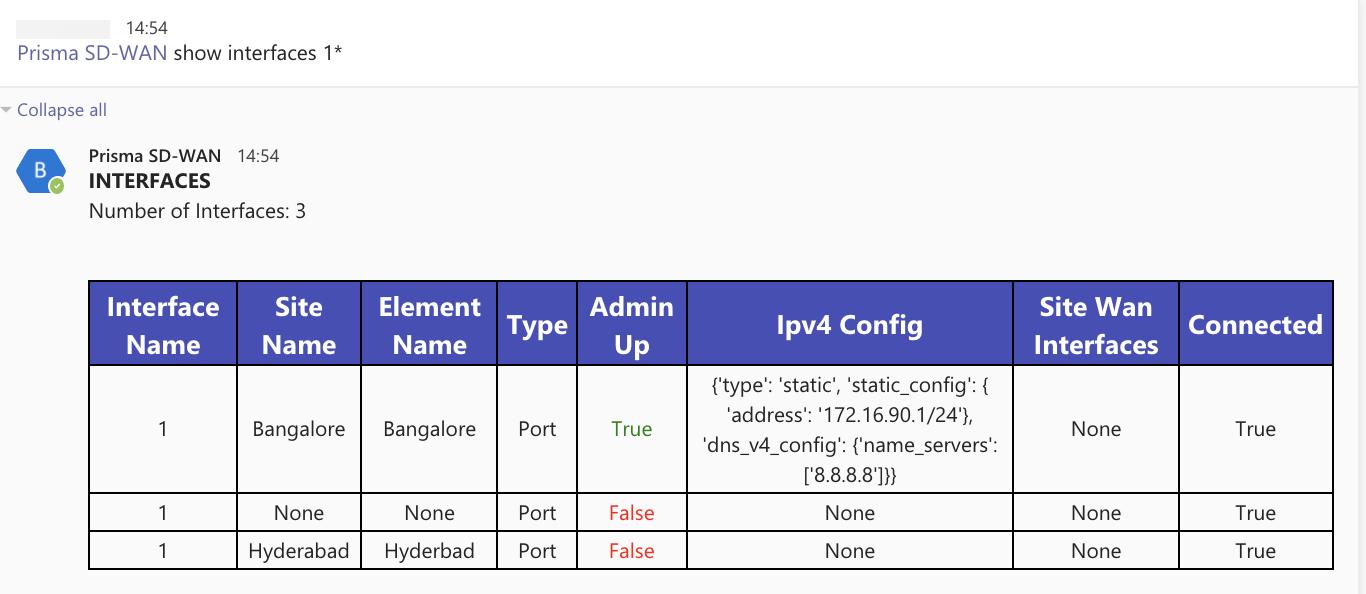
show interfaces <interfacename> Displays interface configurations of all the interfaces with the interface name with the following attributes: - sitename
- element name
- admin status
- type
- name
- ipv4_config
- secondary_ip_configs
- site_wan_interface_ids
- connected
![]()
show metrics—All metrics-related commands must have the options metric type, category, site, and hours. If the site name or the app name has a space, ensure the names are typed in double-quotes. show metrics <type> category <category> at site<sitename> hours <numhours> groupby<groupby> Displays specific metrics for the given site for the specified number of hours. The output displays a statistical distribution of the metrics queried for:- Count (Number of data points)
- Mean
- Standard Deviation
- Minimum Value
- Maximum Value
- Percentile Values: 50, 75, 90
Show metrics network <category> <bw> at site<sitename>hours <numhours>groupby<APPS> Displays the metrics, where the metric type is a network and the category is bandwidth for a given site for the specified number of hours for a given app(s). ![]()
Show metrics network <category> <bw> at site<sitename>hours <numhours> Displays the metrics, where the metric type is a network and the category is bandwidth for a given site for the specified number of hours. ![]()
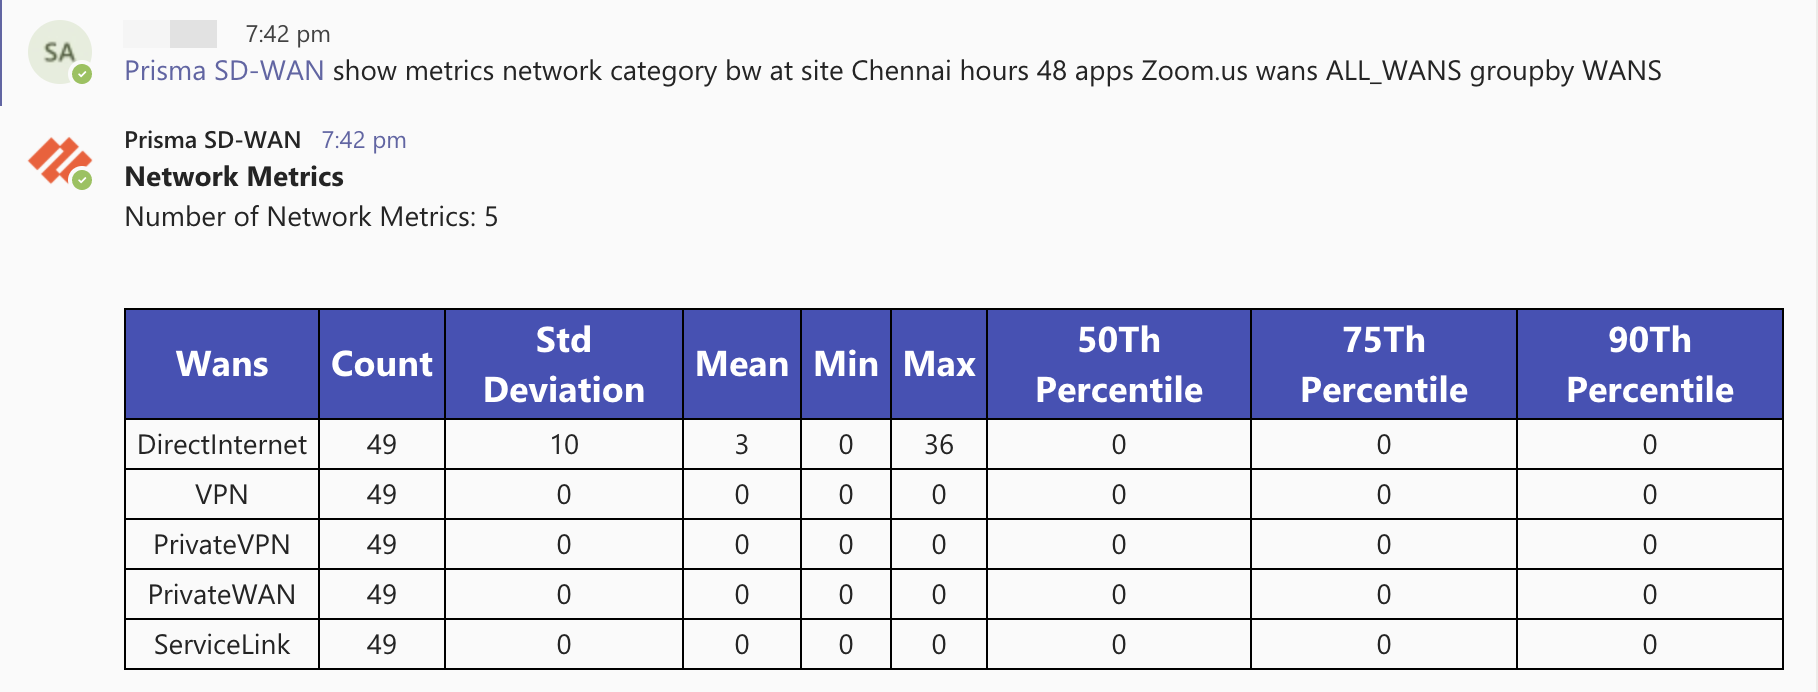
Show metrics network <category> <bw> at site<sitename>hours<numhours>groupby<APPS>groupby<WANS> Displays the metrics, where the metric type is a network and the category is bandwidth for a given site for the specified number of hours, for a given app(s), and the selected WANs. ![]()
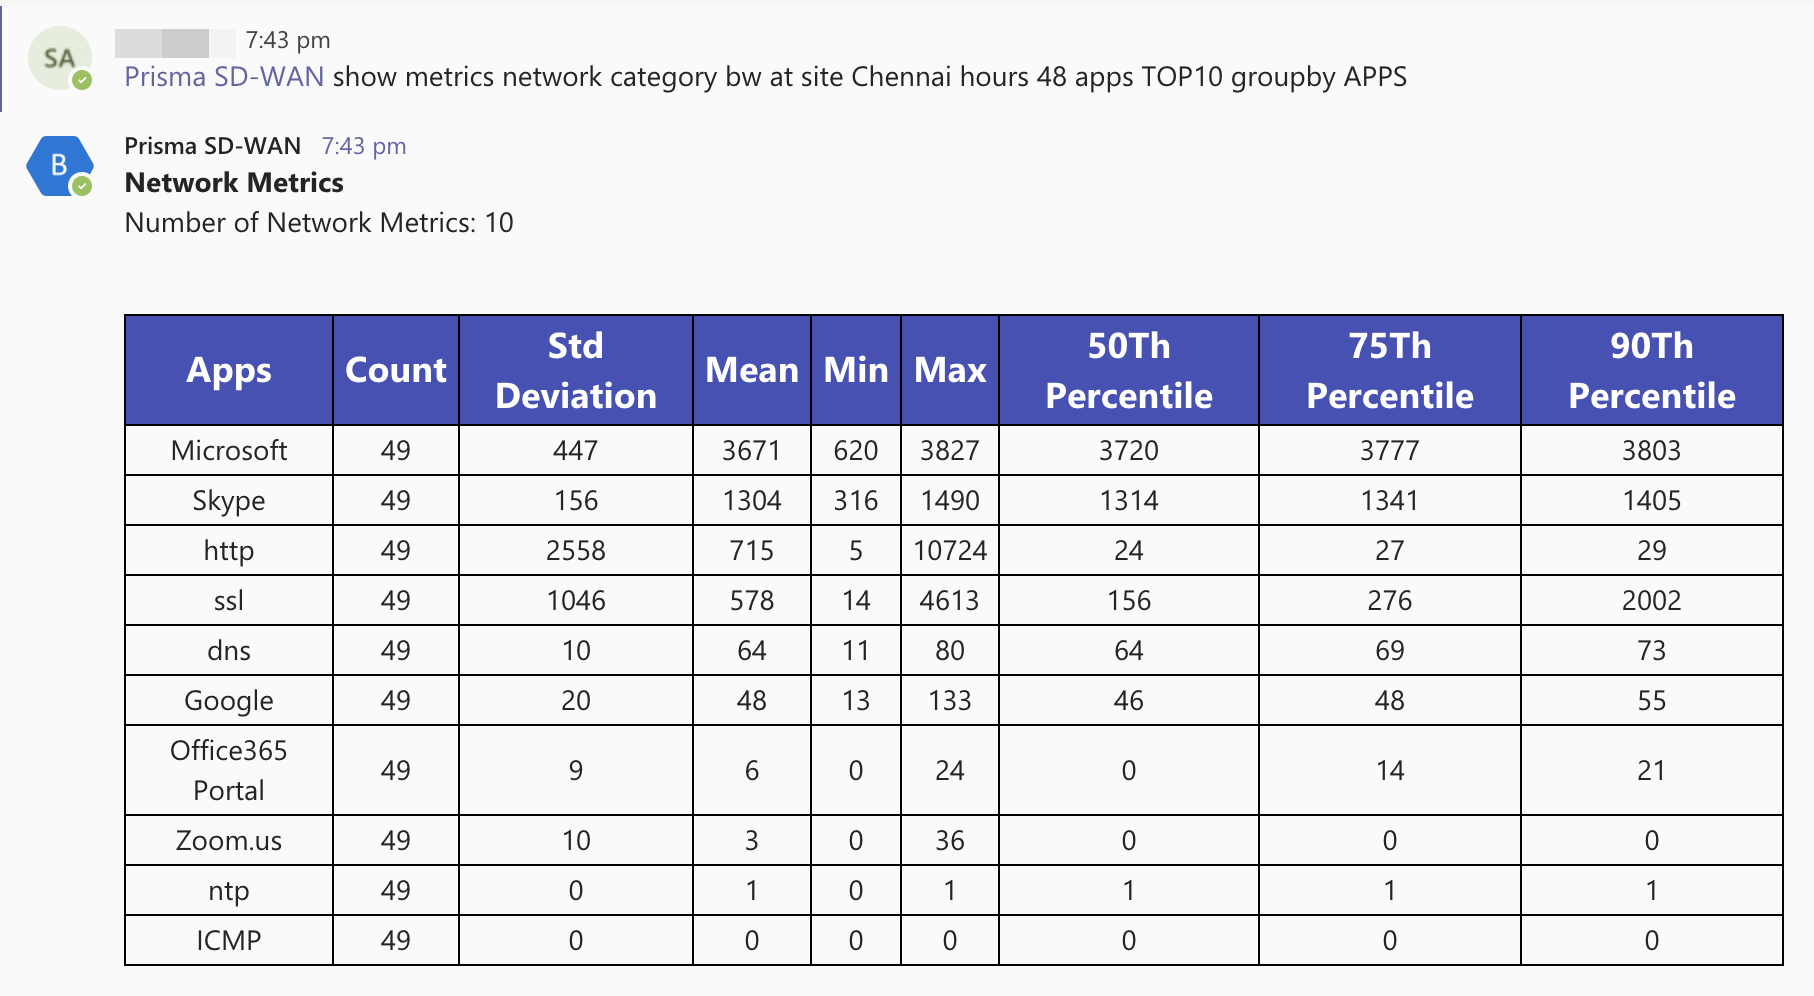
Show metrics network <category> <bw> at site<sitename>hours <numhours>groupby<Top10>groupby<APPS> Displays the metrics for the top 10 apps where the metric type is a network and the category is bandwidth for a given site for the specified number of hours. ![]()
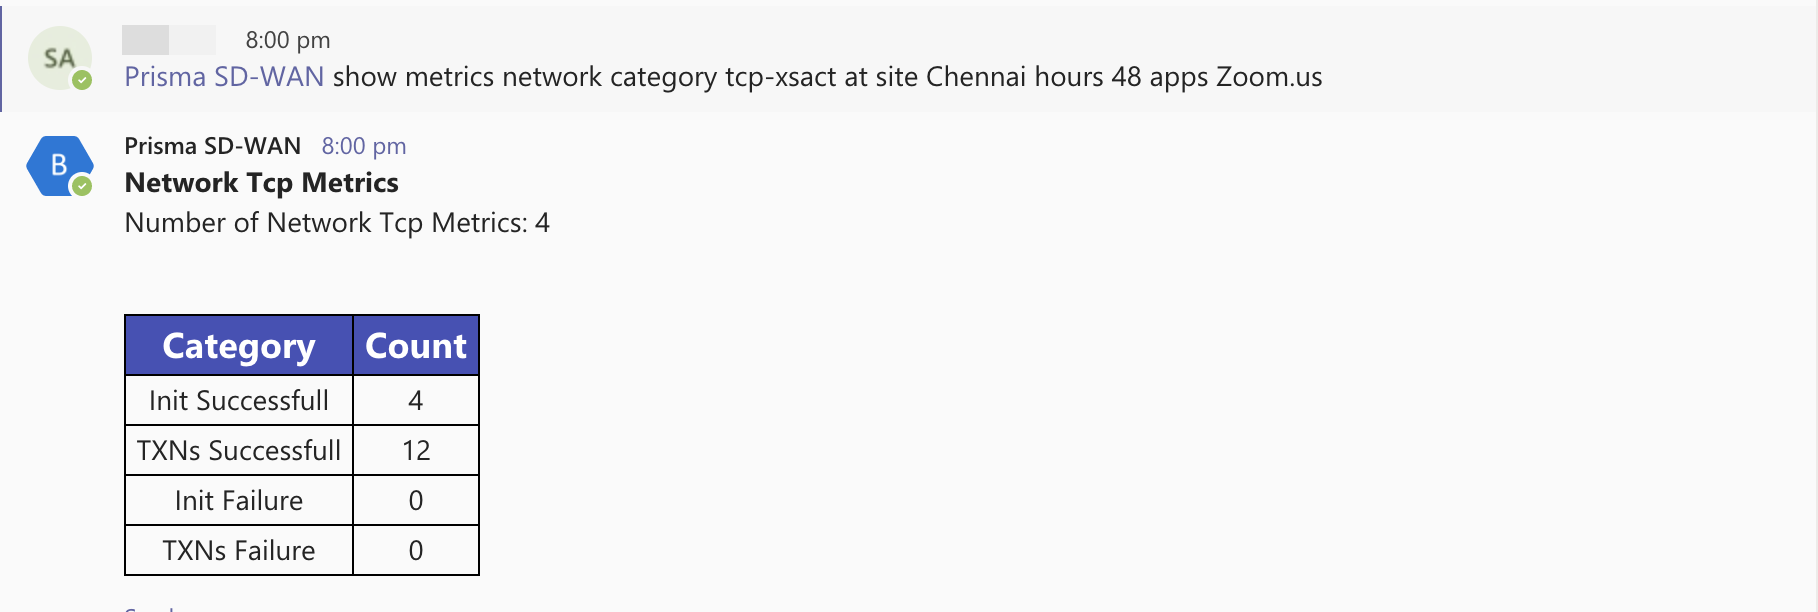
Show metrics network <category>tcp<tcp-xsact>at site <sitename>hours <numhours> Displays the TCP metrics where the metric type is a network and the category is tcp-xsact for a given site for the specified number of hours. ![]()
Show metrics network <category> tcp<tcp-xsact>at site <sitename>hours<numhours>groupby<APPS> Displays the TCP metrics, where the metric type is a network and the category is tcp-xsact for a given site for the specified number of hours for a given app(s). ![]()
Show metrics network <category> <tcp-xsact> atsite <sitename>hours<numhours>groupby<WANS> Displays the TCP metrics, where the metric type is a network and the category is tcp-xsact for a given site for the specified number of hours and selected WANs. ![]()
Show metrics network <category> <tcp-xsact> atsite <sitename>hours<numhours>groupby<APPS>groupby<WANS> Displays the TCP metrics, where the metric type is a network and the category is tcp-xsact for a given site for the specified number of hours, for a given app(s), and the selected WANs. ![]()
Show metrics app <category> <health> at site<sitename>hours <numhours>groupby<APPS> Displays the app(s) health metrics, for a given site for the specified number of hours for a given app(s). ![]()
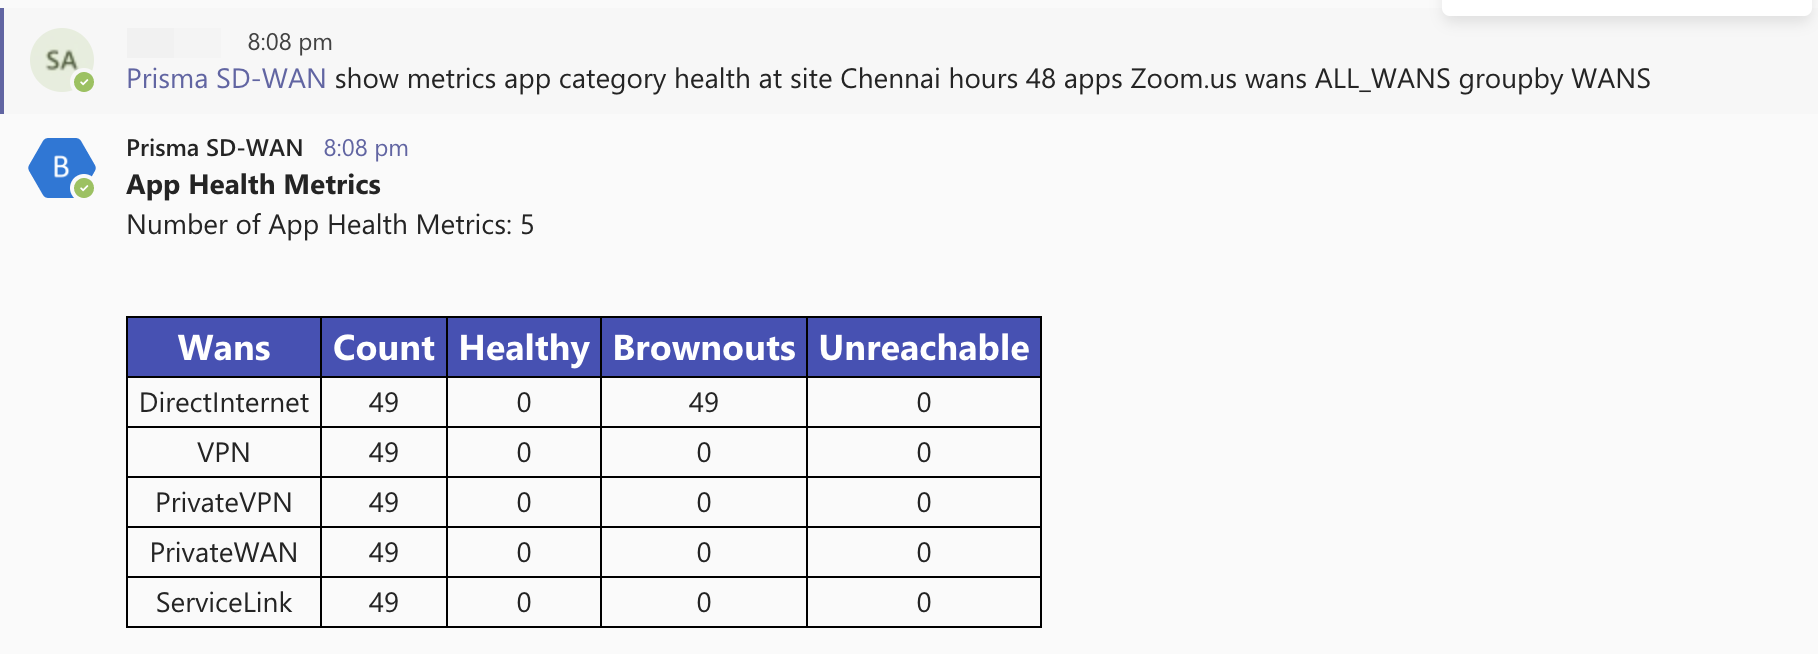
Show metrics app <category> <health> at site<sitename>hours<numhours>groupby<APPS>groupby<WANS> Displays the app(s) health metrics for a given site for the specified number of hours, for a given app(s) and the selected WANs or all WANs. ![]()
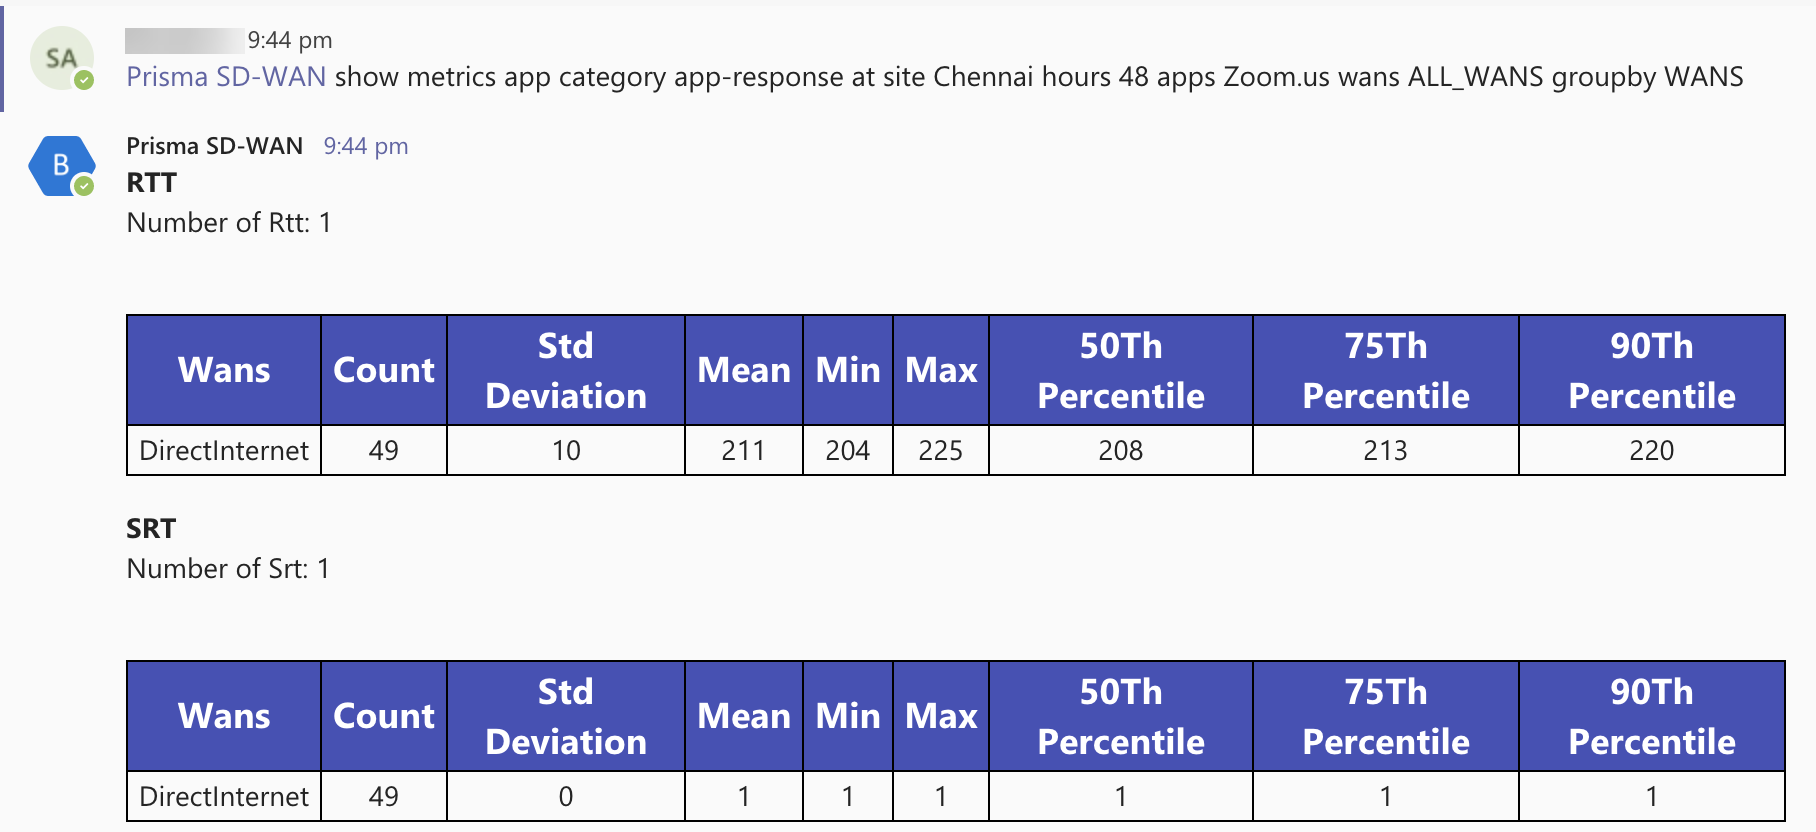
Show metrics app <category> <app-response> atsite <sitename>hours<numhours>groupby<APPS> Displays the app response metrics, for a given site for the specified number of hours for a given app(s). ![]()
Show metrics app <category> <app-response> atsite <sitename>hours<numhours>groupby<APPS>groupby<WANS> Displays the app response metrics for a given site for the specified number of hours, for a given app(s), and the selected WANs or all WANs. ![]()
Show metrics media <category> <audio-bw> atsite <sitename>hours<numhours>groupby<APPS> Displays the audio bandwidth metrics, for a given site for the specified number of hours for a given app(s). ![]()
Show metrics media <category> <audio-bw> atsite <sitename>hours<numhours>groupby<APPS>groupby<WANS> Displays the audio bandwidth metrics for a given site for the specified number of hours, for a given app(s), and the selected WANs or all WANs. ![]()
Show metrics media <category> <audio-jitter> atsite <sitename>hours<numhours>groupby<APPS> Displays the audio jitter metrics, for a given site for the specified number of hours for a given app(s). ![]()
Show metrics media <category> <audio-jitter> atsite <sitename>hours<numhours>groupby<APPS>groupby<WANS> Displays the audio jitter metrics for a given site for the specified number of hours, for a given app(s), and the selected WANs or all WANs. ![]()
Show metrics media <category> <video-jitter> atsite <sitename>hours<numhours>groupby<APPS> Displays the video jitter metrics, for a given site for the specified number of hours for a given app(s). ![]()
Show metrics media <category> <audio-loss> atsite<sitename>hours<numhours><groupby<APPS> Displays the audio-loss metrics, for a given site for the specified number of hours for a given app(s). ![]()
Show metrics media <category> audio-loss> atsite <sitename>hours<numhours>groupby<APPS>groupby<WANS> Displays the audio loss metrics for a given site for the specified number of hours, for a given app(s), and the selected WANs or all WANs. Show metrics media <category> <video-loss> atsite<sitename>hours<numhours><groupby<APPS> Displays the video-loss metrics, for a given site for the specified number of hours for a given app(s). ![]()
Show metrics media <category> video-loss> atsite <sitename>hours<numhours>groupby<APPS>groupby<WANS> Displays the video loss metrics for a given site for the specified number of hours, for a given app(s), and the selected WANs or all WANs. ![]()
Show metrics media <category> <audio-mos> atsite<sitename>hours<numhours><groupby<APPS> Displays the audio-mos metrics, for a given site for the specified number of hours for a given app(s). ![]()
Show metrics media <category> audio-mos> atsite <sitename>hours<numhours>groupby<APPS>groupby<WANS> Displays the audio-mos metrics for a given site for the specified number of hours, for a given app(s), and the selected WANs or all WANs. ![]()
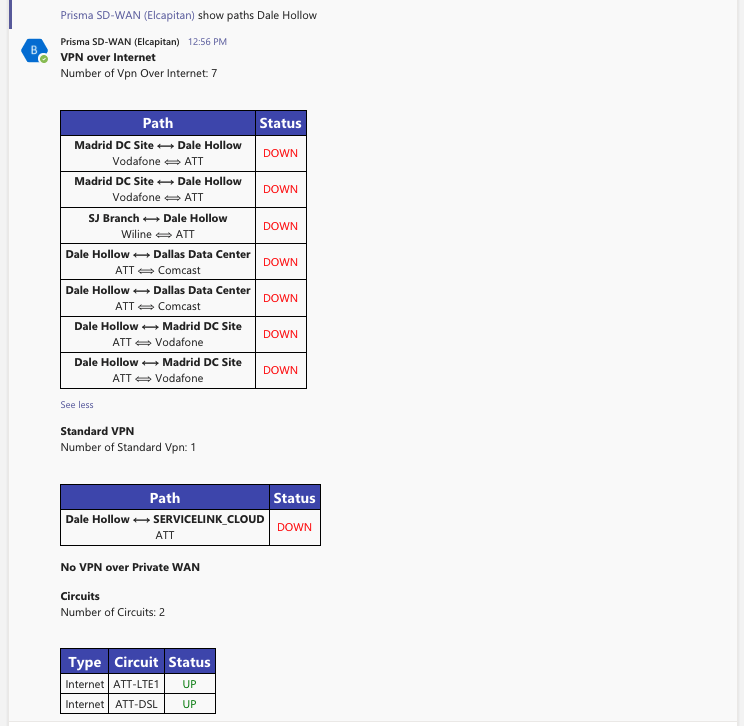
show paths show paths <sitename> Displays all the paths, overlay + underlays, at a given site.- Internet
- Private WAN
- VPN over Internet
- VPN over Private WAN
- Standard VPN
![]()
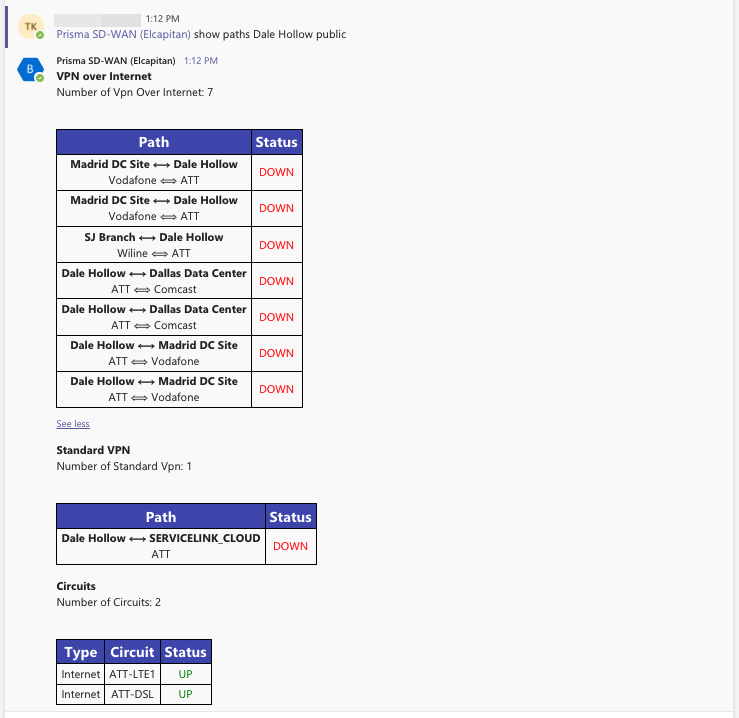
show paths <sitename> public Displays only the public paths, overlay+underlays, at a given site. - Internet
- VPN over Internet
- Standard VPN
![]()
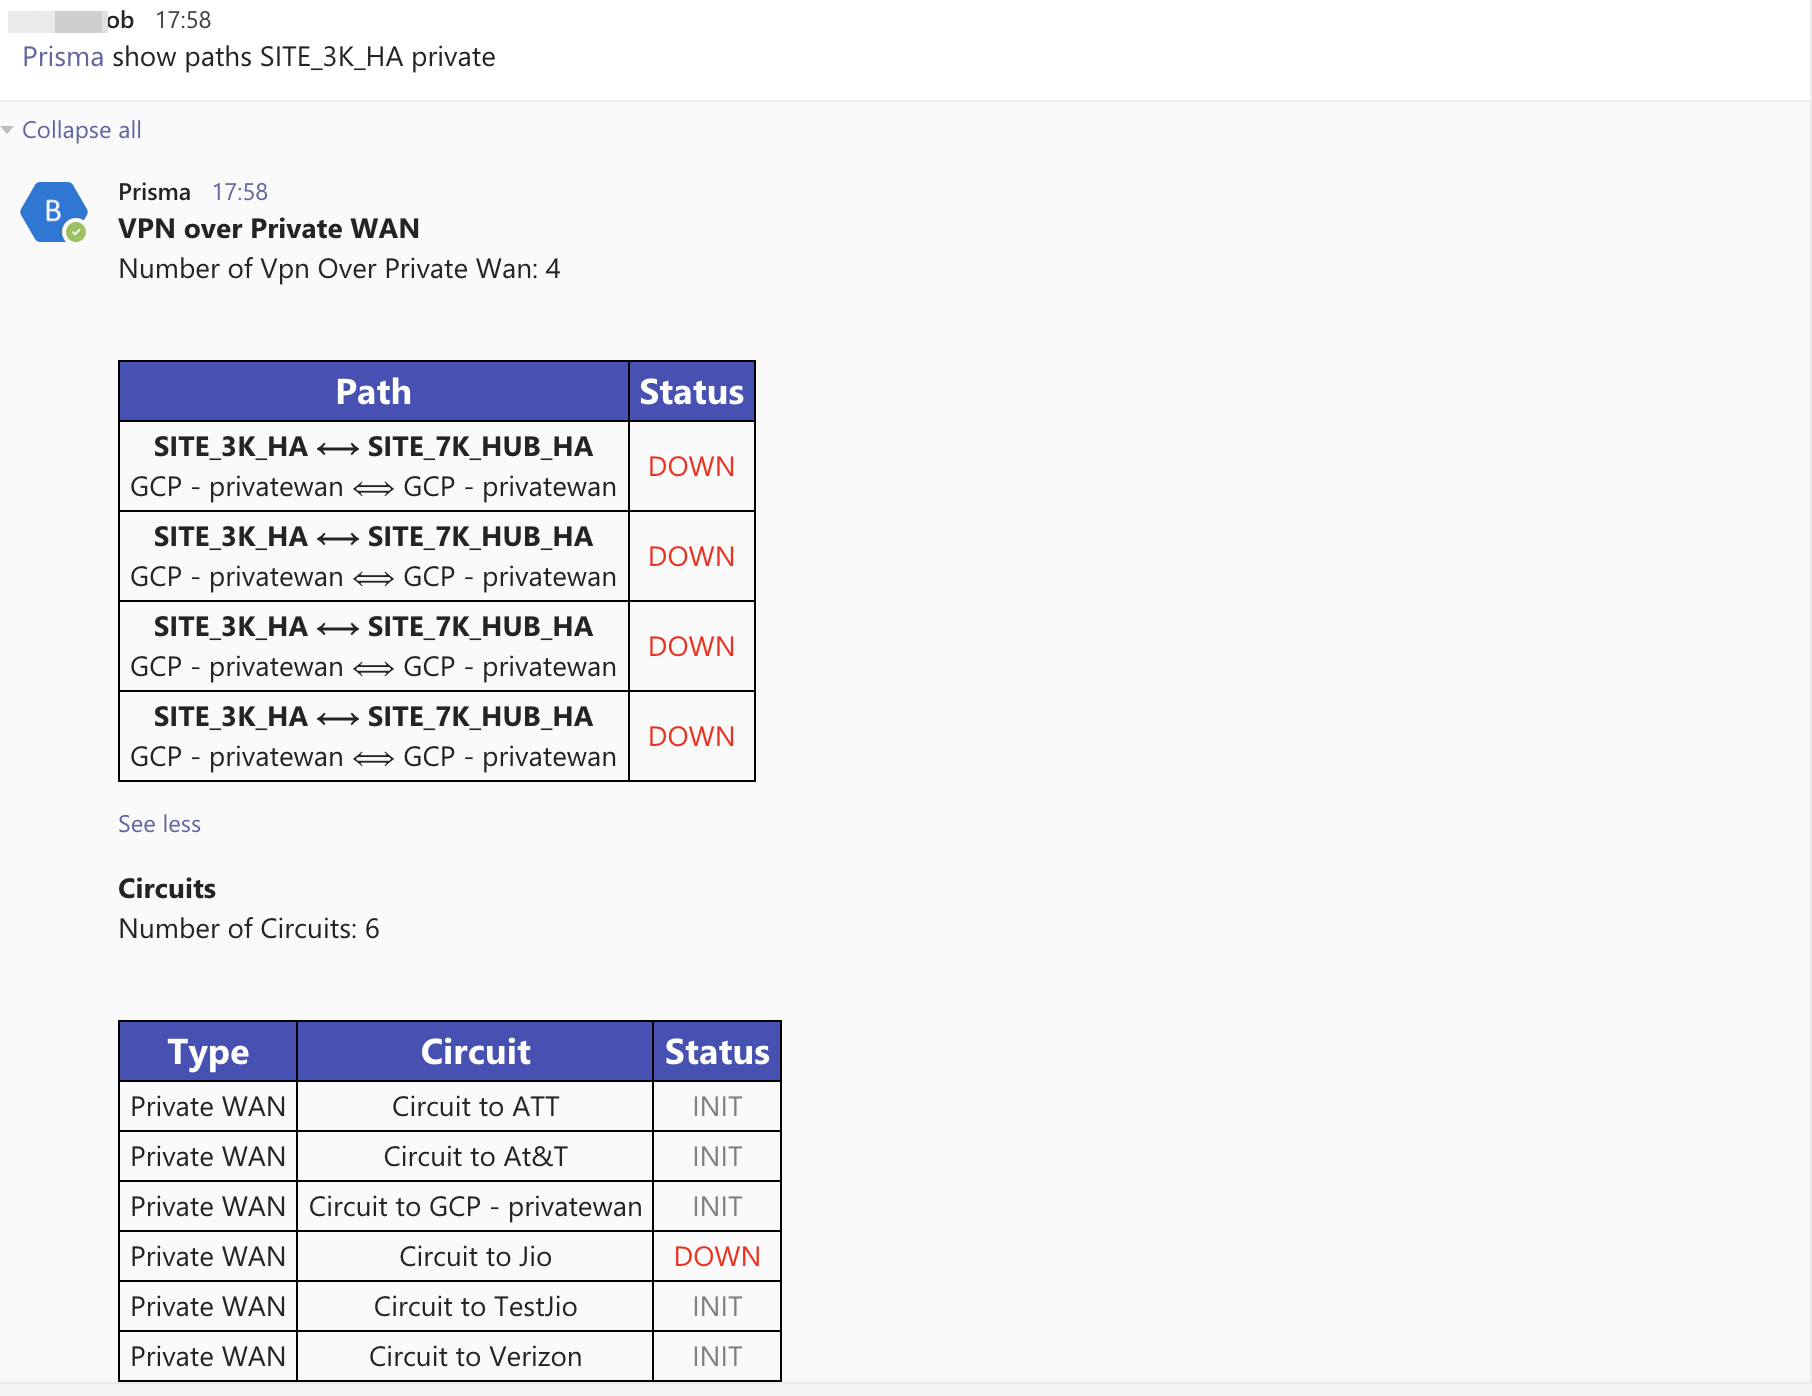
show paths <sitename> private Displays only the private paths, overlay +underlays, at a given site. - Private WAN
- VPN over Private WAN
![]()
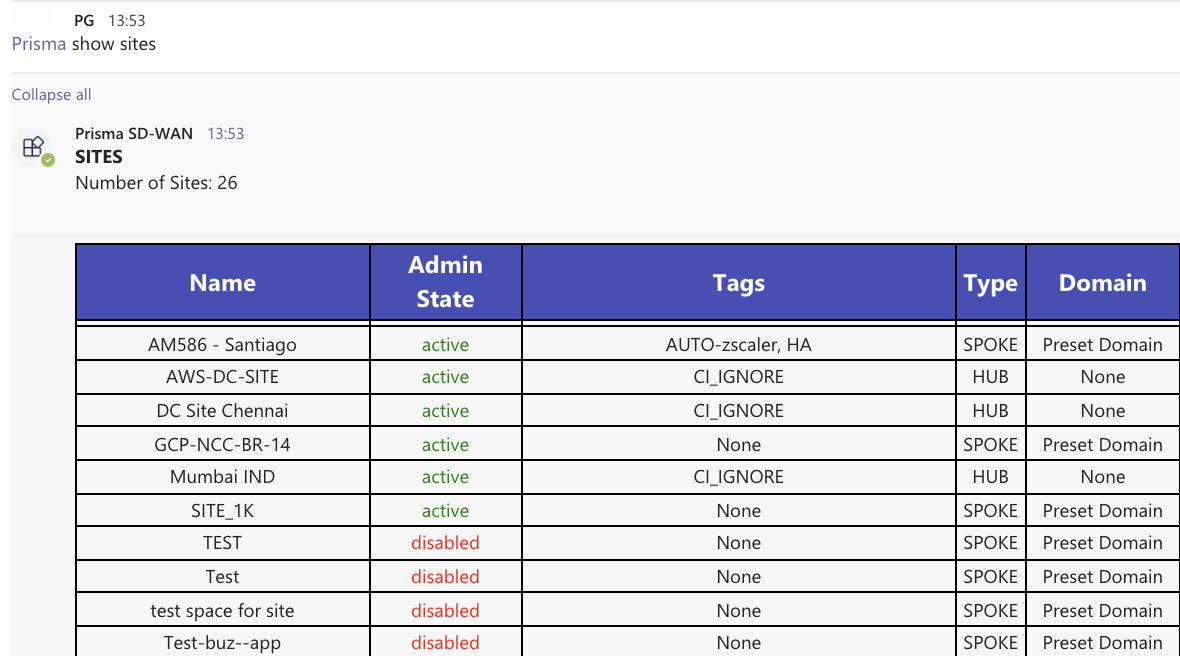
show sites show sites Lists all the sites, site type (hub v/s spoke), admin state, tags, and domain. ![]()
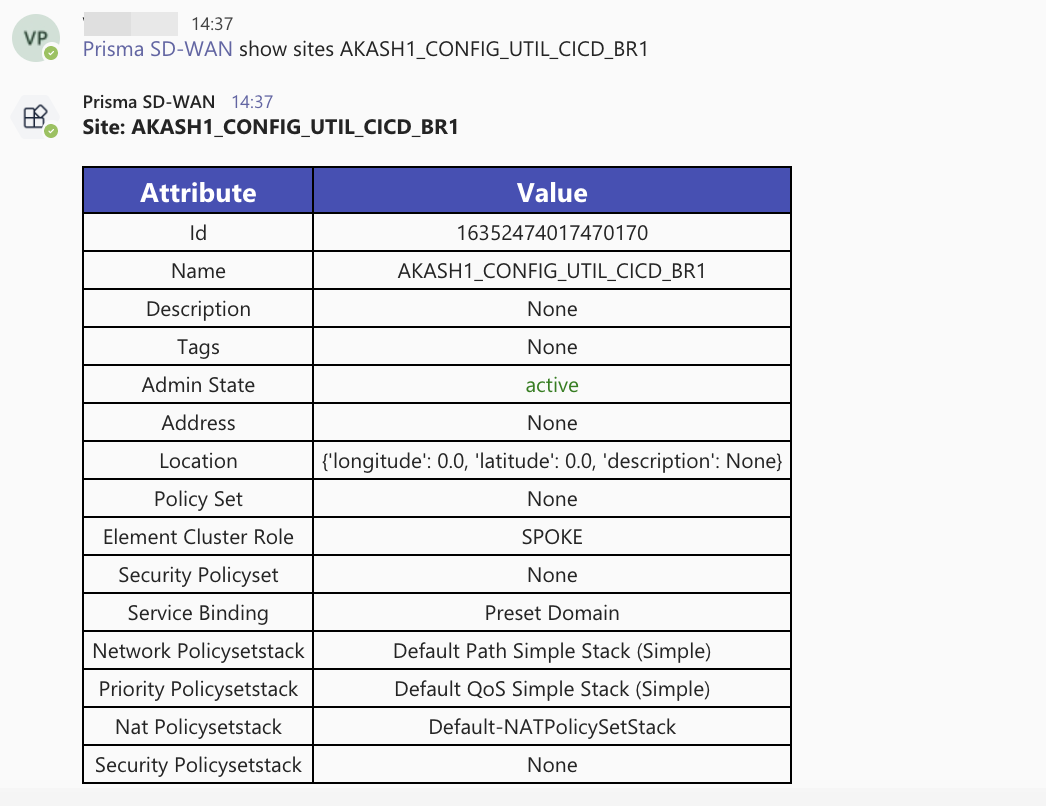
show sites <sitename> Lists all the site properties such as an address, location, tags, and attached policies. ![]()
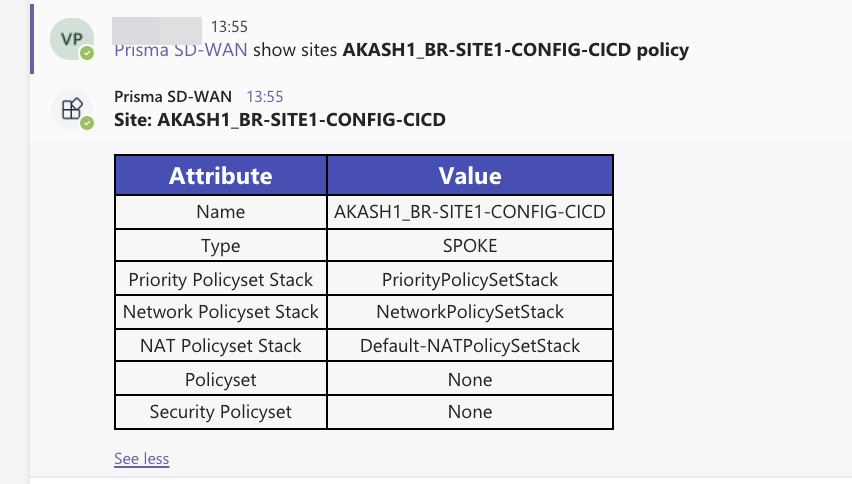
show sites <sitename> address Lists the addresses of all the sites. show sites <sitename> policy Lists the path, QoS, Security, and NAT policies attached to the site. ![]()
show sites <sitename> tags Lists the tags attached to the site. ![]()


