Prisma SD-WAN
Prisma SD-WAN MSP Dashboard
Table of Contents
Prisma SD-WAN MSP Dashboard
Monitor your devices and tenants using the Prisma SD-WAN
MSP dashboard.
| Where Can I Use This? | What Do I Need? |
|---|---|
|
|
Monitor your devices and tenants using the Prisma SD-WAN MSP
dashboard. After logging in to the Strata Cloud Manager, click the user icon in the left
navigation pane and select the app.
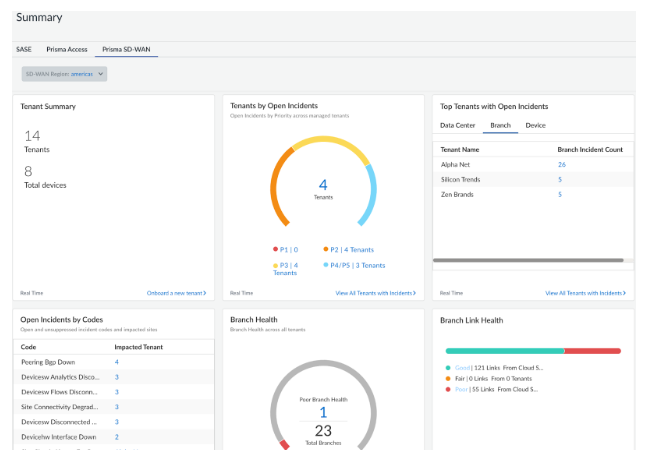
The Summary screen displays a high-level summarized status of all your
tenants. The information is refreshed every 5 minutes. The
Summary screen offers you the following widgets:
For a single tenant, to manage
your ION devices, use . For MSP users, to move ION devices between tenants, use
ManageDevices on the MSP Dashboard.
| Widget | Description |
|---|---|
| Tenants by Open Incidents | Displays the open alarms by priority across all your tenants. Click a priority to view the Incidents page. The tenant count shows the total number of tenants available under the MSP tenant. |
| Top Tenants with Open Incidents | Displays the tenants with the maximum open alarms for a data center site, branch site or across devices. Select the Data Center, Branch Sites, or ION Devices tab to view the respective alarms. Click the alarm count to view the Incidents page. |
| Open Incidents by Codes | Displays the number of open alarms based on the alarm
codes. Click the Impacted Tenant to view the
alerts and alarms for the tenant on the Events
page within the tenant portal. If more than one tenant has the same
alarm, then an alarm count is displayed. Click the alarm count to
view the Incidents page on the MSP Portal. |
| Branch Health | Displays the health of a branch site. A branch has poor health when the site health score is less than 60. The branch health score is determined by the best link health score. So if all links have a health score lower than 60, the branch health score would accordingly be lower than 60. |
| Branch Link Health | Displays the health of the Secure Fabric links for
branches across all tenants. Good—Indicates a health
score>80. Fair—Indicates a health score between
60-80. Poor—Indicates a health score<60. |
| Top Tenants with Poor Links | Displays the top tenants who have poor link health in percentage. Prisma SD-WAN calculates poor link health percentage for a tenant by dividing the number of links having a health score of less than 60 by the total links for the tenant and multiplying by 100. |
| Devices to Controller Connectivity | Displays the number of online and offline devices connected to the Prisma SD-WAN controller for a branch and data center site. Click View All Tenants with Offline Devices to view the device metrics for a tenant. |