SD-WAN
Troubleshoot Link Performance
Table of Contents
Expand All
|
Collapse All
SD-WAN Docs
-
-
-
-
- 3.4
- 3.3
- 3.2
- 3.1
- 3.0
- 2.2
- 2.1
- 2.0
- 1.0
-
Troubleshoot Link Performance
View impacted VPN clusters to understand what links are
experiencing performance issues.
| Where Can I Use This? | What Do I Need? |
|---|
Understanding what is causing degraded link performance is integral for ensuring the user
experience when using apps and services is not impacted. Understanding why your VPN
clusters have links that are impacted helps in fine tuning your SD-WAN configuration to ensure that the user experiences when using apps and services
are not affected by links with degraded health.
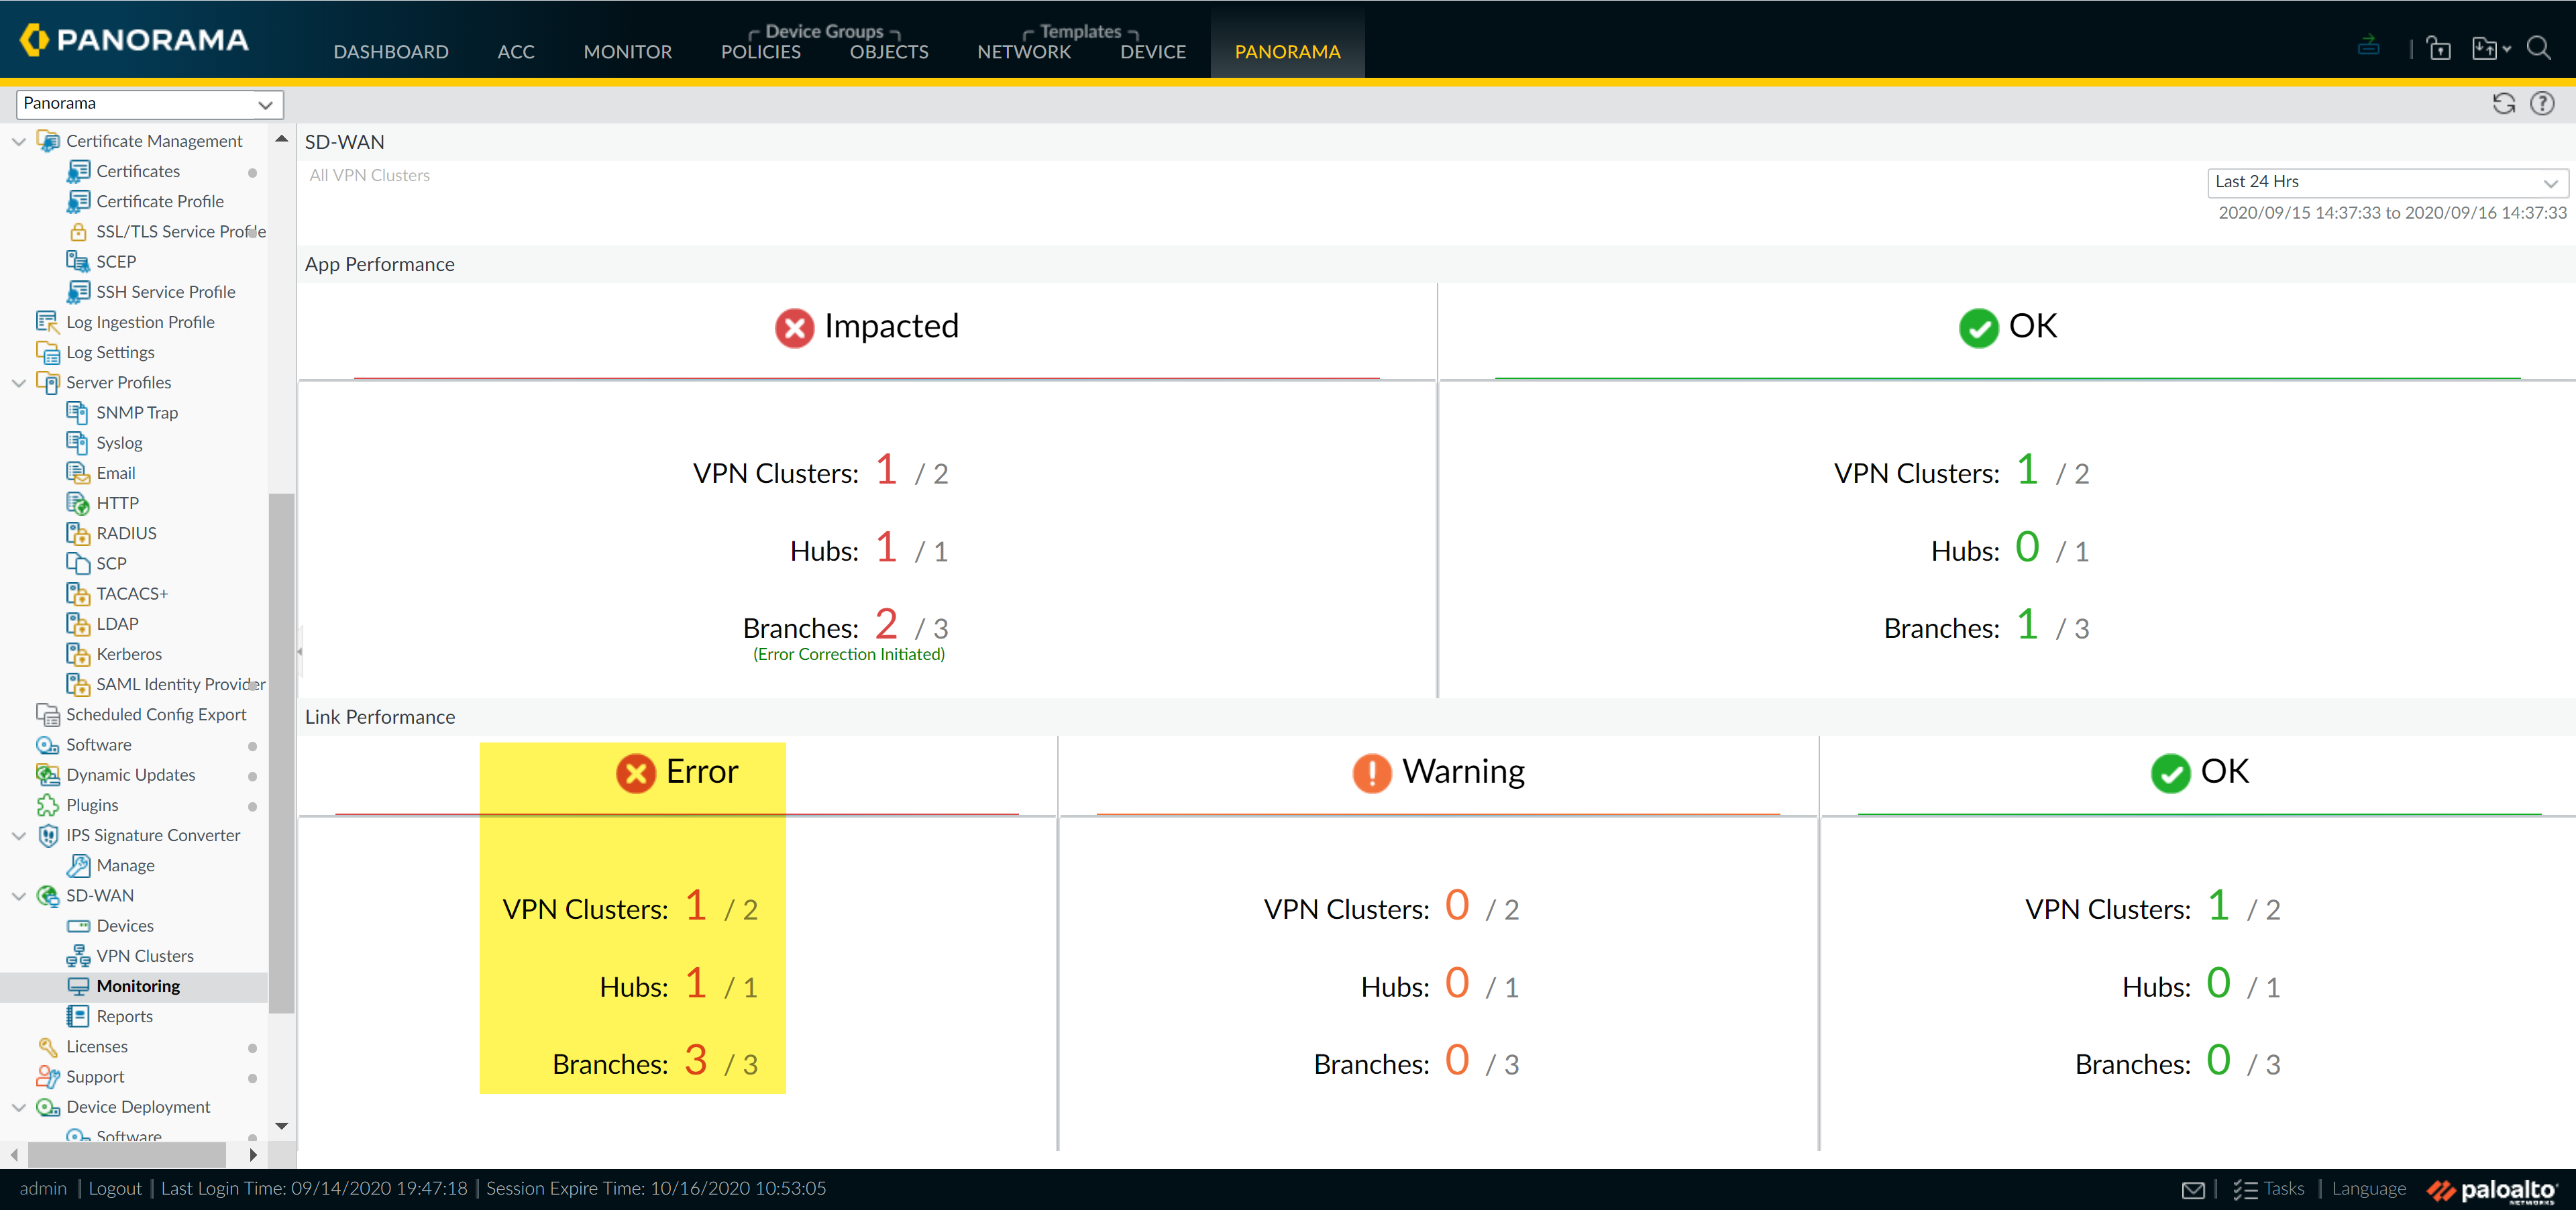
- Log in to the Panorama Web Interface.Select PanoramaSD-WANMonitoring and view the Impacted VPN clusters.
![]() Filter the VPN clusters based on your preferred metric from the Site drop-down and select time frame. In the Sites column, select the impacted hub or branch firewall to view the impacted apps and the corresponding link performance.In this example, we are viewing All Sites containing impacted VPN clusters in the last 24 hours.
Filter the VPN clusters based on your preferred metric from the Site drop-down and select time frame. In the Sites column, select the impacted hub or branch firewall to view the impacted apps and the corresponding link performance.In this example, we are viewing All Sites containing impacted VPN clusters in the last 24 hours.![]() In the Sites column, select the impacted hub or branch firewall to view the impacted apps and the corresponding link performance.
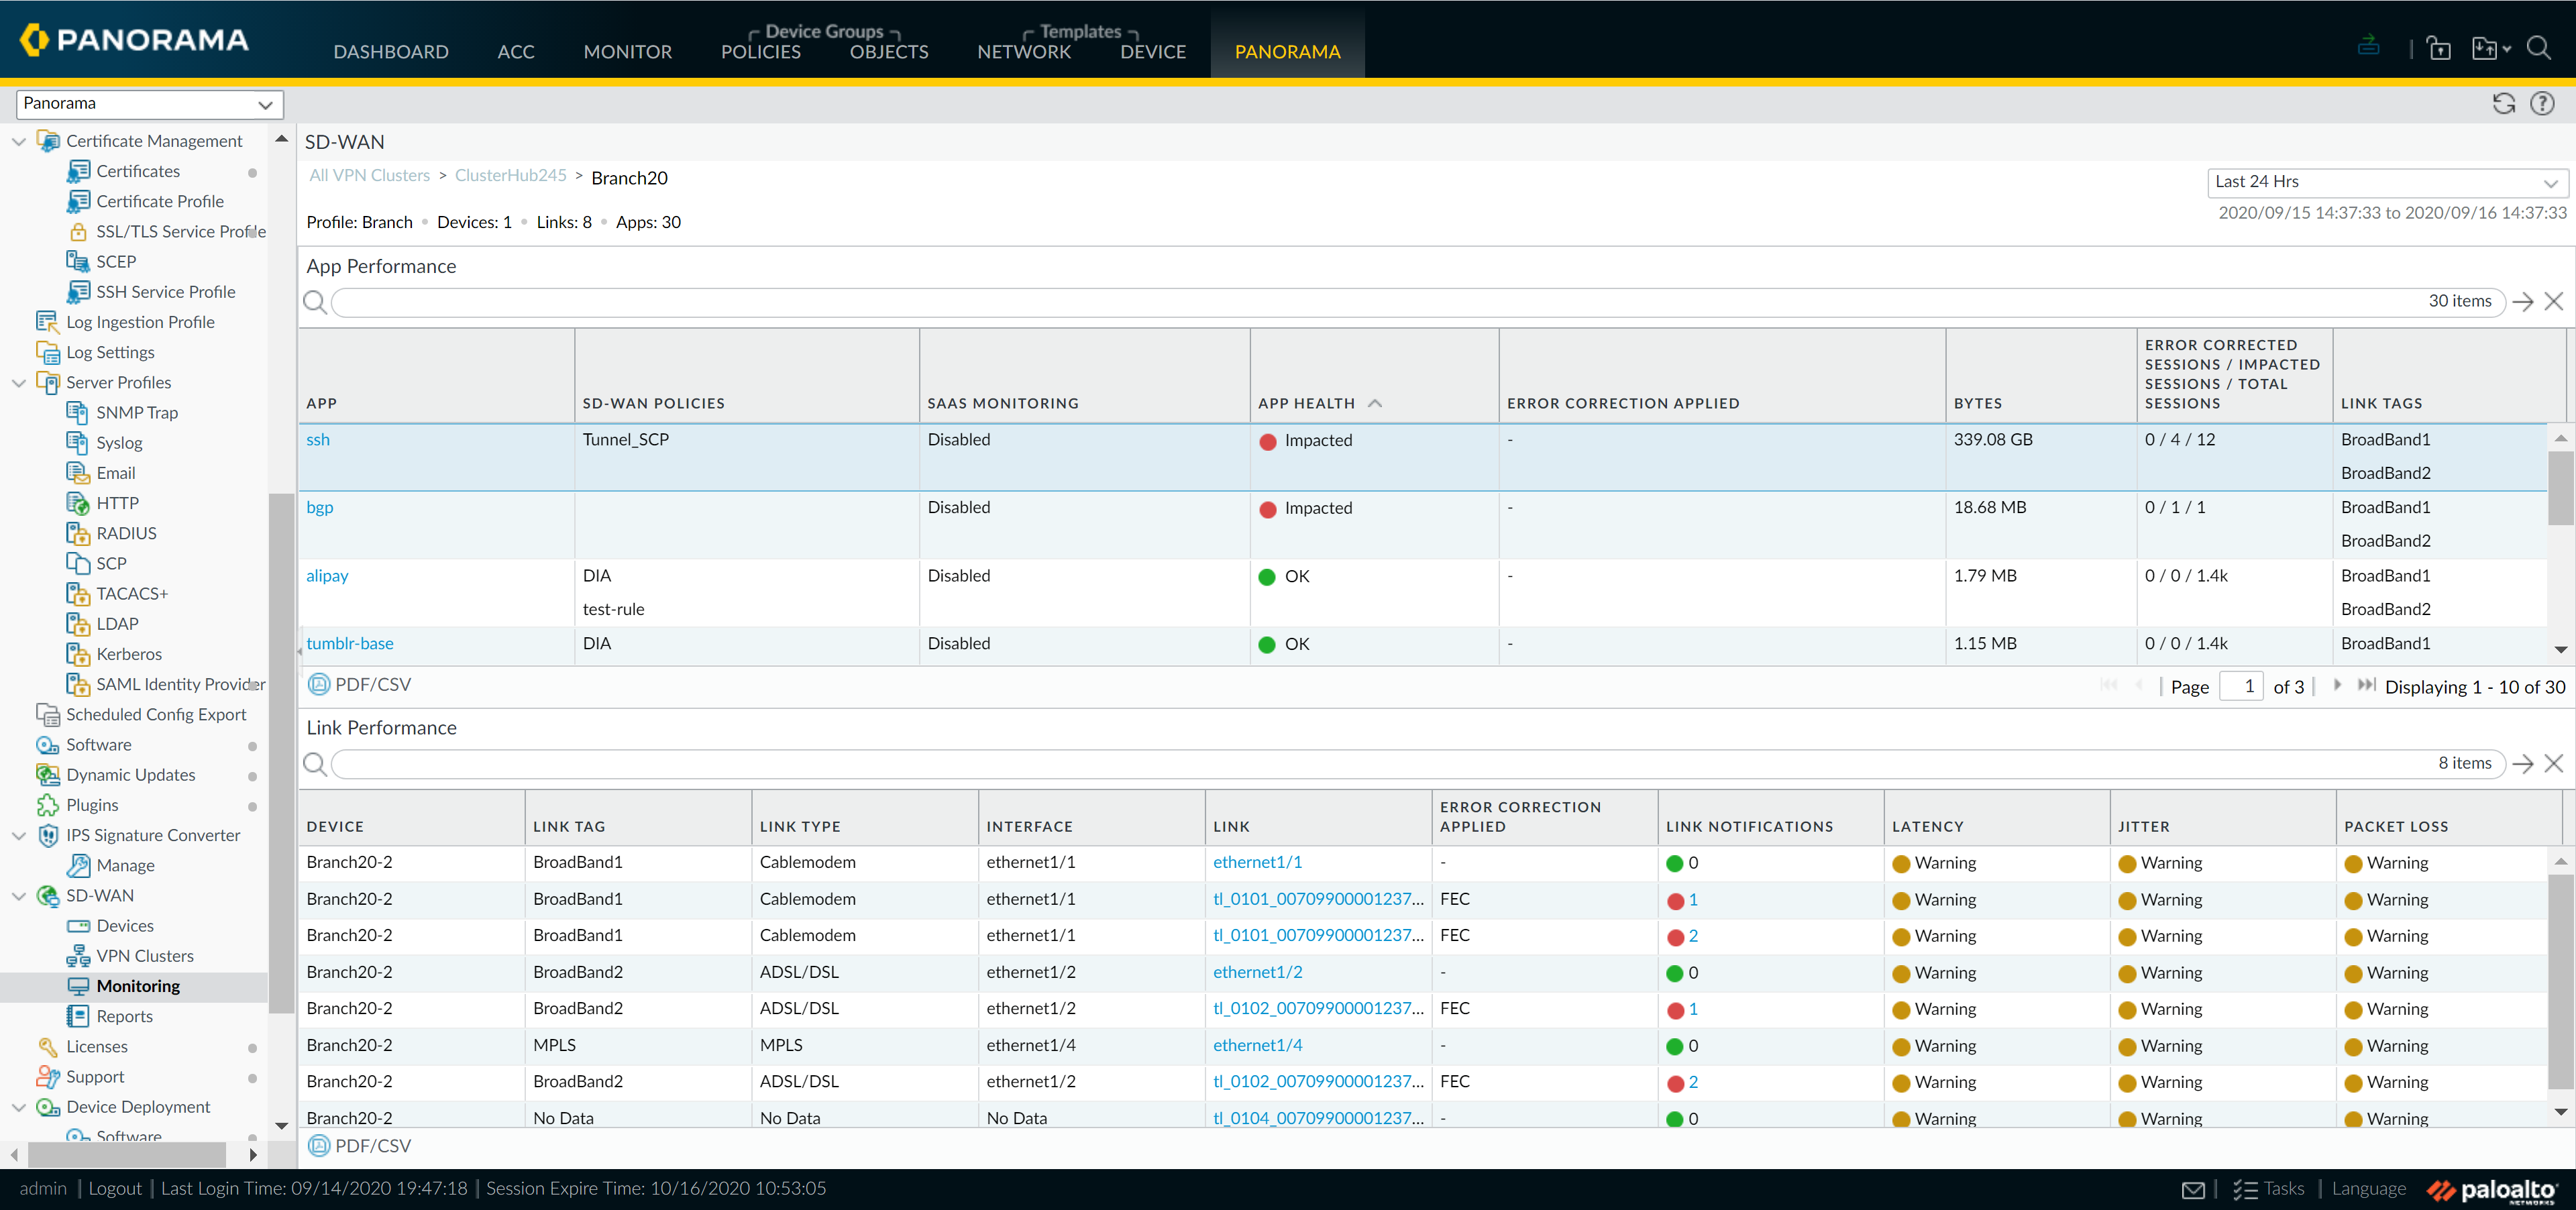
In the Sites column, select the impacted hub or branch firewall to view the impacted apps and the corresponding link performance.![]() In the App Performance section, click an app to view detailed Traffic Characteristic information about the app traffic such as the internet service(s) and links used:
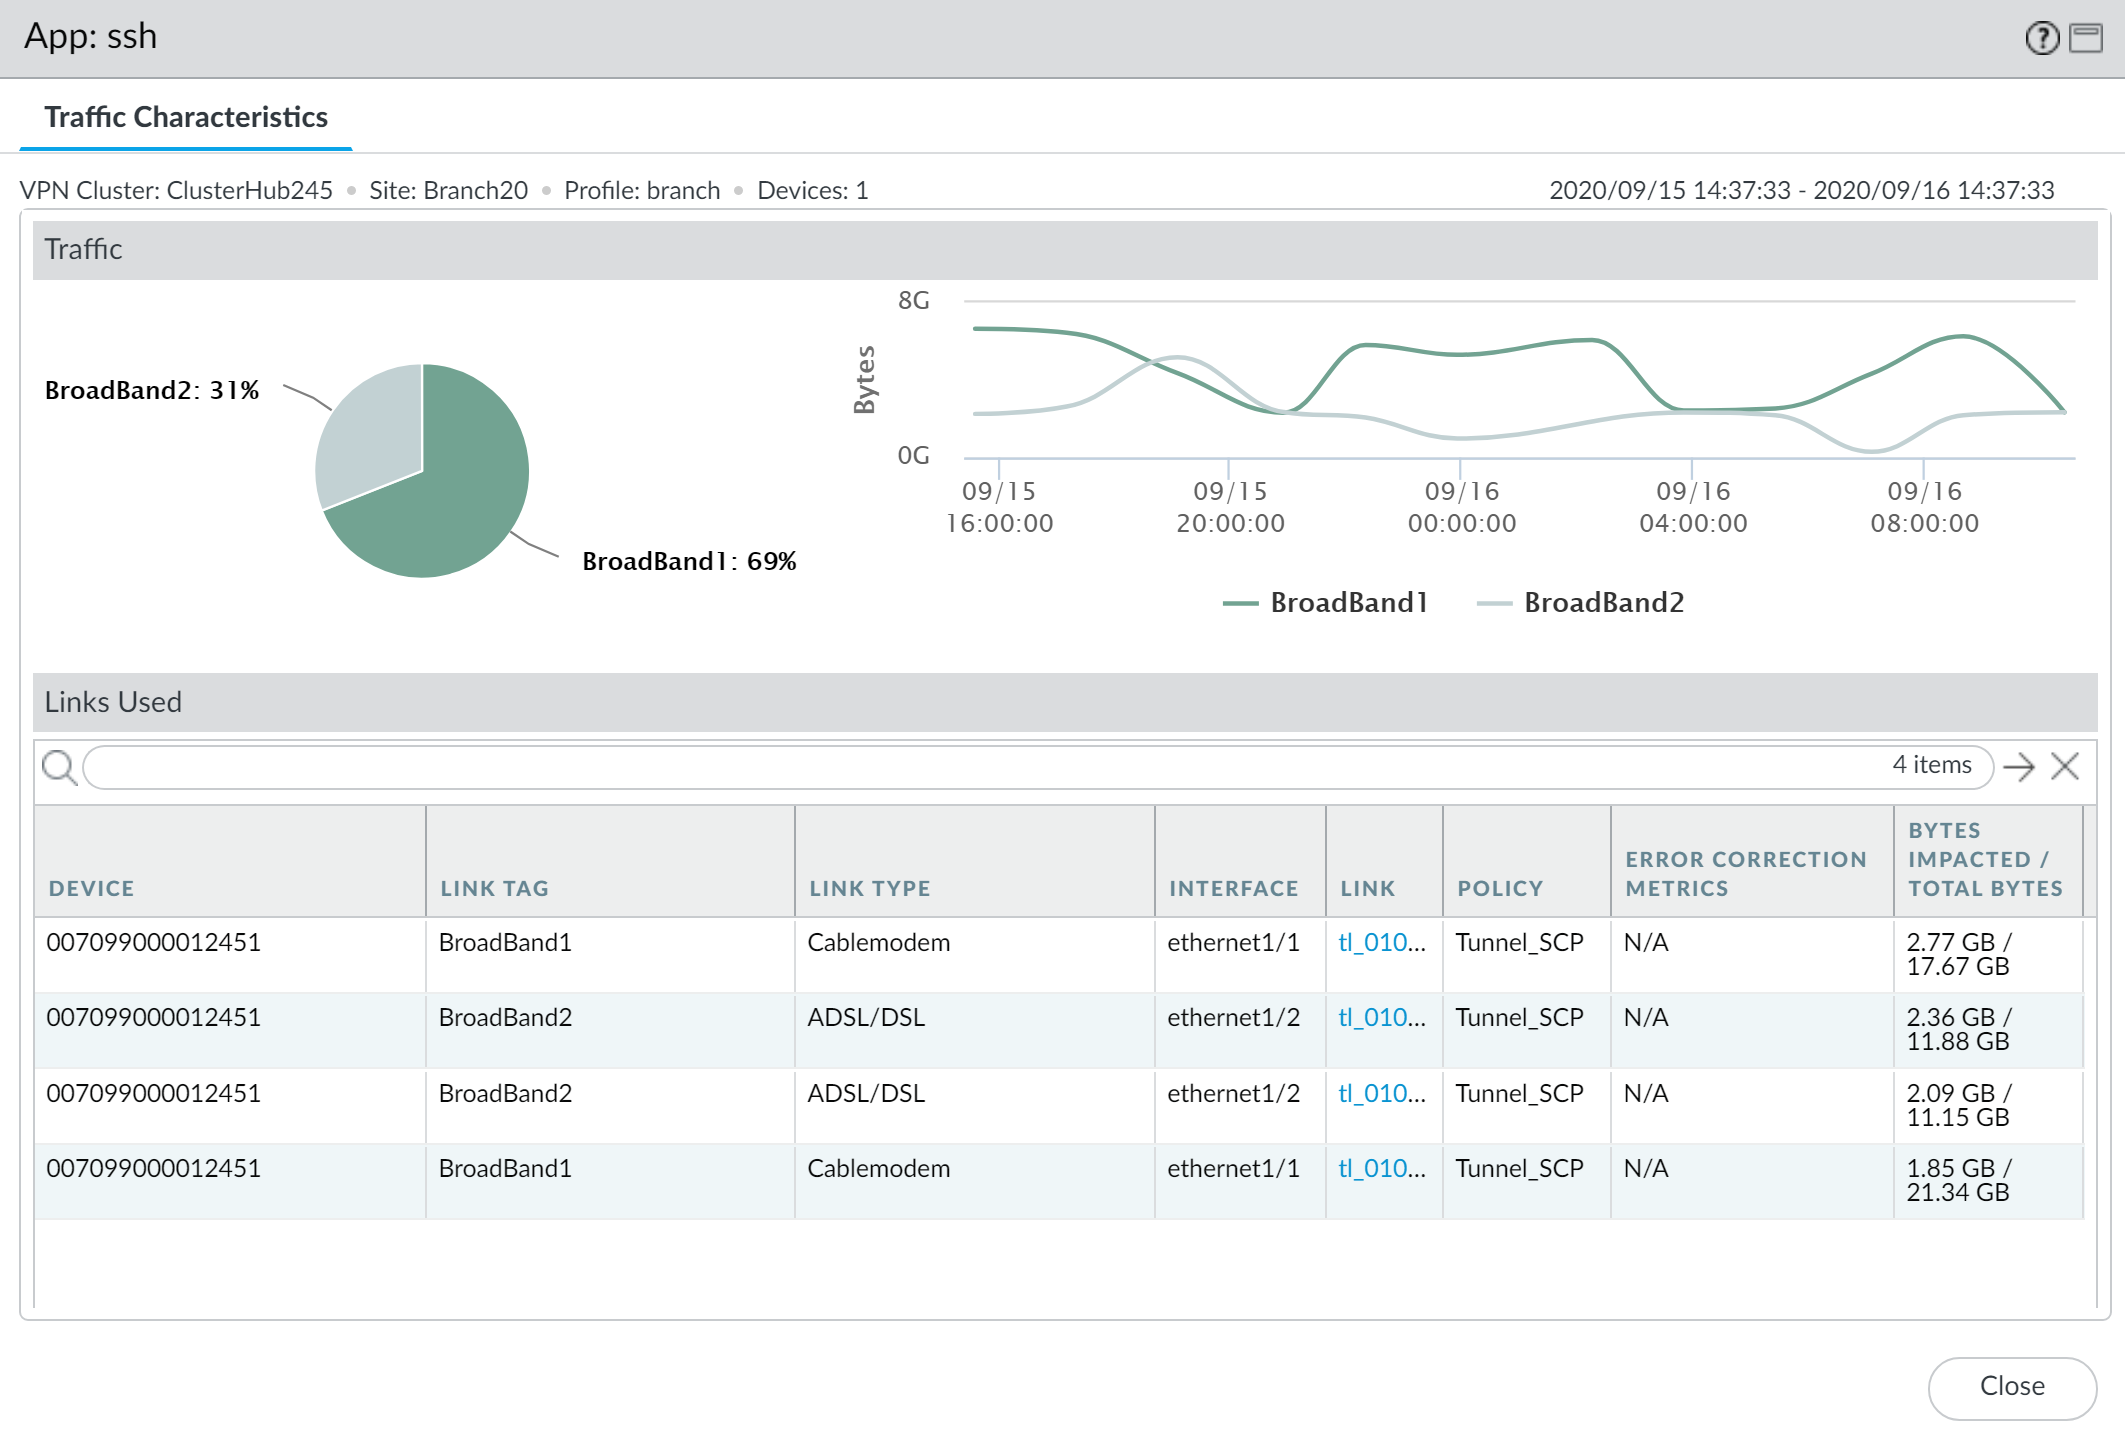
In the App Performance section, click an app to view detailed Traffic Characteristic information about the app traffic such as the internet service(s) and links used:- Review the pie chart to understand the breakdown of app traffic across the your internet services.
- Review the linegraph to understand how many bytes of data were transferred over each internet service over time.
- Review the Links Used section to understand which links the app traffic used and to understand how many of the bytes were impacted out of the total bytes in the selected time frame.
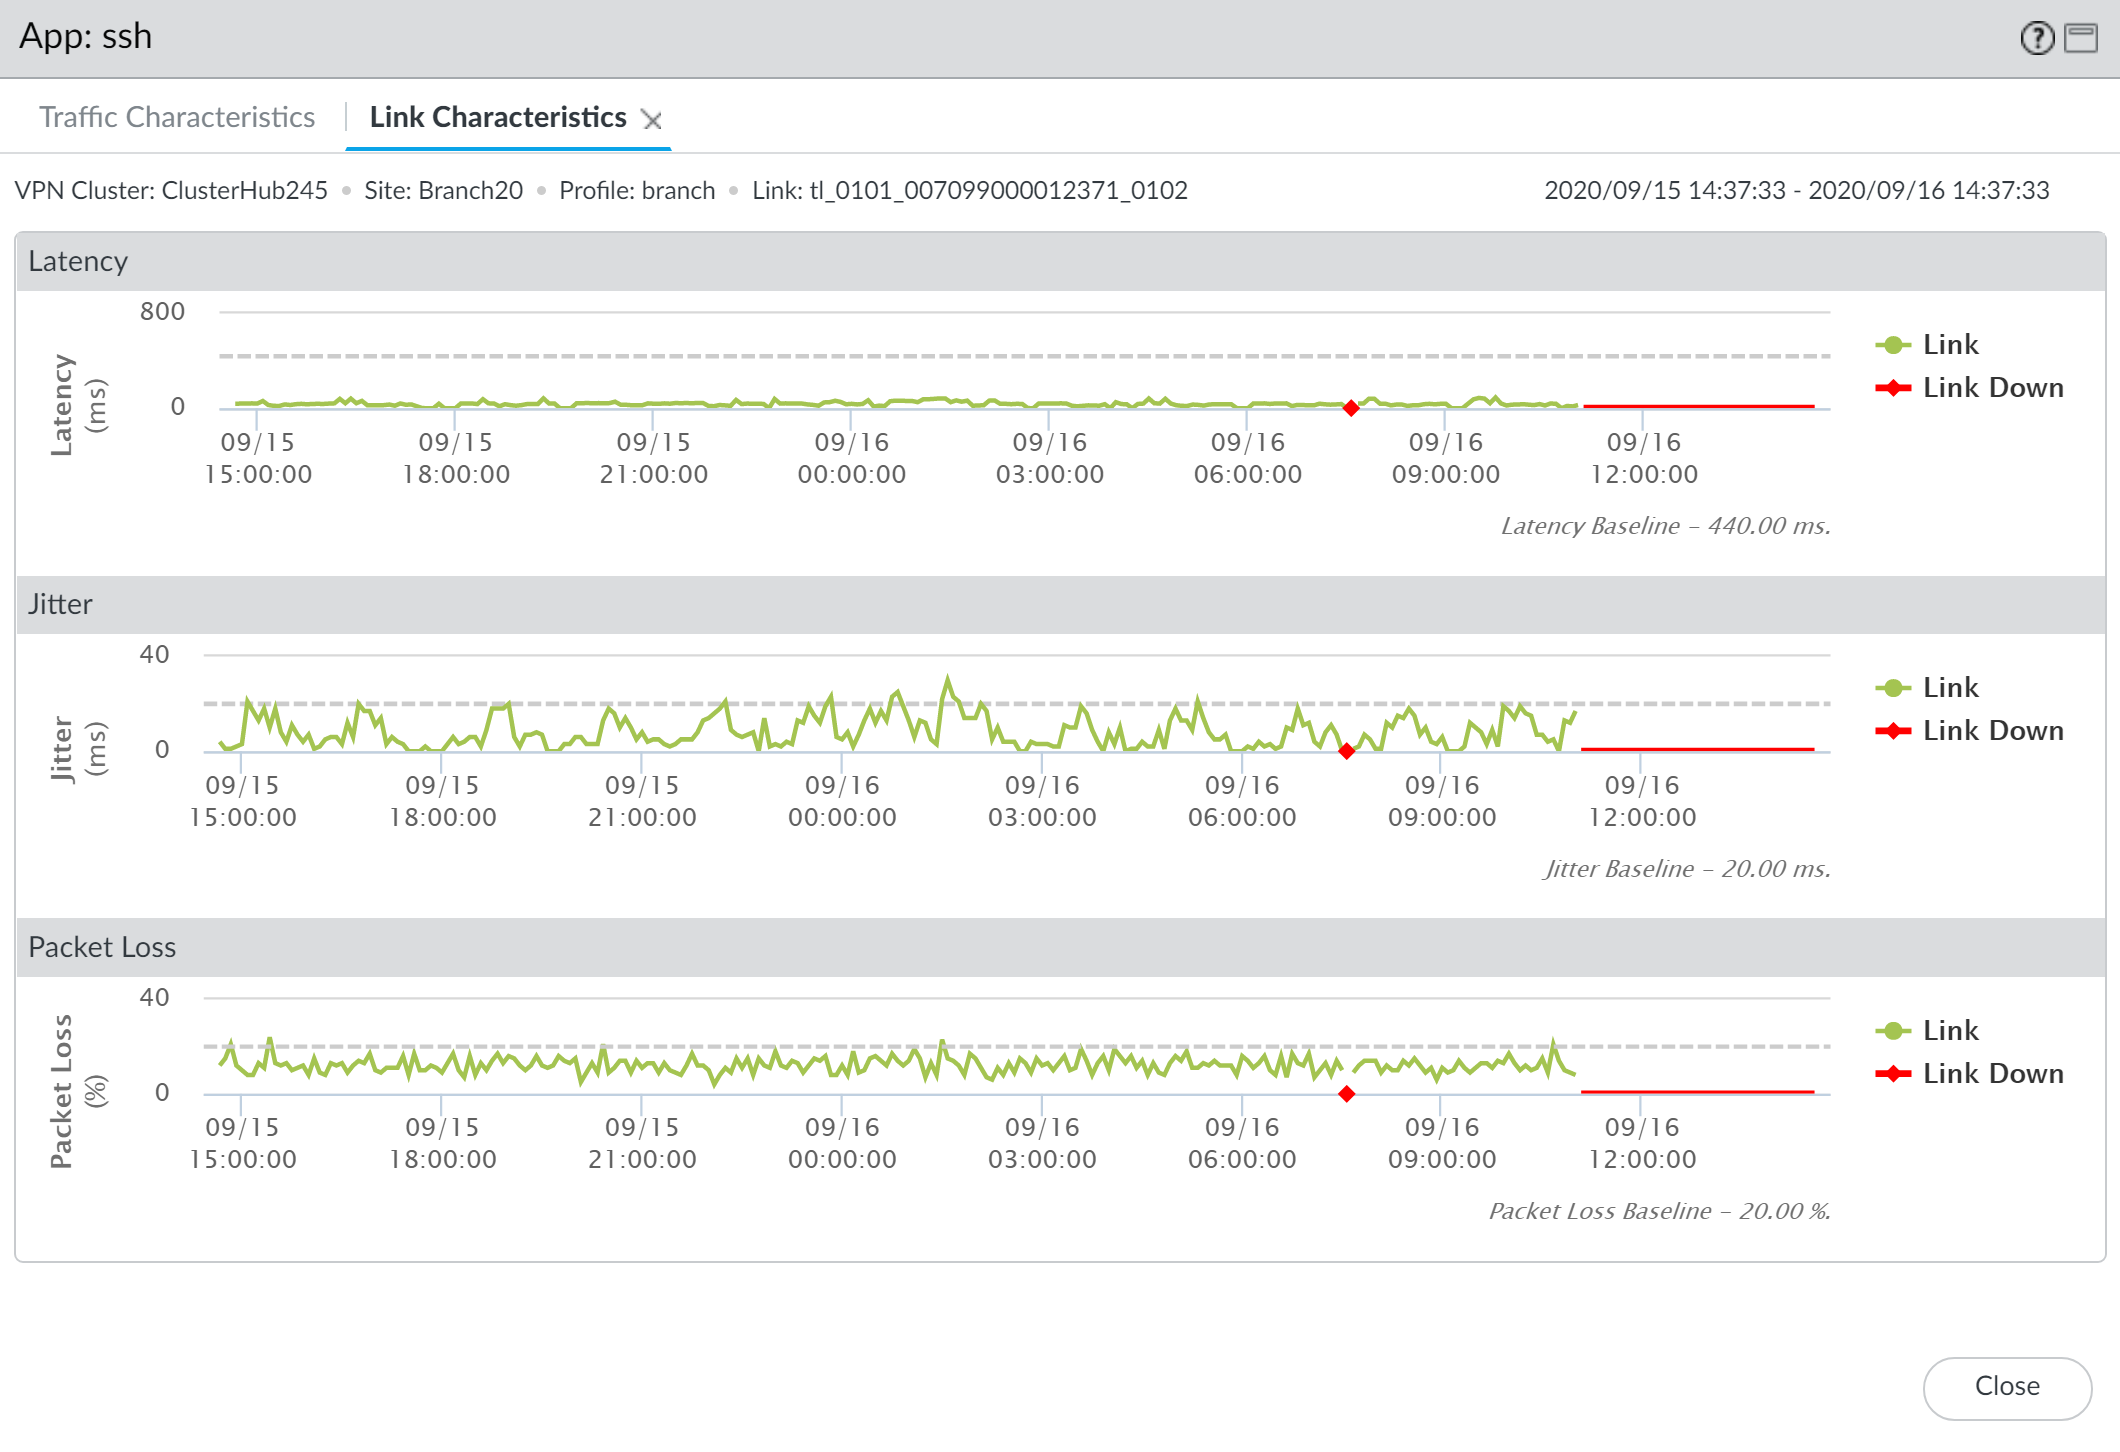
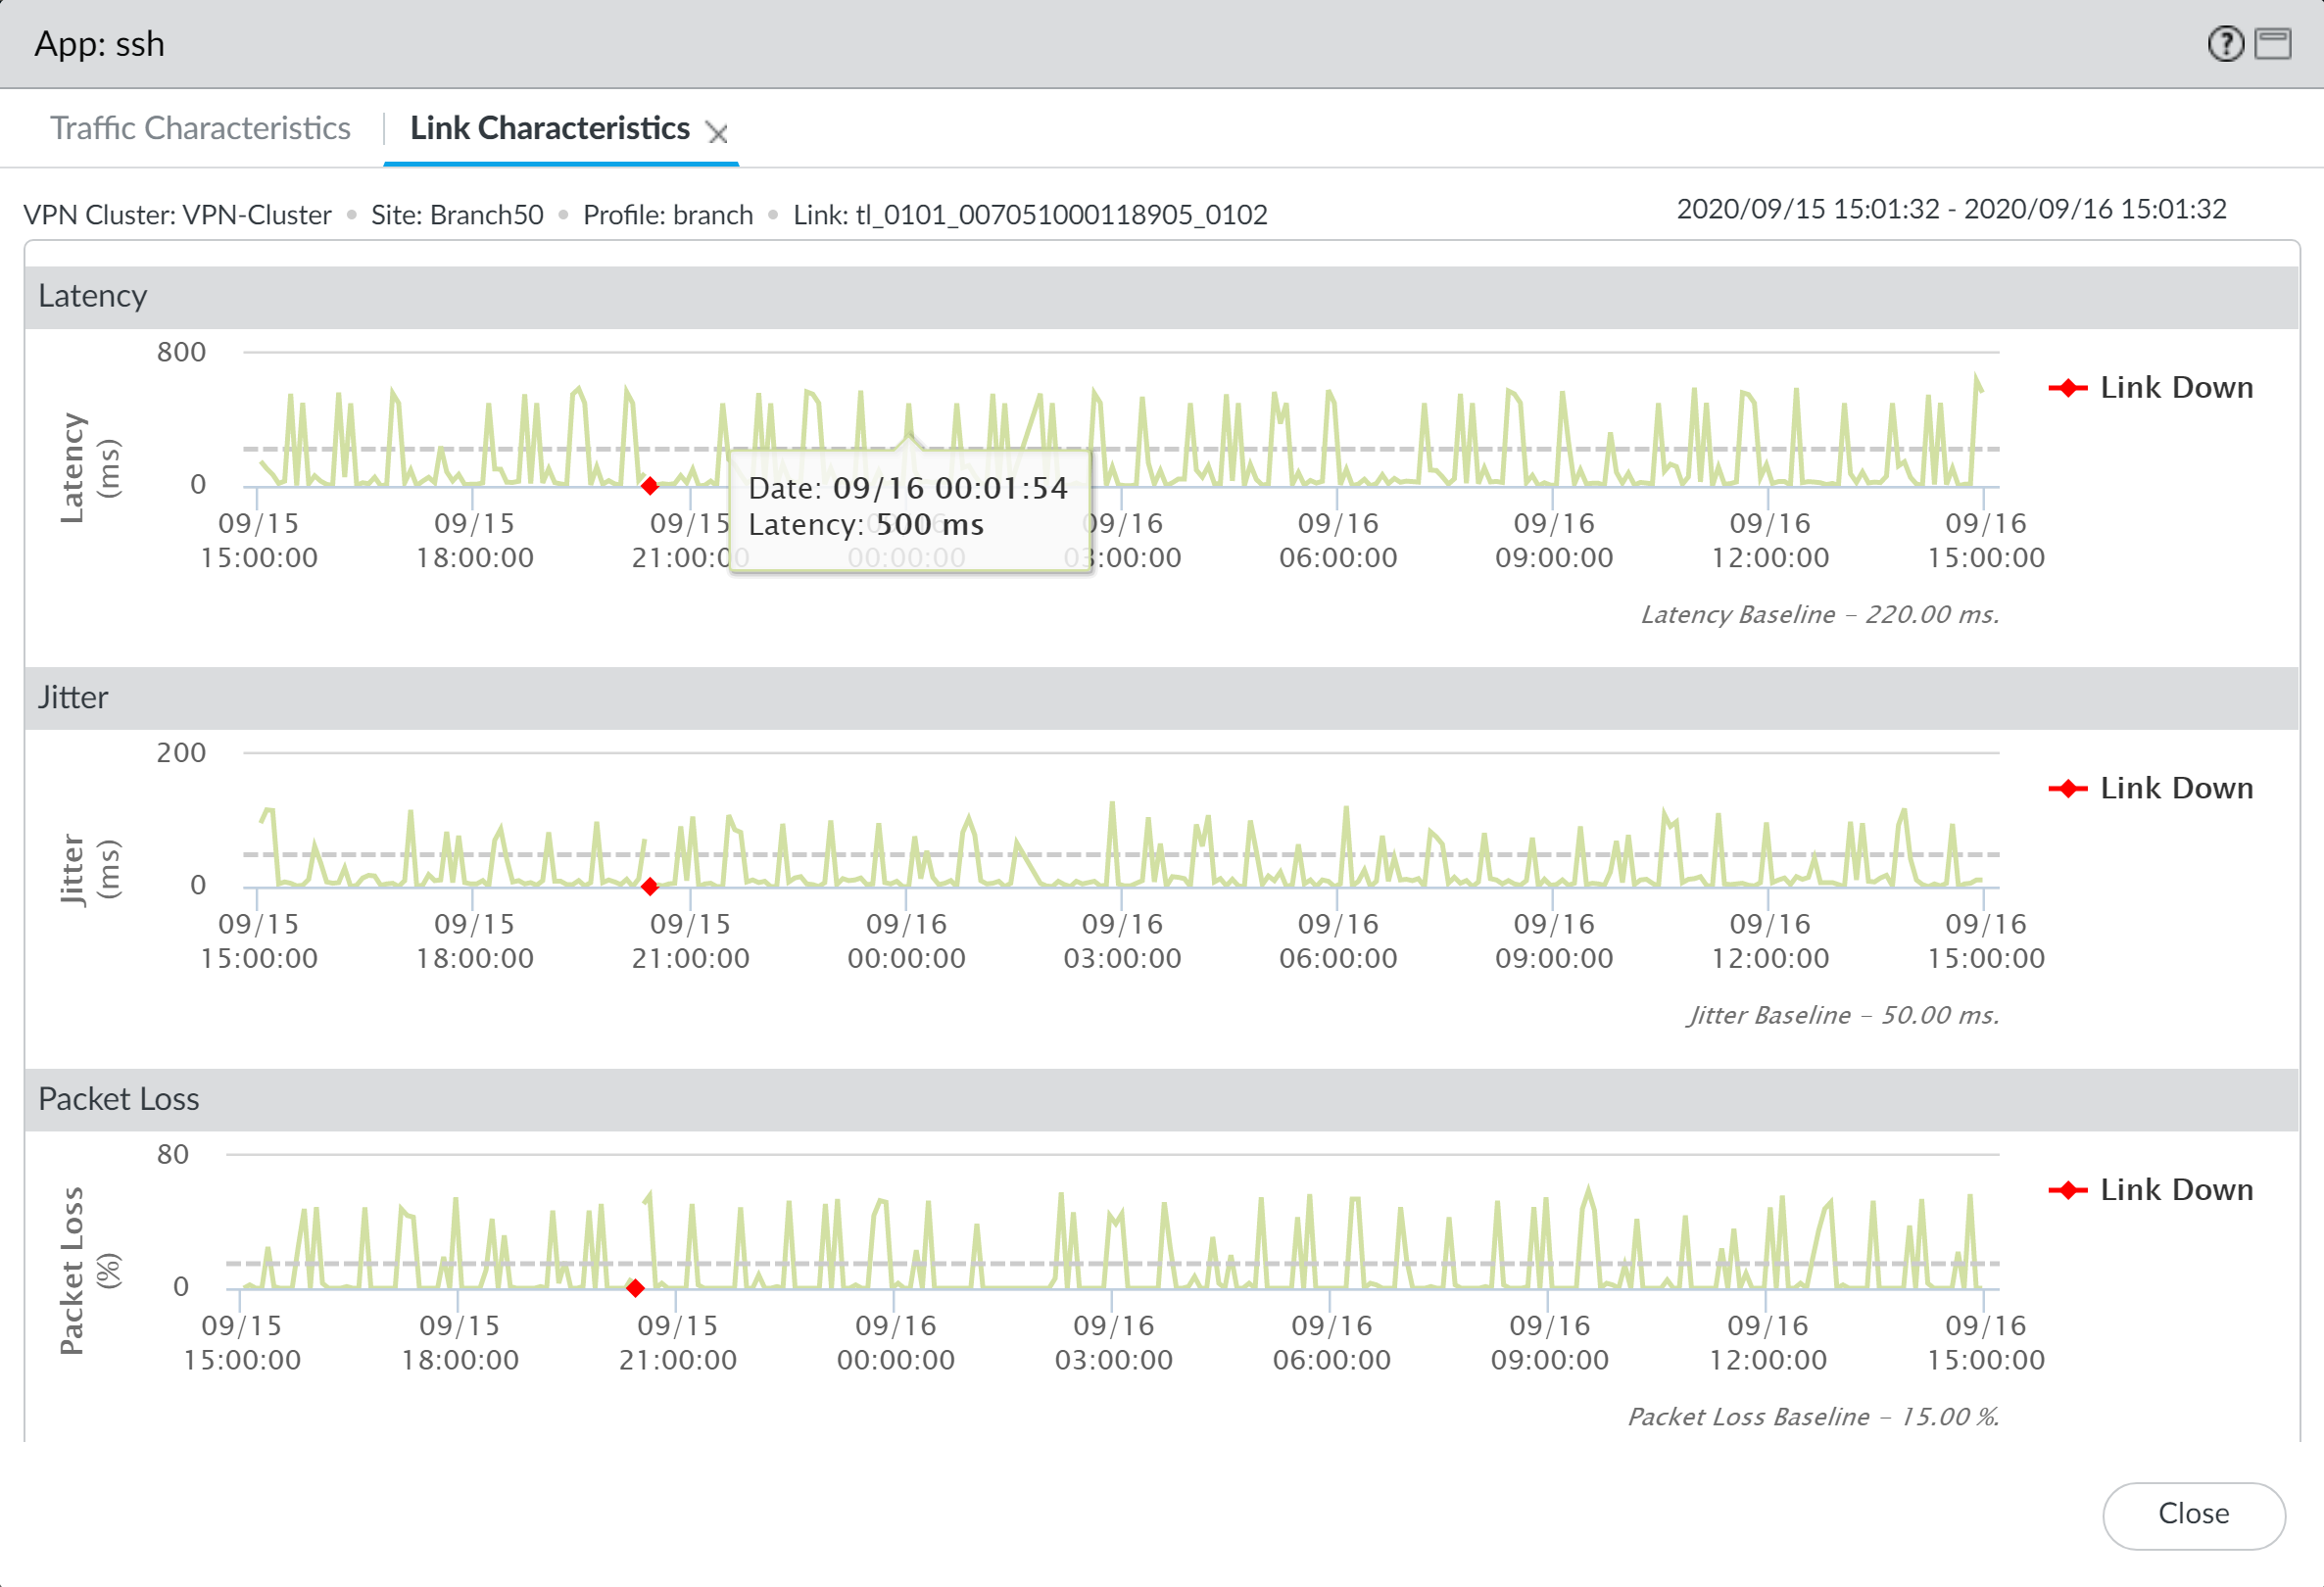
![]() Investigate which health metric caused the app to swap links.The dotted line indicates the threshold you configure when you define your custom SD-WAN application thresholds (using path quality profiles).
Investigate which health metric caused the app to swap links.The dotted line indicates the threshold you configure when you define your custom SD-WAN application thresholds (using path quality profiles).- In the Links Used section of the Traffic Characteristics tab, click an ethernet Link to view detailed Link Characteristics (latency, jitter, and packet loss) over the time frame specified in Step 2 to investigate what health metric caused the app to swap links. In this example, we are viewing ethernet 1/1 and can see that the percentage of packets lost regularly exceeded the configured threshold in the Path Quality Profile for the app and can conclude that this is the reason the app traffic failed over to the next best link.
![]() In the Traffic Characteristics tab, select another link to view the Link Characteristics. In this example, we are viewing ethernet 1/4 and can see that after the app traffic failed over, ethernet 1/4 experienced jitter for the app that exceeded the configured threshold. This forced the app traffic to fail over back to ethernet 1/1.Since both links had health metrics that were exceeded, the app traffic had no healthy link to fail over to resulting in the VPN cluster becoming impacted.
In the Traffic Characteristics tab, select another link to view the Link Characteristics. In this example, we are viewing ethernet 1/4 and can see that after the app traffic failed over, ethernet 1/4 experienced jitter for the app that exceeded the configured threshold. This forced the app traffic to fail over back to ethernet 1/1.Since both links had health metrics that were exceeded, the app traffic had no healthy link to fail over to resulting in the VPN cluster becoming impacted.![]() After you have identified why the app traffic is impacted, consider the following to resolve the issue:
After you have identified why the app traffic is impacted, consider the following to resolve the issue:- Consider adding additional links to the traffic distribution profile. By adding additional links for app traffic to fail over to, you help ensure that the app traffic and user experience are not impacted by links with degraded health.
- Reconfigure the health thresholds in your path quality profile. It may be that the health thresholds are too strict, resulting in unnecessary link fail over. For example, if you have an app that can experience up to 18% packet loss before user experience is impacted, having a 10% packet loss threshold would result in the app failing over to a different link without a need to.
- Consult your internet service providor (ISP) to determine if there are impacts to your network outside of your control that they can resolve.

