Home
EN
Location
Documentation Home
Palo Alto Networks
Support
Live Community
Knowledge Base
>
Clear
Application Experience Dashboard: Network Performance Metrics
Updated on
Fri Aug 29 07:37:17 PDT 2025
Focus
Download PDF
English
日本語 (Japanese)
中文 (Chinese Simplified)
繁體中文 (Chinese Traditional)
Español (Spanish)
Français (French)
Deutsch (German)
Updated on
Fri Aug 29 07:37:17 PDT 2025
Focus
Home
Strata Cloud Manager
Strata Cloud Manager Getting Started
Dashboards: Strata Cloud Manager
Dashboard: Application Experience
Application Experience Dashboard: Network Performance Metrics
Download PDF
English
日本語 (Japanese)
中文 (Chinese Simplified)
繁體中文 (Chinese Traditional)
Español (Spanish)
Français (French)
Deutsch (German)
Strata Cloud Manager
Application Experience Dashboard: Network Performance Metrics
Table of Contents
Filter
Expand All
|
Collapse All
Strata Cloud Manager Docs
Activation & Onboarding
Getting Started
AIOps
Release Notes
Previous
Application Experience Dashboard: Application Performance Metrics
Next
Dashboard: Best Practices
Application Experience
Dashboard
: Network Performance Metrics
Where Can I Use This?
What Do I Need?
Prisma Access
(with
Strata Cloud Manager
or
Panorama
configuration management)
Prisma Access
license
ADEM Observability
license to view the data for
Monitored Applications
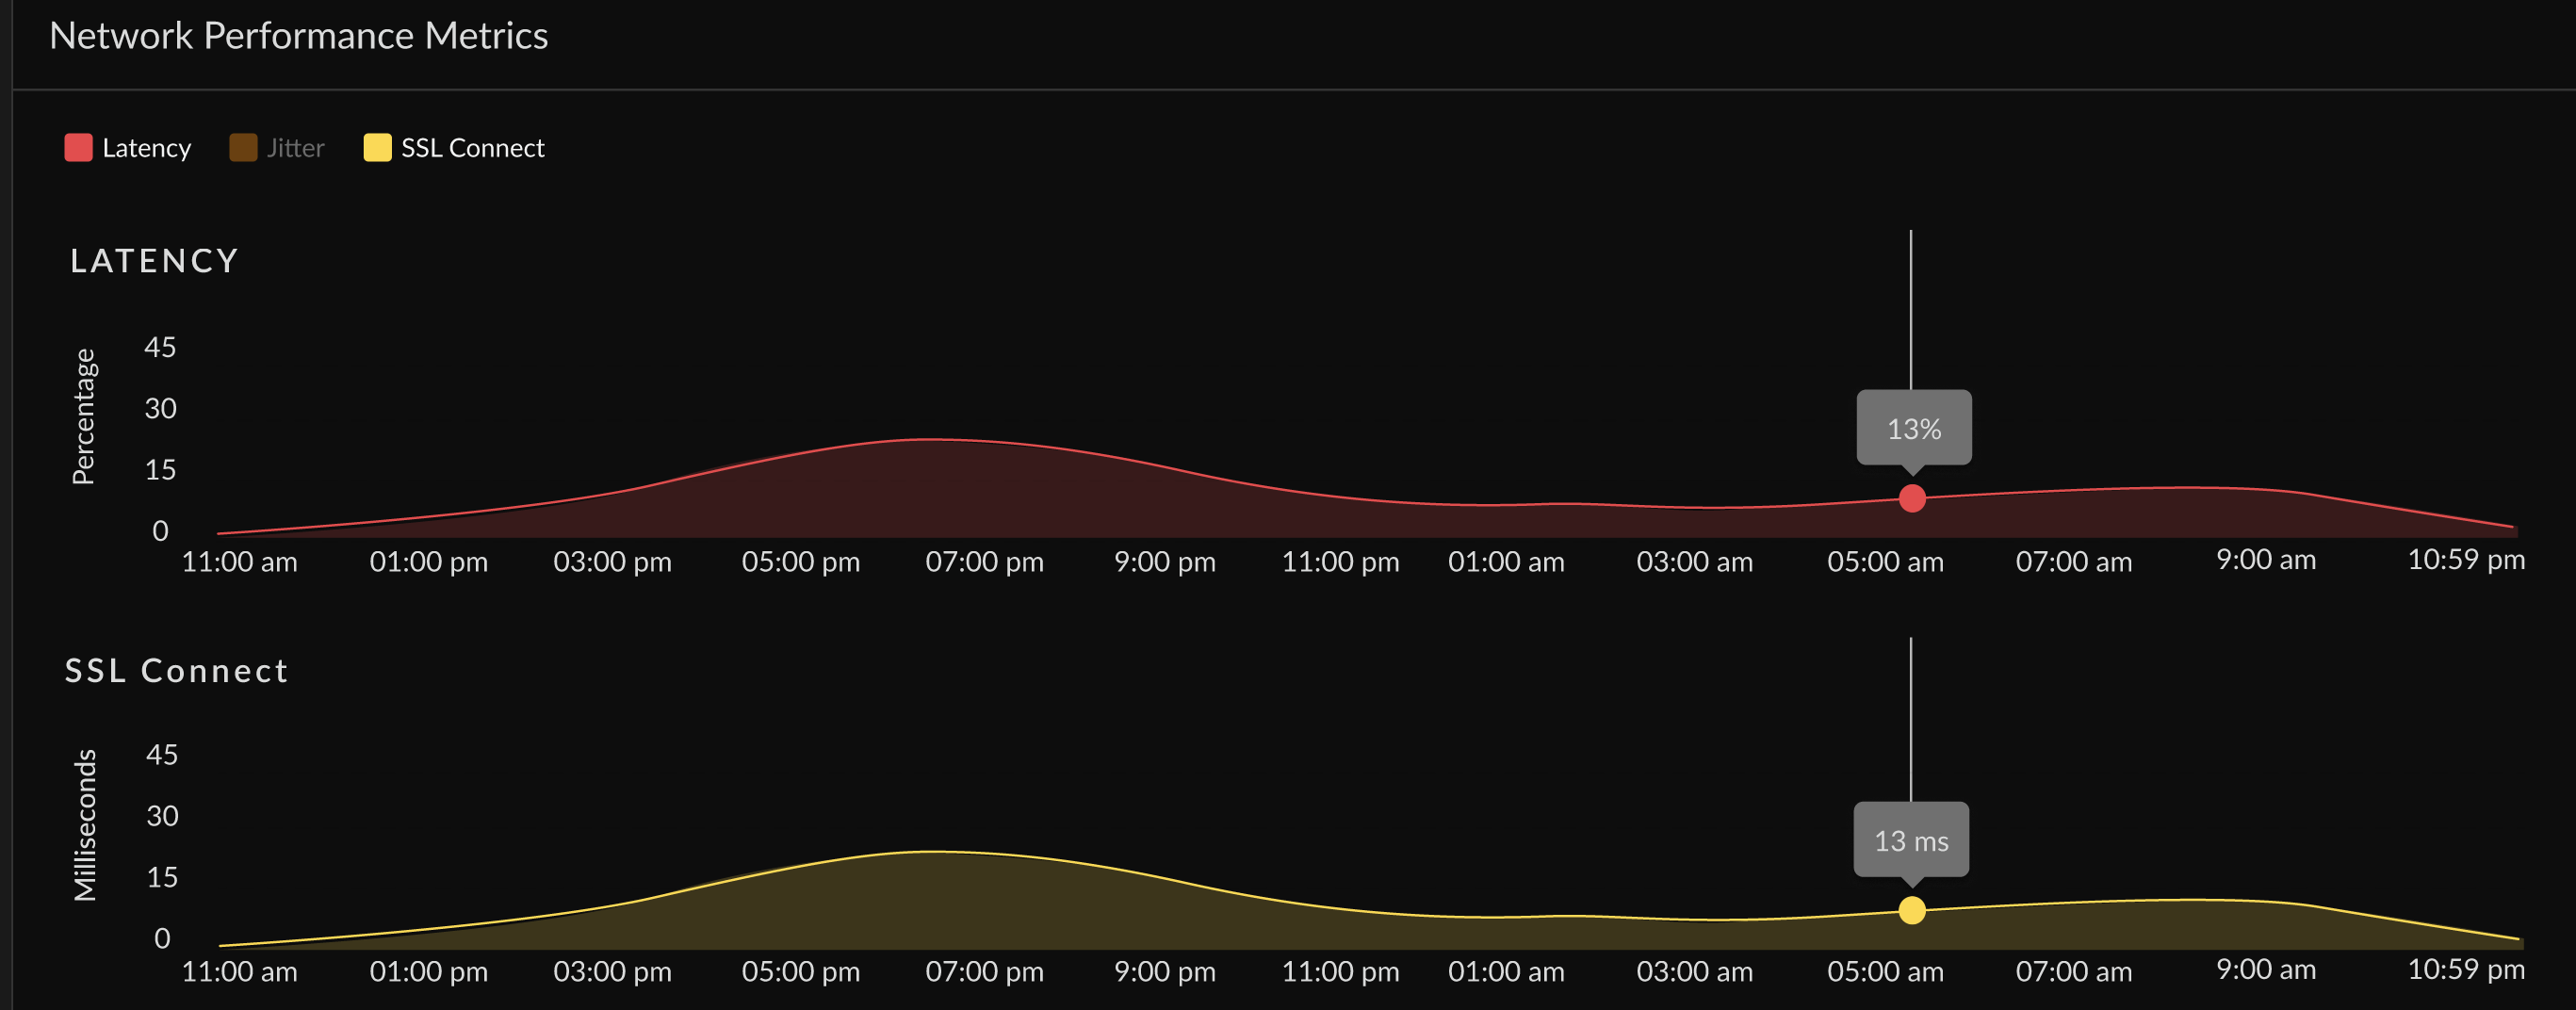
ADEM uses ICMP pings to determine Network Performance on each segment.
Metric
Description
Availability
Network availability metrics during the
Time Range
.
Network Latency
Time taken to transfer the data over the network.
Packet Loss
Loss of packets during data transmission.
Jitter
Change in latency during the
Time Range
.
Previous
Application Experience Dashboard: Application Performance Metrics
Next
Dashboard: Best Practices