Autonomous DEM
View Application Experience for Monitored Users
Table of Contents
View Application Experience for Monitored Users
Monitor your Mobile Users whether they are on premises or remote workers or hybrid
workers by setting up synthetic monitoring tests.
| Where Can I Use This? | What Do I Need? |
|---|---|
|
|
Monitor the digital experience for your SASE users and troubleshoot performance issues from the tab in Activity Insights. From here you get an
overall view of the experiences and the experience trend for all your ADEM users, as
well as a per-user view of the digital experience across your SASE environment. You can
drill down into details for the specific user who is reporting performance issues.
Immediately when you drill down, alerts at the top of the page highlight any experience
issues the specific user is having, such as low device memory or high CPU usage.
Monitored Users are defined as the unique number of User/Device combinations. For example, if 2
users are logged in to 3 devices each, the Devices count will display as 6 and the
Users count will display as 2. Likewise, if 2 users are using
the same device, the devices count will display 1 and the Users
count will display 2.
Devices with the ADEM Browser Plugin count toward the
number of user devices.
The Users | Devices table displays each User/Device combination as
a separate row, hence the user name could be duplicated across multiple rows depending
on the number of devices he/she is logged in to. This table provides a summary view of
all the user experiences in the network and shows how the experience is trending during
the selected Time Range.
Select or define a custom Time Range to view the data for only the time
window selected. Your time range selection determines the granularity of data displayed
in each histogram.
You can also use the search bar to quickly find a specific user, remote site, application, or Prisma Access location.
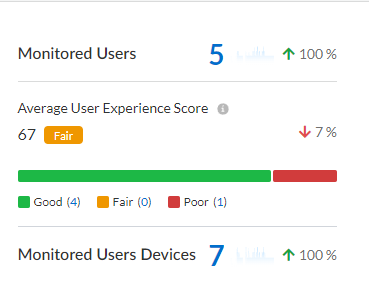
Monitored Users
View the total number of users that are being monitored by ADEM as well as the total
number of user devices that are being monitored. See the average user experience score
which is the experience score aggregated across all of the users monitored on ADEM. Go
to to view the Mobile User metrics, such as the number of connected users,
and the number of users and user devices being monitored.
View the details on each device that a Mobile User is connected from along with their
user experience score and the location from where they are connected. Click the
Self-Serve button to enable or disable Self-Serve on a user
or user group. Go to to view the Mobile User metrics, such as the number of connected users,
and the number of users and user devices being monitored.
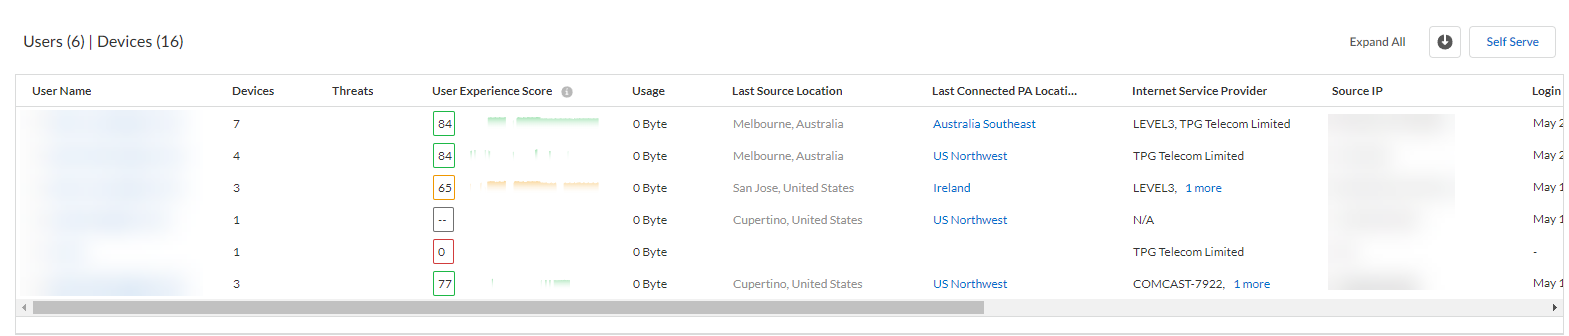
Users | Devices
| Column | Description |
|---|---|
| User Name | Name of the user |
| Devices | The number of devices that this user is connected from |
| Threats | Threat count |
| User Experience Score | Application Experience Score, which is averaged for all of the applications per user across the user devices |
| Usage | |
| Last Source Location | The latest geographical location from which the device connected to Prisma Access. |
| Last Connected PA Location | The most recent Prisma Access Location that the device connected to. |
| Internet Service Provider | Name of the Internet Service Provider that this device is using to connect |
| Source IP | |
| Login Time | The most recent time when the user logged into this device |
| OS Family/Version | The operating system installed on this device and its version |
| GlobalProtect Version | The version of GlobalProtect installed on this device |
| Self-Serve Notifications | How many Self-Serve notifications have been sent to this user's device |
| Self-Serve Status | Whether Self-Serve is Enabled or Disabled on this device for the user |