Autonomous DEM
Browser-Based Real User Monitoring for Real-Time Application Experience Visibility
Table of Contents
Expand All
|
Collapse All
Autonomous DEM Docs
-
-
- AI-Powered ADEM
- Autonomous DEM for China
-
-
Browser-Based Real User Monitoring for Real-Time Application Experience Visibility
Browser-Based RUM gives you a better understanding of user experience by
monitoring users' real-time interactions with applications.
| Where Can I Use This? | What Do I Need? |
|---|---|
|
|
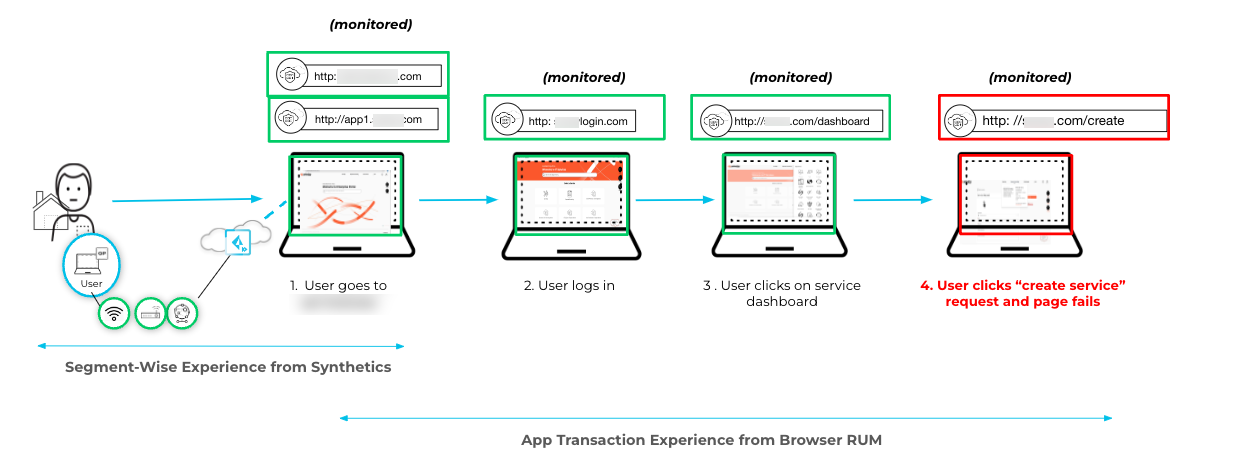
Browser-Based Real User Monitoring (RUM) uses a browser plugin to provide real-time visibility into
user experience of SaaS applications, other internet-based applications, and traffic
to applications in your own data center. This helps to reveal user experience issues
that synthetic tests may not detect so that you can have a more complete
understanding of user experience across your organization, take any possible
remediation steps, and work to increase user productivity and satisfaction.

RUM Benefits
- Broader View of User Experience: Gather metrics from users' actual interactions with browser applications to help you understand the full user journey and take the appropriate actions.
- Enhanced Troubleshooting: View real-time application availability, usability, and the performance of underlying dependencies, such as APIs or microservices, enabling quicker and more accurate troubleshooting.
- Faster Remediation: Combine RUM metrics with ADEM synthetic metrics to detect a wider range of performance degradation issues, identify root causes, and receive recommended remediation steps.
To get started with RUM:
- Install the ADEM Browser Plugin.Explore RUM data across your organization, for individual users, and for specific applications.
Install the ADEM Browser Plugin
To begin collecting RUM metrics for a user, an admin must install the ADEM Browser Plugin for the user.- Log in to Strata Cloud Manager.
- Sign in to the hub.Select Strata Cloud Manager.Add a policy rule that defines which users receive the ADEM Browser Plugin.
- Select ManageConfigurationPrisma Access Browser.Under Policy select RulesBrowser Customization.+ Add Rule.
![]() Define the policy rule settings.
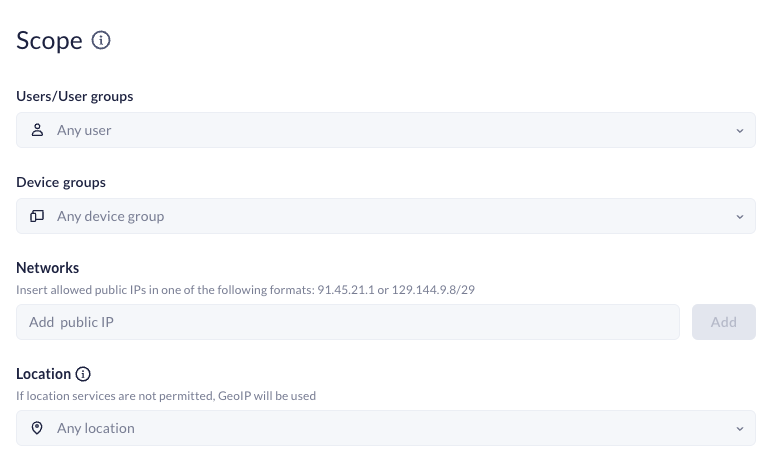
Define the policy rule settings.- Name the rule.Set the Scope to specify who will receive the ADEM Browser Plugin.
![]() Select Browser Customization Controls.Under Autonomous Digital Experience Management (ADEM)Real User Monitoring (RUM), + Set Value.
Select Browser Customization Controls.Under Autonomous Digital Experience Management (ADEM)Real User Monitoring (RUM), + Set Value.![]() Select Activate and Set.
Select Activate and Set.![]() Save the policy rule.Verify that ADEM is collecting RUM data.
Save the policy rule.Verify that ADEM is collecting RUM data.- In Strata Cloud Manager, select InsightsApplication Experience and see whether RUM metrics are available on ADEM dashboards.


