Monitor Data Center Block Rules and Tune the Rulebase
Table of Contents
Monitor Data Center Block Rules and Tune the Rulebase
Monitor traffic that you explicitly block so that you
can investigate potential attacks and evaluate whether you should
allow any of the blocked traffic.
Developing a best practice security policy
is an iterative process. As soon as you Create
Data Center Traffic Block Rules, start monitoring traffic
that matches the block rules designed to identify policy gaps, unexpected
behaviors, and potential attacks. Tune your application allow rules
to account for traffic that matches the block rules but should be
allowed and investigate traffic that may indicate an attack.
Reports
on blocked traffic contain valuable information you can use to investigate
potential issues. Keep the block rules in the rulebase to protect
your valuable data center assets and provide that information when
traffic matches a block rule.
Follow content update best practices to
keep your firewall protection up-to-date. Maintain
the Data Center Best Practice Rulebase includes specific
best practices for data center firewalls.
- Create custom reports to monitor traffic that
matches the block rules designed to identify policy gaps and potential
attacks.
- Select .
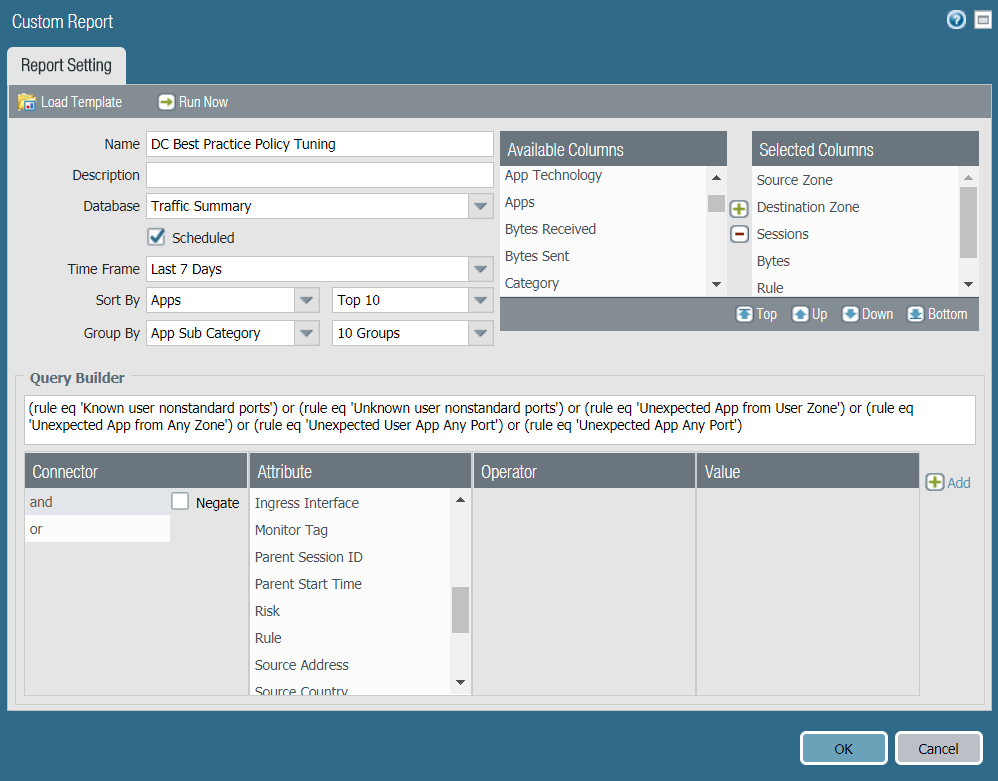
- Add a report and give it a Name that describes the report’s purpose, in this example DC Best Practice Policy Tuning.
- Set the Database to Traffic Summary. (This also changes the default Selected Columns; the default columns are Source Zone, Destination Zone, Sessions, and Bytes.)
- Select the Scheduled box.
- From Available Columns, add Application, Risk of App, Rule, and Threat to the Selected Columns list. If there are other types of information you want to monitor, select those as well.
- Set the desired Time Frame, Sort By, and Group By values, in this example Last 7 Days, Apps, and App Sub Category, respectively.
- Define the query to match traffic hitting the rules designed to find policy gaps and potential attacks. You can create a single report for traffic that matches any of the rules using the or operator, or create individual reports to monitor each rule. In the Query Builder, specify the name of each rule you want to include in the report. This example uses the names of the six blocking rules designed to find policy gaps and uses the Or operator to include information about traffic that matches any of the rules:
- (rule eq ‘Known user nonstandard ports’)
- (rule eq ‘Unknown user nonstandard ports’)
- (rule eq ‘Unexpected App from user Zone’)
- (rule eq ‘Unexpected App from any Zone’)
- (rule eq ‘Unexpected User App Any Port’)
- (rule eq ‘Unexpected App Any Port’)
![]()
- Review the report (or reports) regularly to make sure you understand why traffic matches each block rule and either update policy to include legitimate applications and users, or use the information to assess the risk of traffic that matches the rules.