Enterprise DLP
View Email DLP Incident Details
Table of Contents
Expand All
|
Collapse All
Enterprise DLP Docs
View Email DLP Incident Details
View the DLP incident details for traffic that matches your an Email DLP policy rule
on Strata Cloud Manager.
- Log in to Strata Cloud Manager.Select ConfigurationData Loss PreventionDLP Incidents.Filter and group the Incidents list to narrow down the DLP incidents you want to investigate.
- Scan Date—Enterprise DLP supports filtering DLP incidents generated in the Past 60 Minutes, Past 3 Hours, Past 24 Hours, Past 7 Days, Past 30 Days, or Past 90 Days.
- Add Filters—Add the Channels filter and select Email DLP. Add any additional filters to narrow down the scope of DLP incidents.Palo Alto Networks recommends using the Data Profile filter. This filter displays all DLP incidents triggered by a specific data profile.For the Regions filter, Enterprise DLP generates incidents in the Region where the Public Cloud Server is located.When Palo Alto Networks introduces a new Public Cloud Server, Enterprise DLP automatically resolve to it if it’s closer to where the inspected traffic originated.This might mean that new DLP incidents generated after the release of a new Public Cloud Server are generated in a different Region.
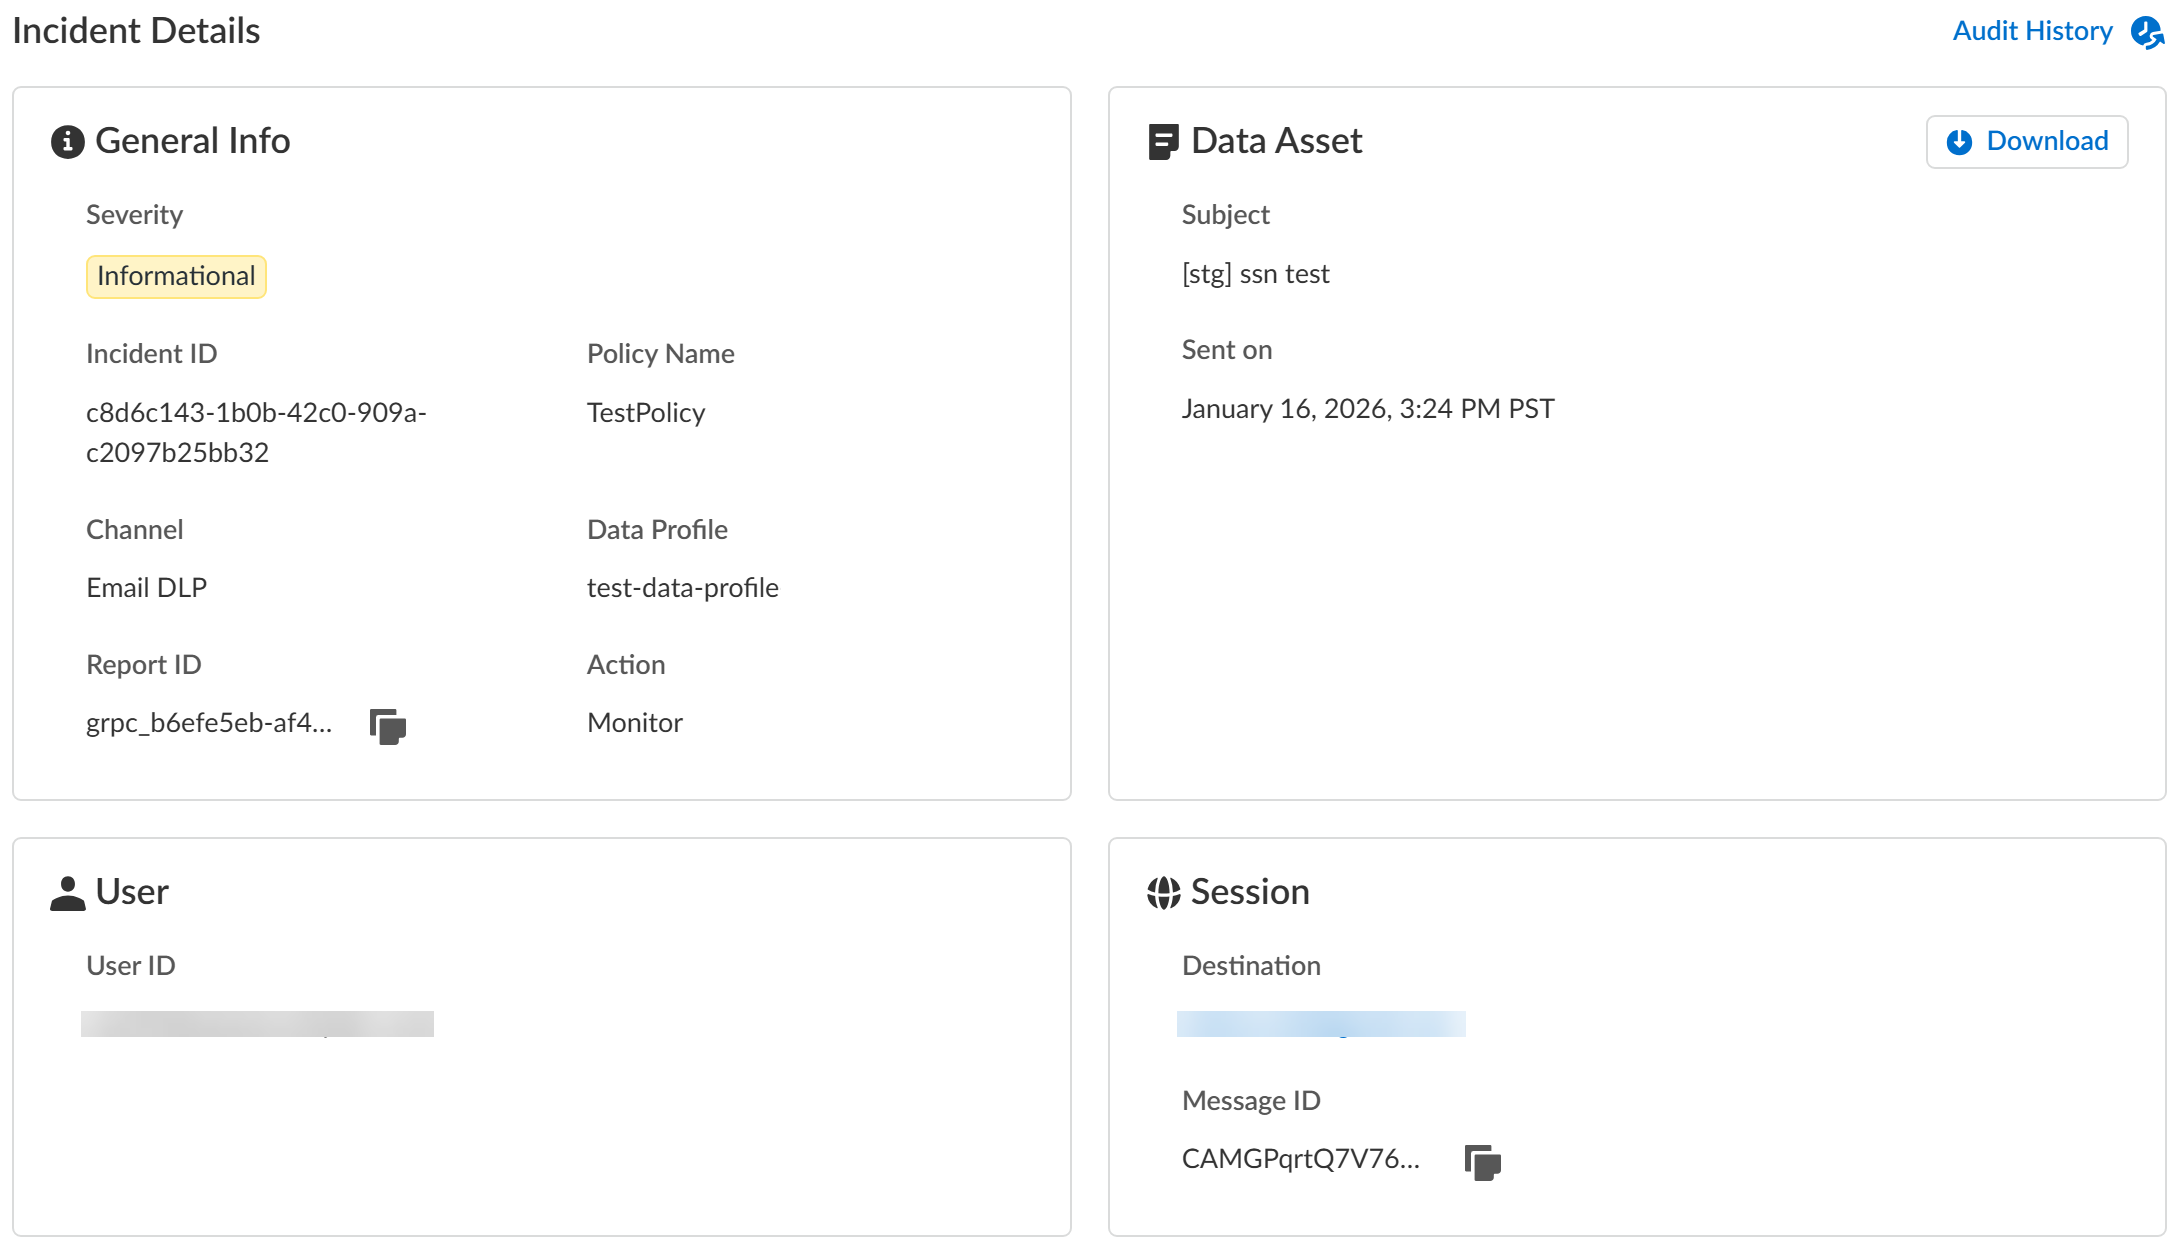
Review the Incidents list and click the Incident ID to view the DLP incident details.You can also select and assign one or more incidents to a specific data security administrator to investigate and resolve as part of y our Enterprise DLP incident case management process from this list.Review the Incident Details to review specific incident details.Make note of the Report ID for the DLP incident if you have not already done so. Use the Report ID to view additional Traffic log details regarding the DLP incident.- General InfoThe General Info panel displays high-level information about the DLP incident.
- Incident Creation Time—Date and time a user generated the DLP incident. Format is DD Month YYYY H:MM <AM or PM> <Timezone>.
- Severity—Incident severity configured in the Email DLP policy rule.
- Incident ID—Unique ID for the DLP incident.
- Channel—The enforcement point that forwarded traffic to Enterprise DLP through which the incident occurred. Displays Email DLP.
- Data Profile—Data profile that traffic matched against that generated the incident.
- Report ID—Unique ID used to view additional Traffic log details regarding the DLP incident.
- Action—The action Enterprise DLP took on the traffic that matched your Email DLP policy rule.
- Data Asset
- Subject—Subject line of the email that generated the DLP incident.
- Sent On—Date and time a user generated the DLP incident. Format is DD Month YYYY H:MM <AM or PM> <Timezone>
- User
- User ID—Email of the user who sent the email that generated the DLP incident.
- Session
- Destination—Email of the recipient for the email that generated the DLP incident.
- Message ID—Globally unique identifier for the email defined by RFC 5322. Enterprise DLP extracts the message ID from the email header.
- Exception RuleName of the granular data profile DLP exception rule that generated the DLP incident.Displays Not Applicable if the DLP incident was not generated because it matched an exceptionr rule.
- Response ManagementThe Response Management section allows your data security administrator to allow or deny an exemption request submitted by an end user through End User Coaching.
- Case ManagementManually manage your DLP incidents to efficiently handle data security incident resolution across your security channels.
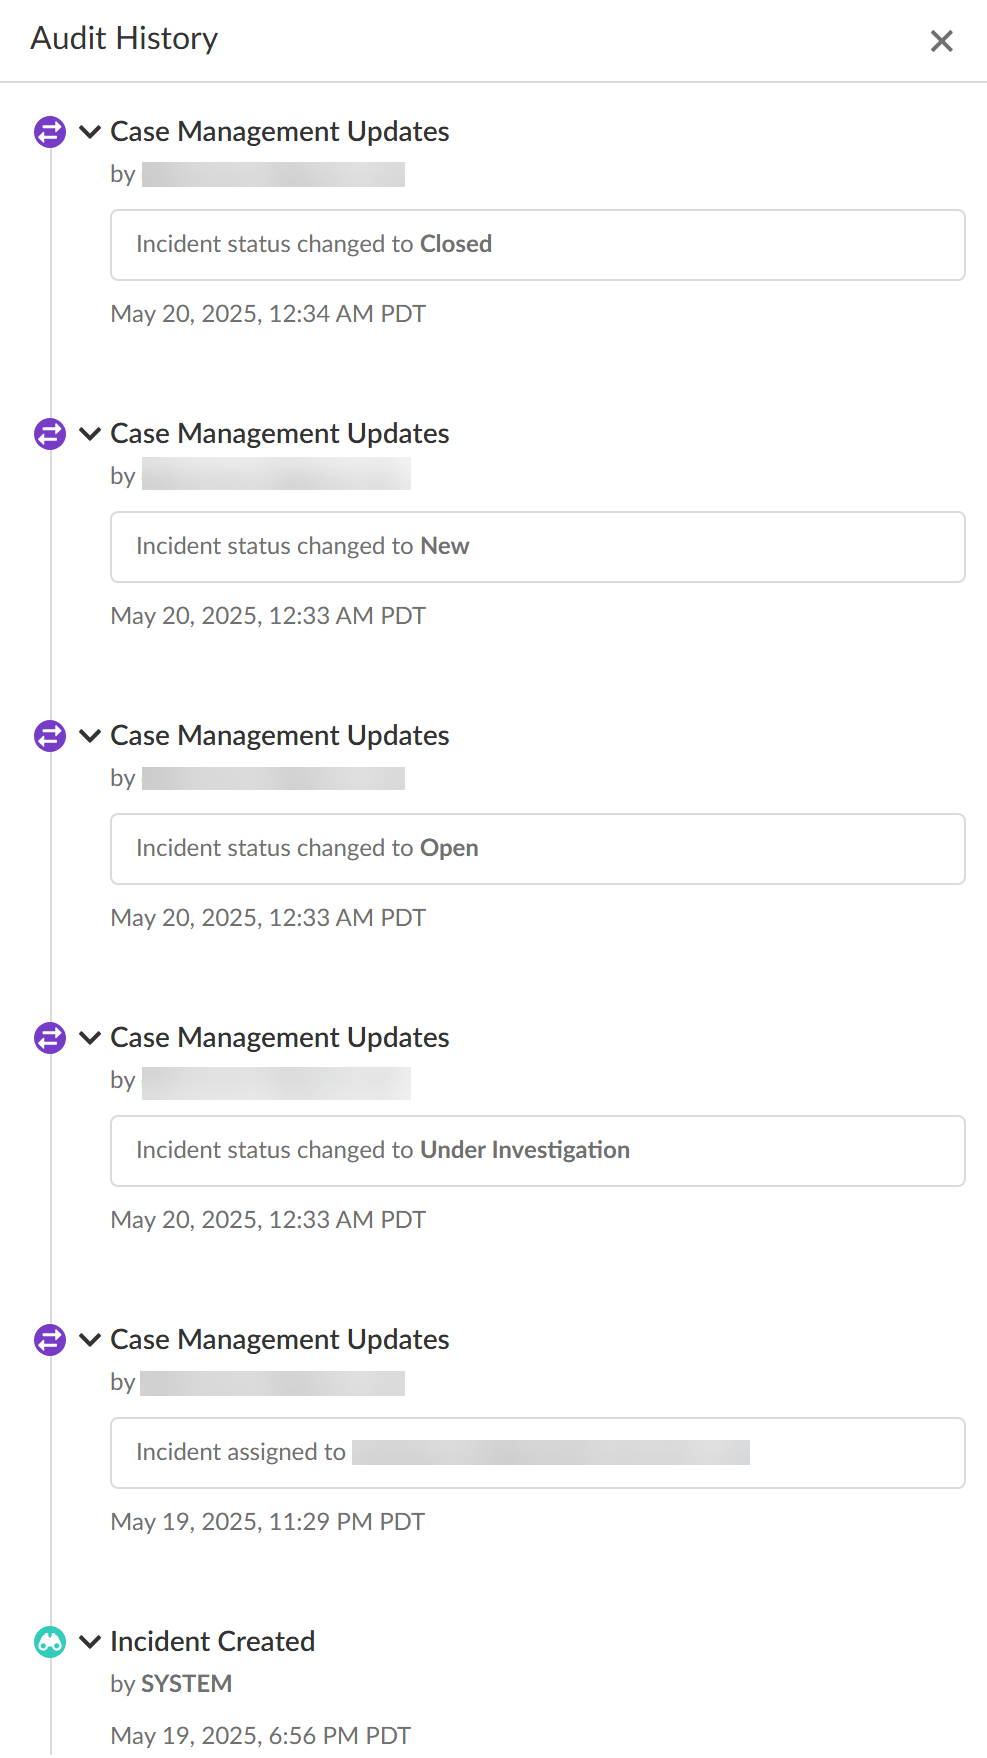
- Audit HistoryThe Audit History shows you the full Incident Case Management history for the specific DLP incident. It outlines every step of the case management process and the specific action taken by each user from when the incident case was assigned to when it was closed.
![]()
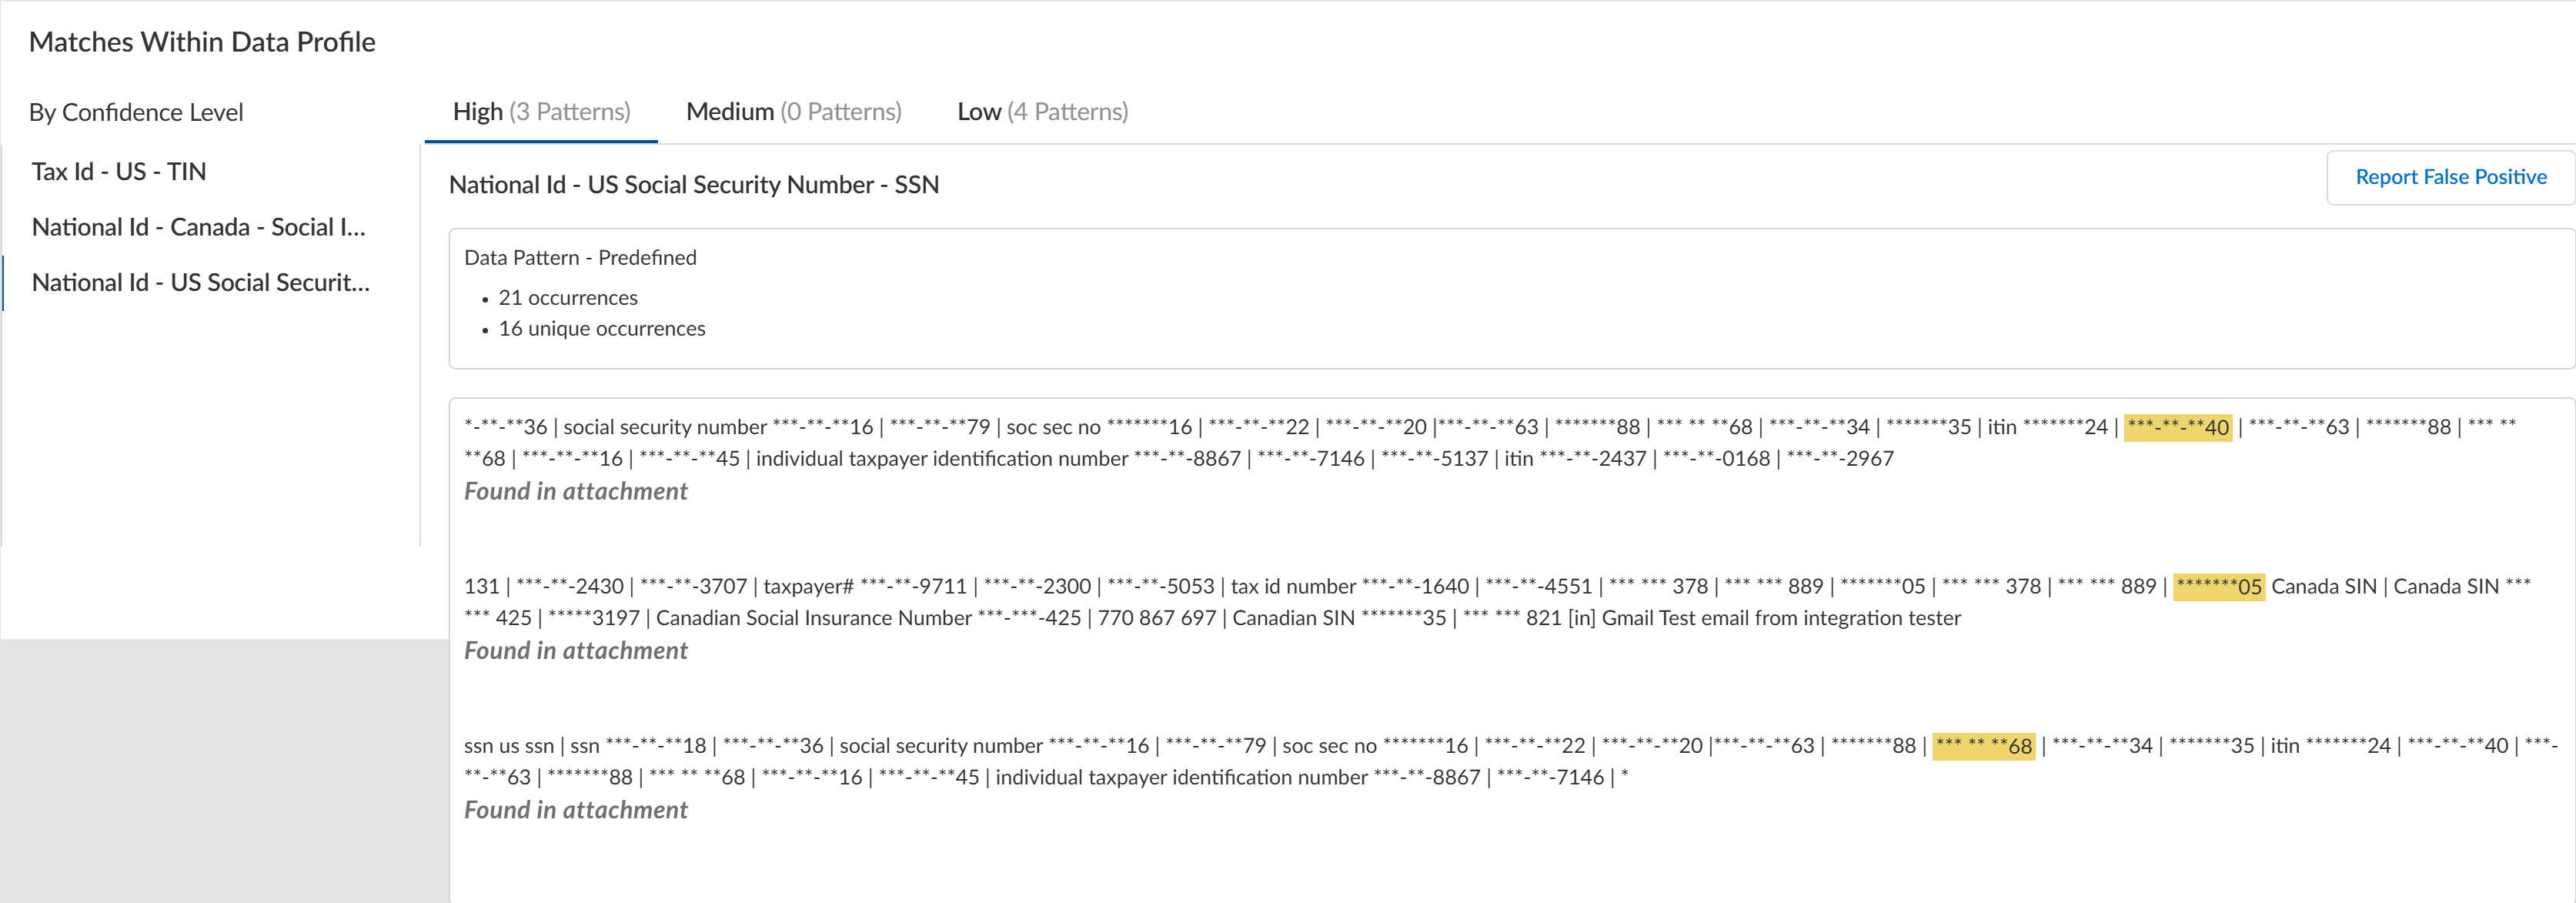
![]() Review the Matches within Data Profiles to review snippets of matching traffic and the data patterns that matched the traffic to better understand what sensitive data Enterprise DLP detected.Toggle the Triggered Incidents to display only the data patterns that contain matched criteria.
Review the Matches within Data Profiles to review snippets of matching traffic and the data patterns that matched the traffic to better understand what sensitive data Enterprise DLP detected.Toggle the Triggered Incidents to display only the data patterns that contain matched criteria.- Enterprise DLP generates an audit log when a user accesses a DLP incident and reviews the associated snippet.
- Enterprise DLP displays the proximity keyword and the corresponding snippet of sensitive data that generated the DLP incident.Proximity keywords for predefined data patterns are case insensitive and display exactly as detected in the snippet. Proximity keywords for custom data patterns and data dictionaries are case sensitive.For custom regex data patterns, Enterprise DLP displays only the first proximity keyword for sensitive data with a High Confidence match.
- When viewing a data pattern, Enterprise DLP displays the total number of Occurrences as well as the number of Unique Occurrences for all High, Medium, and Low Confidence detections.
- (File Property data pattern) File size of the file that generated the DLP incident.
- (EDM data sets) Enterprise DLP displays the column header of the EDM data set that matches the detected sensitive data. Enterprise DLP displays multiple column headers when sensitive data is detected in multiple different columns.
- Click Report False Positive if Enterprise DLP incorrectly detected and took action on the file or network traffic that it should not have. This is referred to as a false positive detection. Report a false positive detection to Palo Alto Networks to improve Enterprise DLP detection accuracy for yourself and other Enterprise DLP users.
![]() Review the file log to learn about the traffic data for the DLP incident.
Review the file log to learn about the traffic data for the DLP incident.- Select Incidents & AlertsLog Viewer.From the Firewall drop-down, select File.Filter to view the file log for the DLP incident using the Report ID.Report ID = <report-id>Review the file log to learn more about the traffic data for the DLP incident.Manage your Enterprise DLP incidents.


