Network Security
View the Tunnel Status
Table of Contents
View the Tunnel Status
| Where Can I Use This? | What Do I Need? |
|---|---|
|
|
The status of the tunnel informs you about whether or not valid IKE phase-1 and
phase-2 SAs have been established, and whether the tunnel interface is up and
available for passing traffic.
Because the tunnel interface is a logical interface, it can’t indicate a physical
link status. Therefore, you must enable tunnel monitoring so that the tunnel
interface can verify connectivity to an IP address and determine if the path is
still usable. If the IP address is unreachable,
the firewall
can take action accordingly, that is, the firewall will either
wait for the tunnel to recover or
failover.
When a failover occurs, the existing tunnel is torn down, and routing changes are
triggered to set up a new tunnel and redirect
traffic. You
can specify the number of heartbeats to wait before taking the specified action. You
can also specify the interval between heartbeats to trigger the specified action.
For tunnel monitoring, a monitor status of down is an indicator that the destination
IP address being monitored is not reachable, and off indicates that the tunnel
monitor is not configured.
You can view the following status of an IPSec VPN tunnel:
- IPSec tunnel status—Provides the connection status for an IPSec VPN session.
- IKE gateway status—Provides the IKE phase 1 SA status
- VPN flow or tunnel interface status—Provides the IPSec tunnel interface status
You can also execute the show commands in the
command-line interface to view status information about active IPSec tunnels. The
show commands display status output for all the IPSec tunnels, and it also displays
tunnel information individually when you specify the tunnel ID.
View the Tunnel Status ()
View the IPSec VPN Tunnel status of the firewalls in PAN-OS.
- Select .View the Tunnel Status.
- Green indicates a valid IPSec SA tunnel.
- Red indicates that IPSec SA isn’t available or has expired.
View the IKE Gateway Status.- Green indicates a valid IKE phase-1 SA.
- Red indicates that IKE phase-1 SA isn’t available or has expired.
View the Tunnel Interface Status.- Green indicates that the tunnel interface is up.
- Red indicates that the tunnel interface is down, because tunnel monitoring is enabled and the status is down.
To troubleshoot a VPN tunnel that isn’t yet up, see Interpret VPN Error Messages.View the Tunnel Status (Strata Cloud Manager)
View the IPSec VPN Tunnel status of the firewalls in the Strata Cloud Manager.- Log in to Strata Cloud Manager.Select and select Monitor.Select the Configuration Scope to view the IPSec VPN tunnel status. You can select a folder or firewall from your Folders to monitor the IPSec VPN tunnel that you created on the firewalls:
- To view the status of the IPSec tunnels on all the firewalls, select the All Firewalls folder.
- To view the status of the IPSec tunnels for the group of firewalls associated with a folder, select the specific folder.
- To view the status of the IPSec tunnels on a specific firewall, select the firewall.
- If you have created the VPN cluster using Auto VPN, then monitor those tunnels in the Auto VPN () page.
- You can monitor only on-premises firewalls and not the components managed by Prisma Access.
- Monitoring is disabled at the Global and snippet level. Therefore, you can create an IPSec tunnel in the global or snippet configuration scope, but you can monitor the IPSec tunnel only in the folder or firewall level.
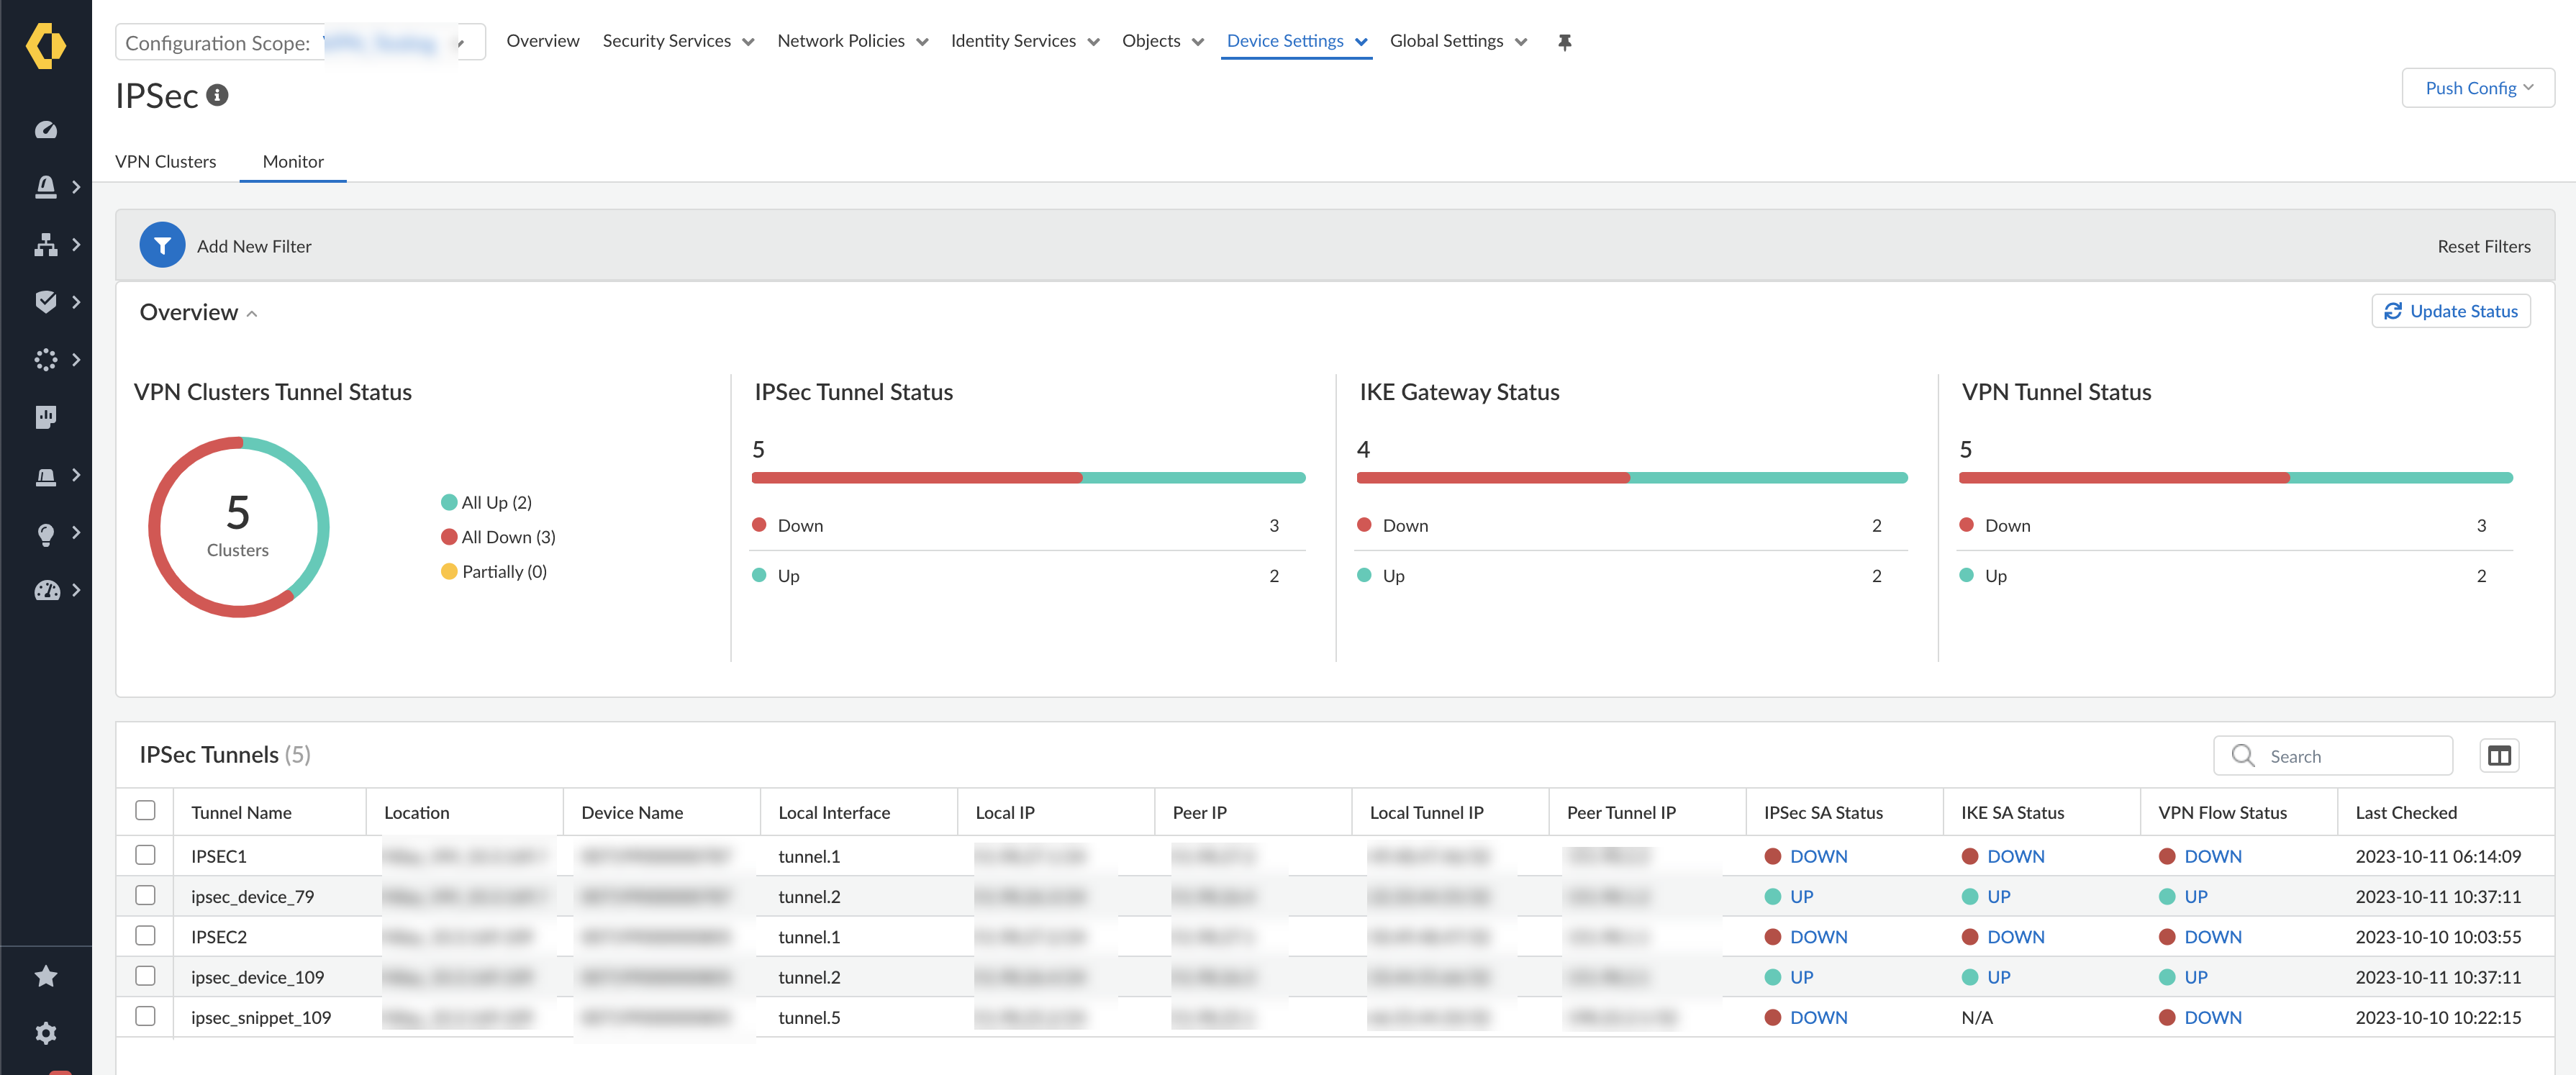
![]() View the VPN Cluster Tunnel Status that provides the graphical representation of the number of tunnels that are up, the number of tunnels that are down, and the number of tunnels that are partially up.View the IPSec SA Status in IPSec Tunnels.
View the VPN Cluster Tunnel Status that provides the graphical representation of the number of tunnels that are up, the number of tunnels that are down, and the number of tunnels that are partially up.View the IPSec SA Status in IPSec Tunnels.- Green (UP) indicates a valid IPSec SA tunnel. Select UP to view detailed information about the IPSec tunnel.
- Red (DOWN) indicates that IPSec SA isn’t available or has expired. Select DOWN to view the detailed information to interpret the reason for failure.
View the IKE SA Status in IPSec Tunnels.- Green (UP) indicates a valid IKE phase-1 SA. Select UP to view detailed information about the IKE gateway.
- Red (DOWN) indicates that IKE phase-1 SA isn’t available or has expired. Select DOWN to view the detailed information to interpret the reason for failure.
View the VPN Flow Status for VPN traffic flow information in IPSec Tunnels.- Green (UP) indicates that the IPSec tunnel is up. Select UP to view detailed information about the VPN traffic flow.
- Red (DOWN) indicates that the IPSec tunnel is down. Select DOWN to view the detailed information to interpret the reason for failure.
Select Add New Filter, and select the field to view the results based on the selected field. For example, Add New Filter by selecting the Device Name from the list, to view the IPSec tunnel status for the selected device.![]() Select Reset Filtersto remove one or more filters.
Select Reset Filtersto remove one or more filters.![]() Select Update Status to update all the IPSec tunnel monitoring data present at that level (firewall, folder, or all firewalls).
Select Update Status to update all the IPSec tunnel monitoring data present at that level (firewall, folder, or all firewalls).