Access Zoom Application Experience Data
Table of Contents
Access Zoom Application Experience Data
Access the zoom application data
Prisma SD-WAN shows you the Zoom application experience data at an
individual user level. You can navigate to this data from the following
dashboards:
- Go to .
![]() The Application screen shows you the following widgets:
The Application screen shows you the following widgets:- Application Health Distribution: The distribution of good, fair, and poor applications for a given tenant.
- Application Health Distribution Over Time: The time series graph of application health distribution over time displays the good, fair, and poor applications for a given tenant. The time-series graph should be computed and refreshed based on the selected duration. For example, supported durations are 1 hour, 3 hours, one day, seven days, 30 days, and 90 days and the interval is 1 minute, 5 minutes, 1 hour, and one day, respectively.
- Applications: Lists all the applications details under TCP Apps such as Name, Health Score, Associated Sites, Traffic Volume, Init/Failure, and Transaction Failure.
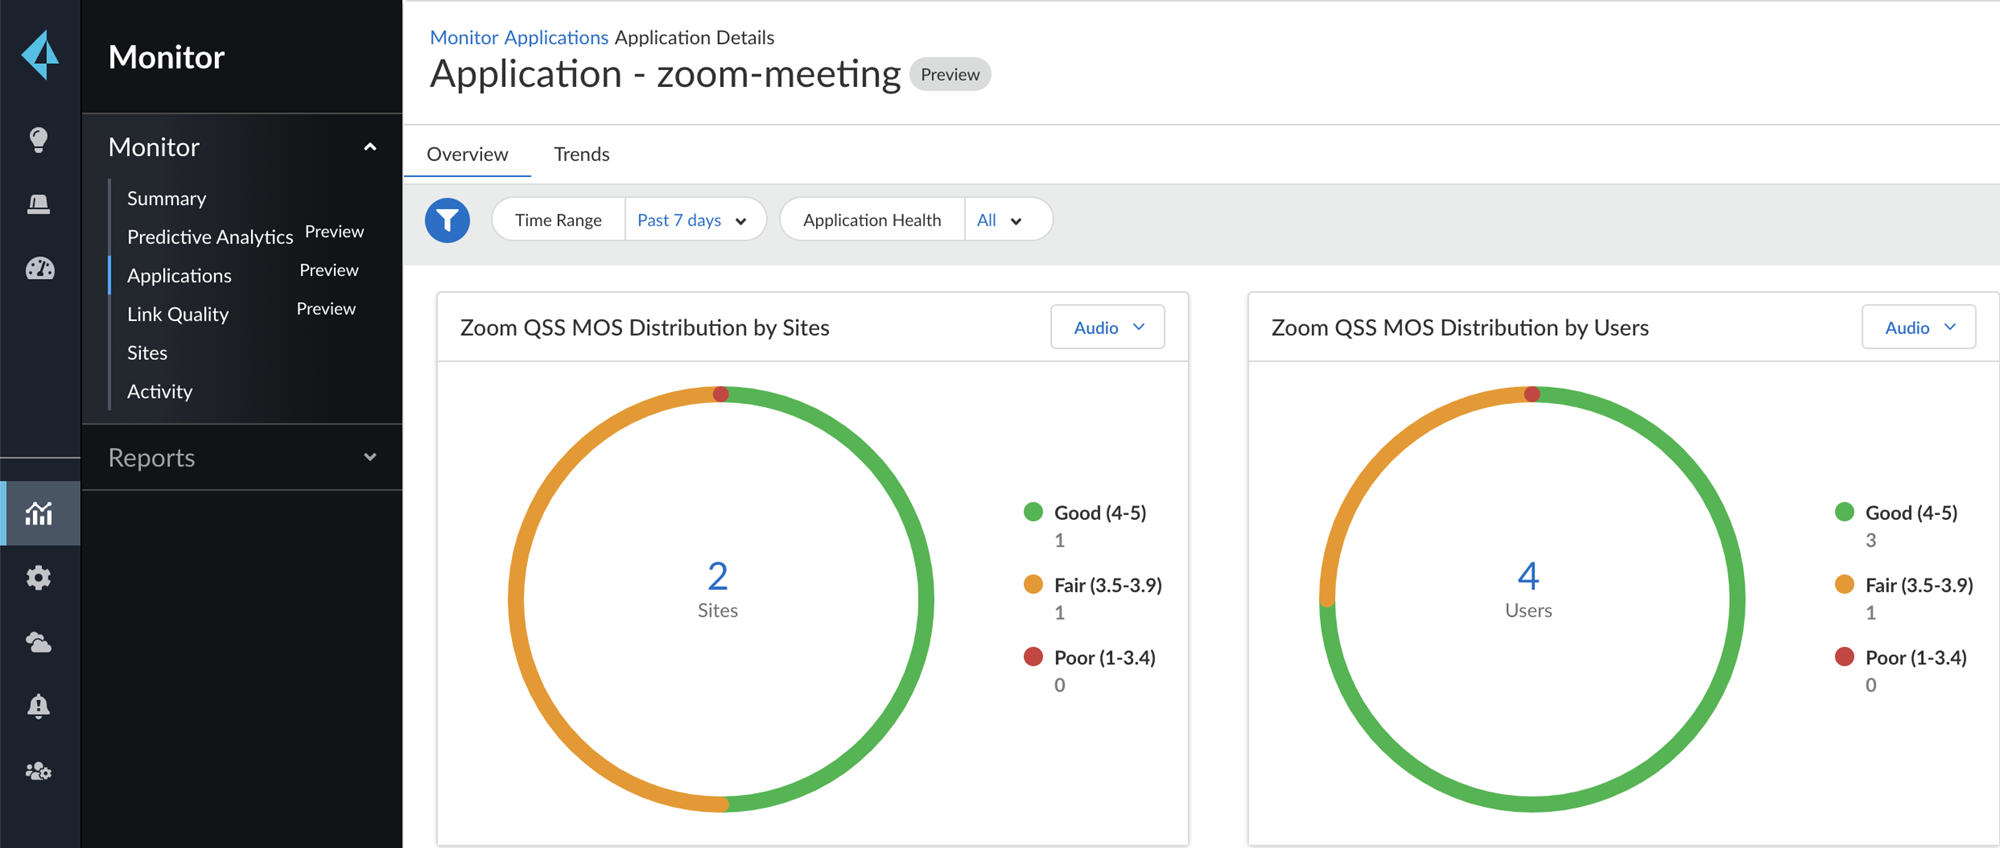
- Select the zoom-meeting app from the list of apps. The
Overview tab displays the Zoom QSS MOS distribution
data for a site and for a user.
![]()
- Zoom QSS MOS Distribution by Sites: shows the Zoom MOS distribution of good, fair, and poor applications across sites. This application data can be filtered by audio, video, and screen share for a selected time period.
- Zoom QSS MOS Distribution by Users: shows the Zoom MOS distribution of good, fair, and poor applications across users. This application data can be filtered by audio, video, and screen share for a selected time period.
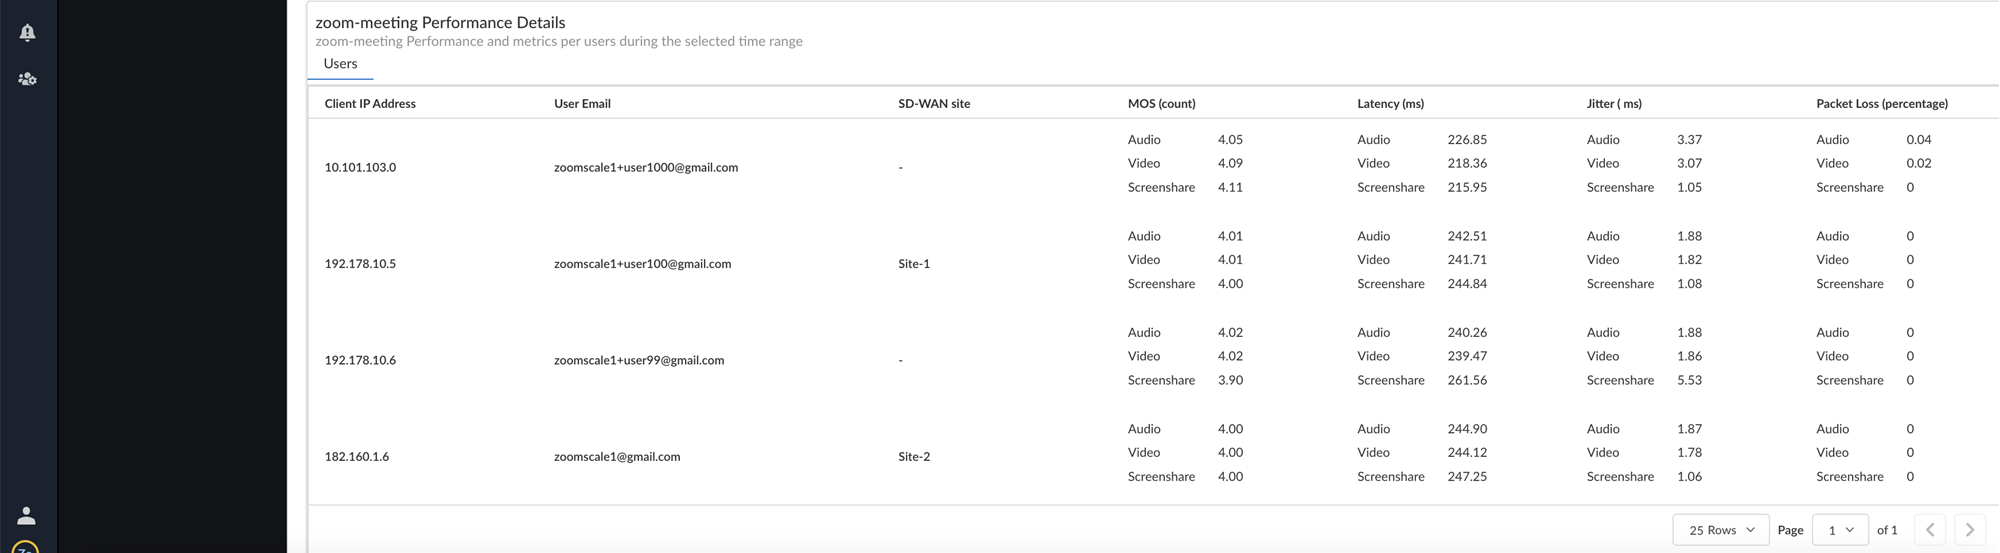
- zoom-meeting Performance Details: shows the zoom
meeting performance and metrics per user for a selected time period. The
Users tab lists a user's client IP address,
user email, SD-WAN site, MOS count, latency, jitter, and packet loss
percentage.
![]()
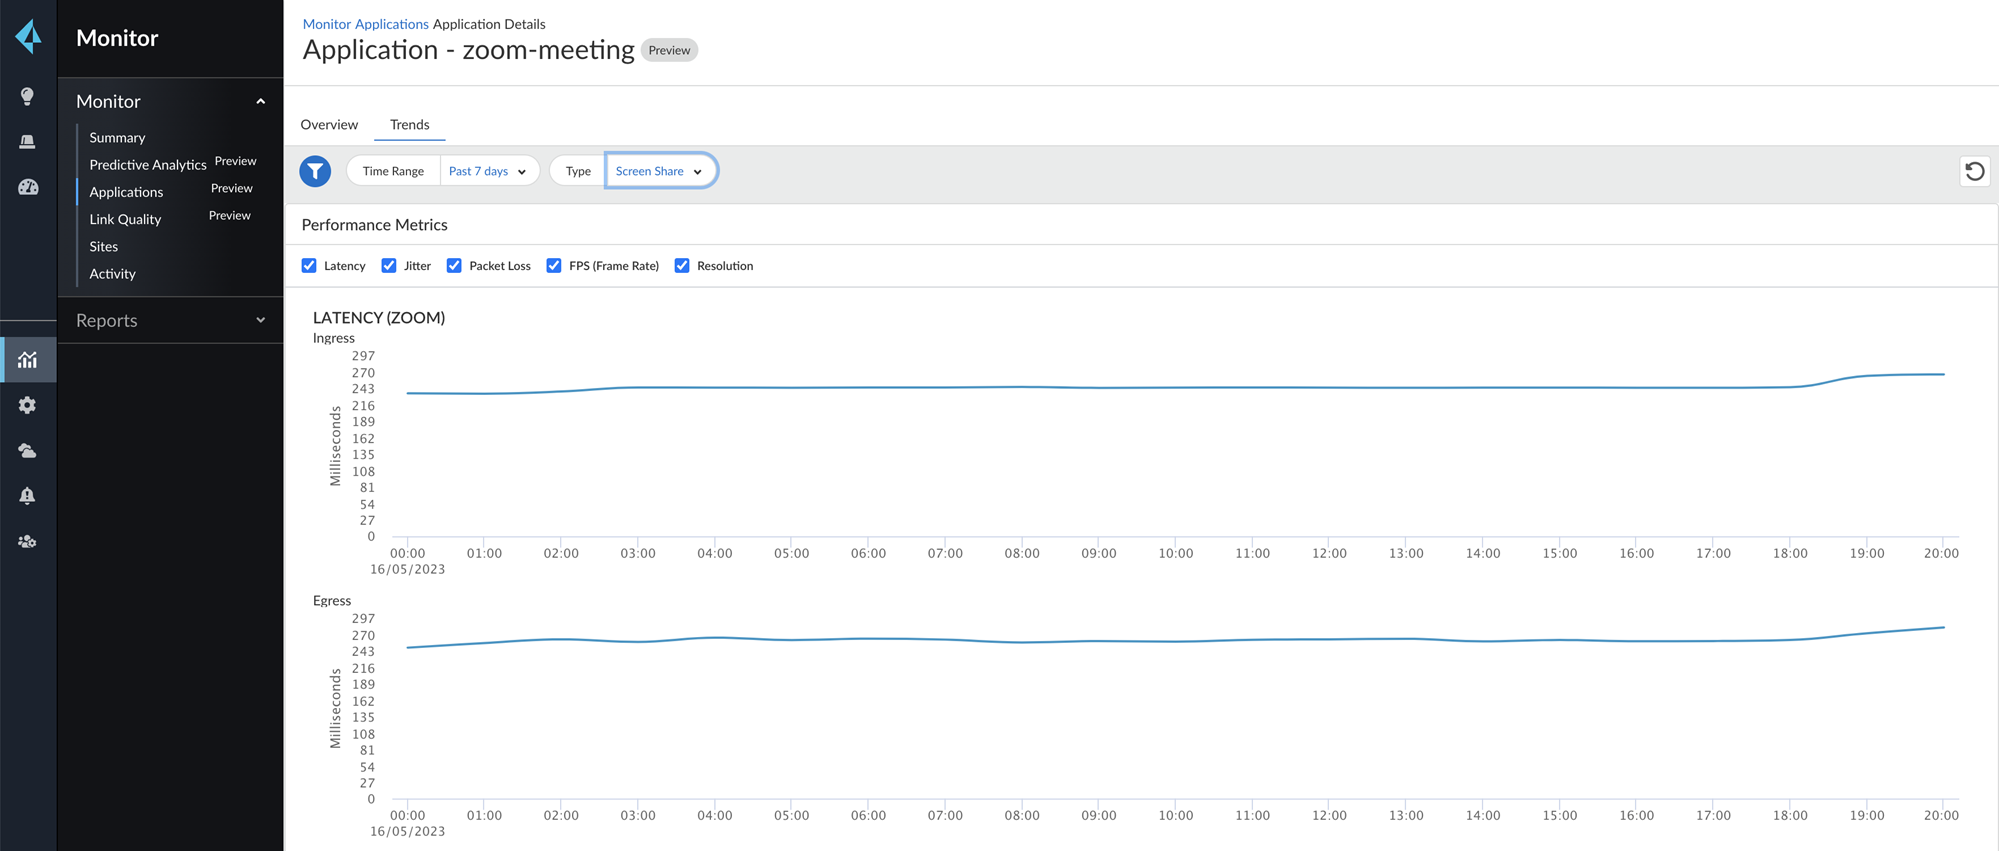
- Select the Trends tab to see the overall performance
metrics against the network baseline app performance for audio, video, and
screen share performance for a selected time frame. The following graphs represent:
- Latency (Zoom): The latency used from the Zoom
application in both the ingress and egress directions.
![]()
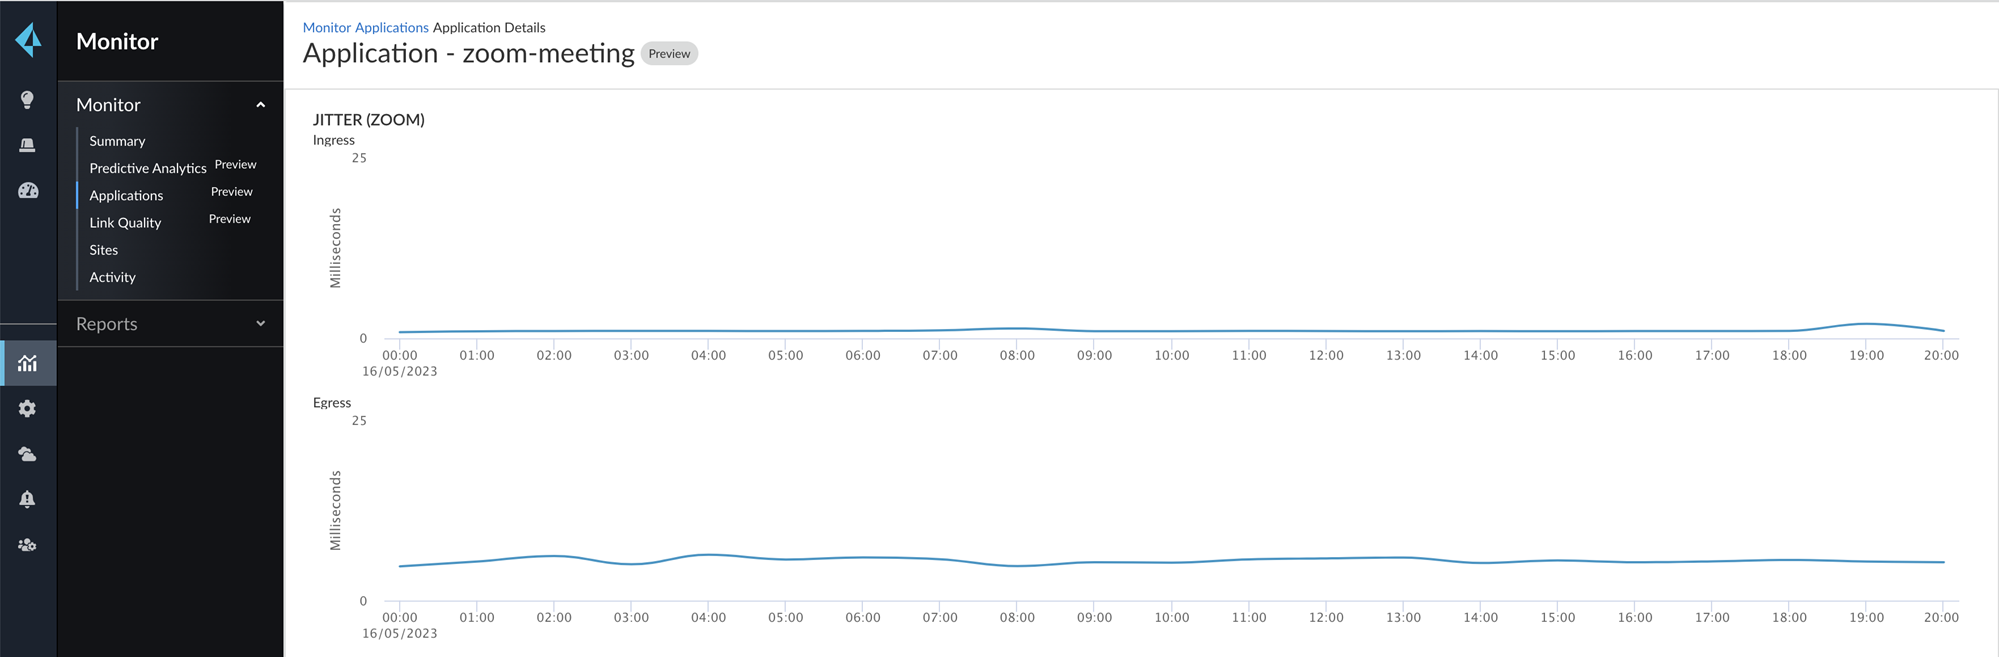
- Jitter (Zoom): The jitter used from the Zoom
application in both the ingress and egress direction.
![]()
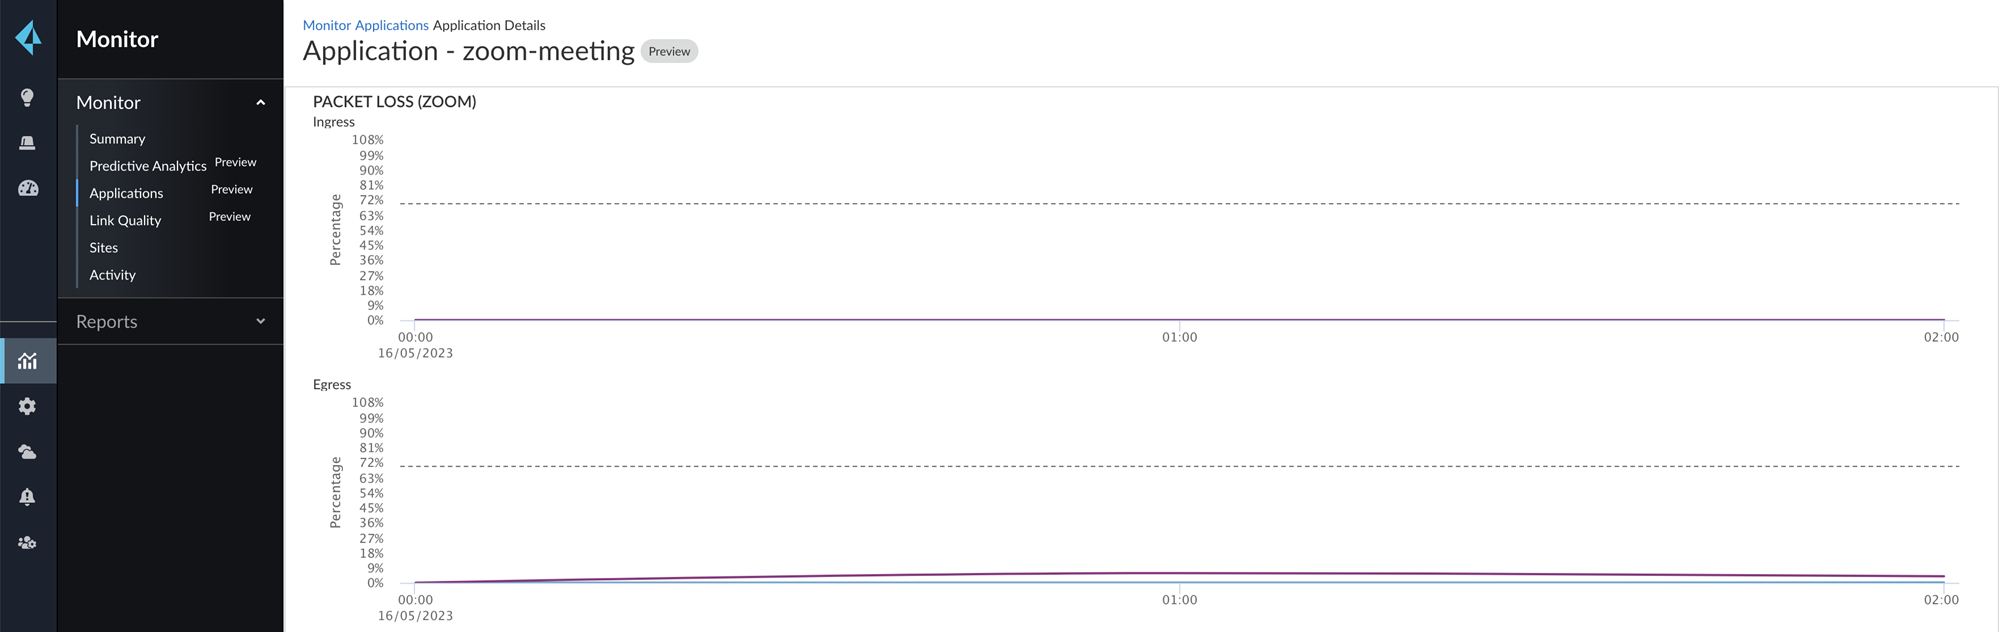
- Packet Loss (Zoom): The packet loss from the Zoom
application in both the ingress and egress direction.
![]()
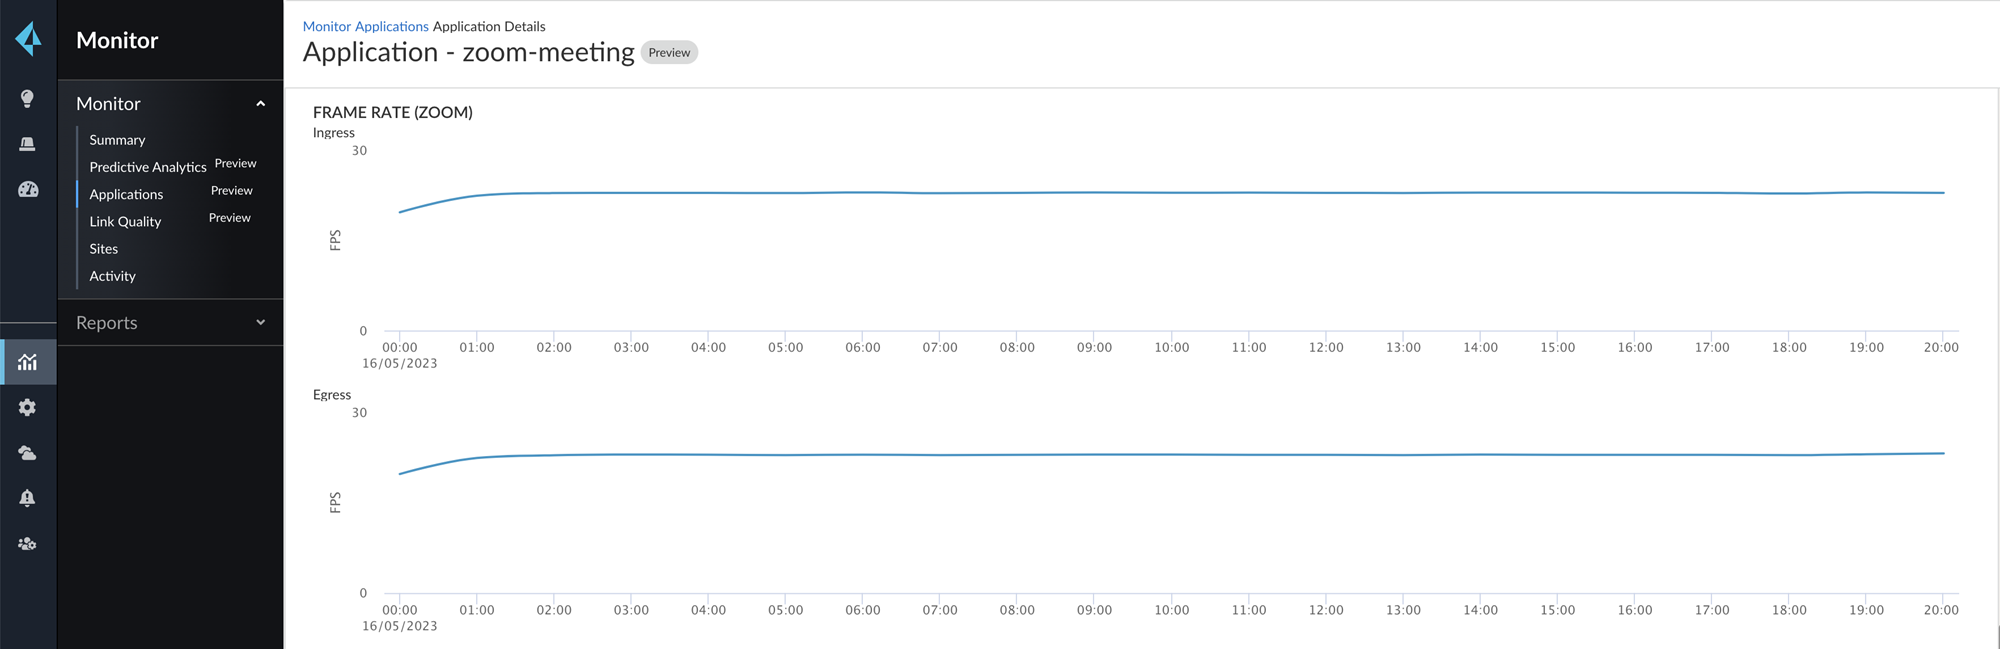
- Frame Rate (Zoom):The Frame rate (expressed in
frames per second or FPS) at which consecutive images (frames) are
captured or displayed from the Zoom application in both the ingress and
egress directions.
![]()
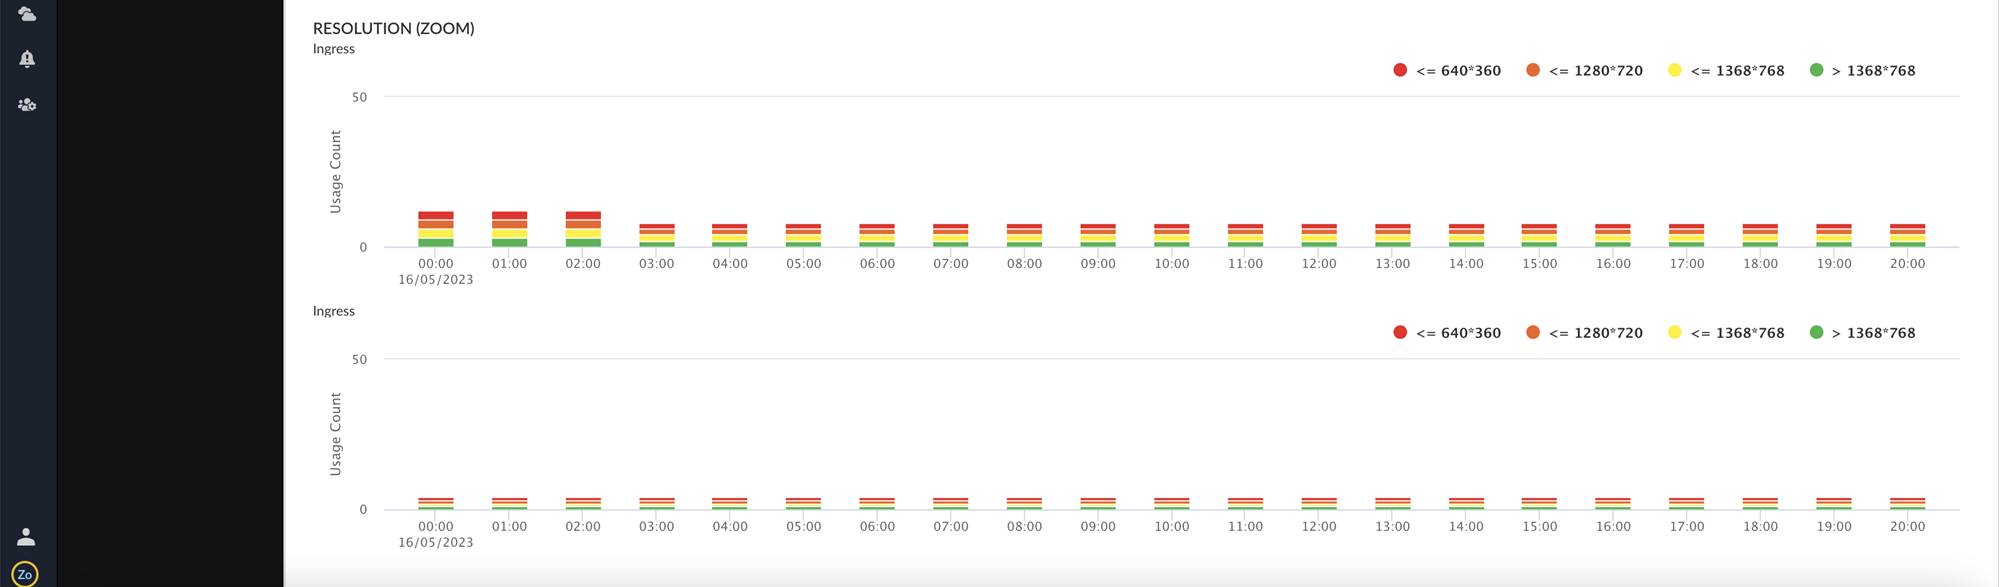
- Resolution (Zoom): The resolution of the images
(frames) are captured or displayed from the Zoom application across
users in both the ingress and egress direction. The resolution markers
depicted are color coded.
![]()
If the Zoom metrics is not visible for a period of time, recheck the QSS license status and reconfirm if the Zoom QSS CloudBlade is authorized successfully. If the issue still persists, contact the Palo Alto Networks support team. - Latency (Zoom): The latency used from the Zoom
application in both the ingress and egress directions.