Enhanced Logging for GlobalProtect
Table of Contents
Enhanced Logging for GlobalProtect
To help you monitor and troubleshoot issues
with your GlobalProtect deployment, PAN-OS now provides the following
logging enhancements for GlobalProtect:
These
features are available for any Palo Alto Networks next-generation
firewall deployed as a GlobalProtect gateway or portal.
GlobalProtect Activity Charts and Graphs on the ACC
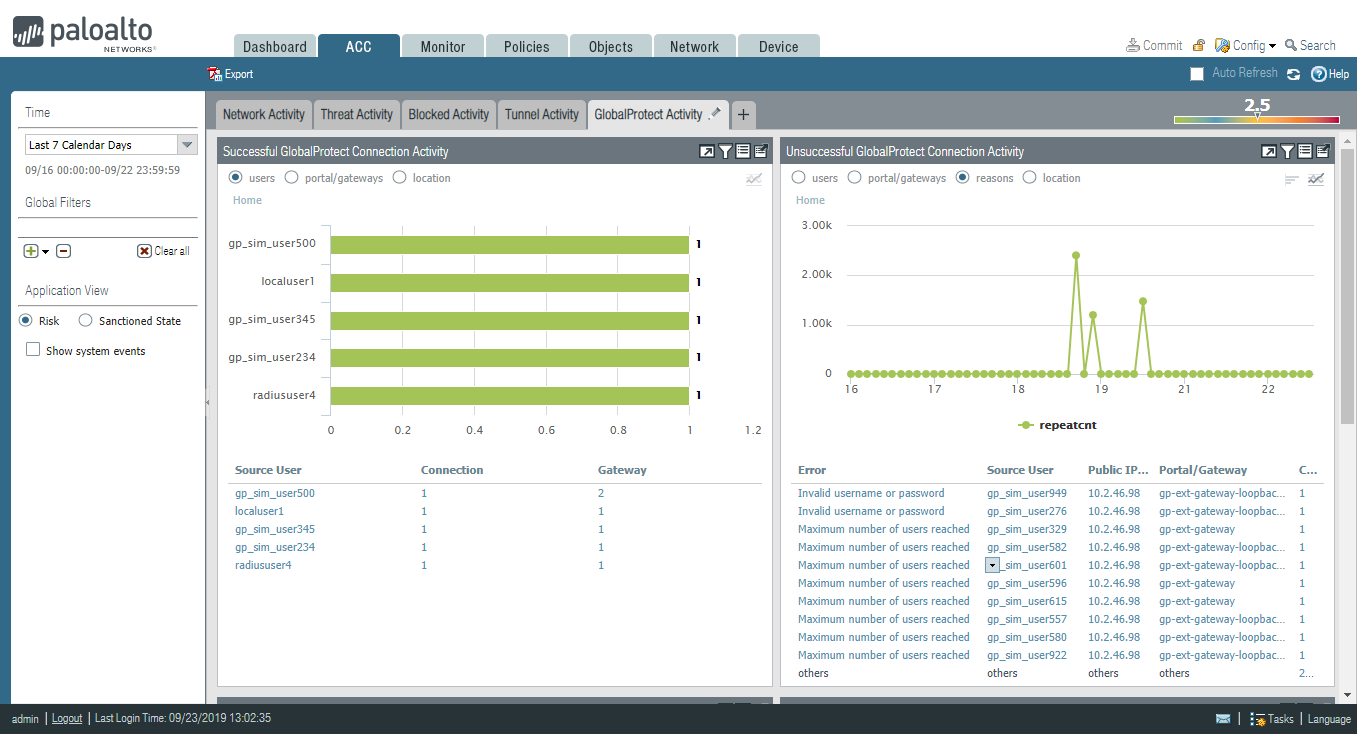
The
ACC displays a graphical view of user activity in your GlobalProtect
deployment on the GlobalProtect Activity tab. The following charts
are available:
- Successful GlobalProtect Connection Activity—Chart view of GlobalProtect connection activity over the selected time period. Use the toggle at the top of the chart to switch between connection statistics by users, portals and gateways, and location.
- Unsuccessful GlobalProtect Connection Activity—Chart view of unsuccessful GlobalProtect connection activity over the selected time period. Use the toggle at the top of the chart to switch between connection statistics by users, portals and gateways, and location. To help you identify and troubleshoot connection issues, you can also view the reasons chart or graph. For this chart, the ACC indicates the error, source user, public IP address and other information to help you identify and resolve the issue quickly.
- GlobalProtect Deployment Activity—Chart view summary of your deployment. Use the toggle at the top of the chart to view the distribution of users by authentication method, GlobalProtect app version, and operating system version.
The GlobalProtect Activity
charts and graphs are also interactive and support similar drill-down
functionality to other ACC charts and graphs.
In addition,
the GlobalProtect Host Information widget under
the Network Activity tab is now renamed HIP Information.
New GlobalProtect Log Category
PAN-OS now moves GlobalProtect logs to a new
dedicated page within . This page enables you
to view the following GlobalProtect events in one place:
- System logs related to GlobalProtect.GlobalProtect authentication event logs remain in ; however, the new GlobalProtect logs display information that shows the authentication method that is used. The following screenshot shows an example of logs in the new page; note the Auth Method of SAML.
![]() Compare these to the authentication-related logs that are in .
Compare these to the authentication-related logs that are in .![]()
- LSVPN/satellite events.
- GlobalProtect portal and gateway logs.
- Clientless VPN logs.


The new log category
eliminates the need for using complex log queries to locate GlobalProtect
logs. You can also sort, filter, and query the GlobalProtect logs.
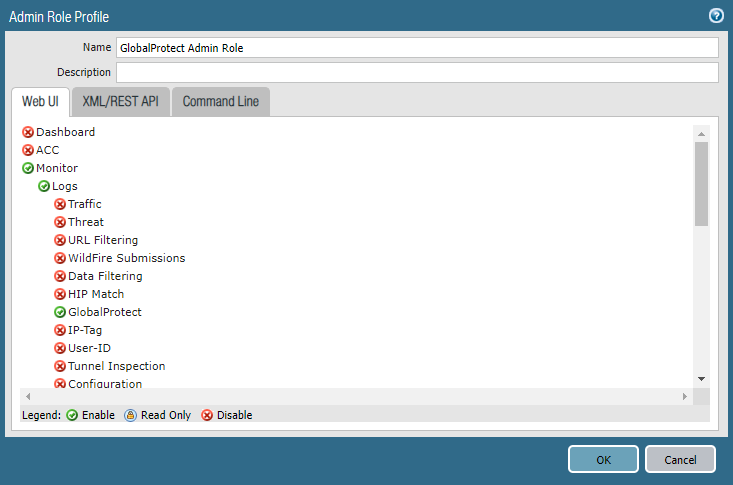
New GlobalProtect Admin Role
If access to GlobalProtect logs and data is
a concern (such as for regulatory compliance or data privacy concerns),
you can restrict access to these logs by creating an Admin Role profile and
specifying the GlobalProtect role to enable,
disable, or provide read-only access to the GlobalProtect logs.
Log Forwarding for GlobalProtect Logs
You can now forward GlobalProtect logs to
an external service such as a syslog receiver or ticketing system.
In cases where some teams in your organization can achieve greater
efficiency by monitoring only the GlobalProtect logs that are relevant
to their operations, you can create forwarding filters based on
GlobalProtect log attributes. For example, you can filter by:
- GlobalProtect authentication events generated by GlobalProtect (type eq globalprotect)GlobalProtect authentication events generated by the authentication service (type eq auth) remain in .
- All other GlobalProtect events (non-authentication)
Palo
Alto Networks firewalls forward GlobalProtect logs using the following format.
To facilitate parsing, the delimiter is a comma: each field is a
comma-separated value (CSV) string.
Format: domain,
receive_time, serial, seqno, actionflags, type, subtype, config_ver,
time_generated, vsys, eventid, stage, auth_method, tunnel_type,
srcuser, srcregion, machinename, public_ip, public_ipv6, private_ip, private_ipv6,
hostid, serialnumber, client_ver, client_os, client_os_ver, repeatcnt, reason,
error, opaque, status, location, login_duration, connect_method, error_code,
portal
To configure log forwarding for
GlobalProtect logs:
- Configure a server profile for each external service that will receive log information.
- Configure the destinations for GlobalProtect logs.
![]() You can also add or remove tags from a source or destination IP address in a log entry.
You can also add or remove tags from a source or destination IP address in a log entry. - Commit and verify your changes.

Custom Reports for GlobalProtect
You can configure custom reports based on GlobalProtect
logs that the firewall generates immediately (on demand) or on schedule
(each night).
- Select .
- Click Add and then enter a Name for the report.
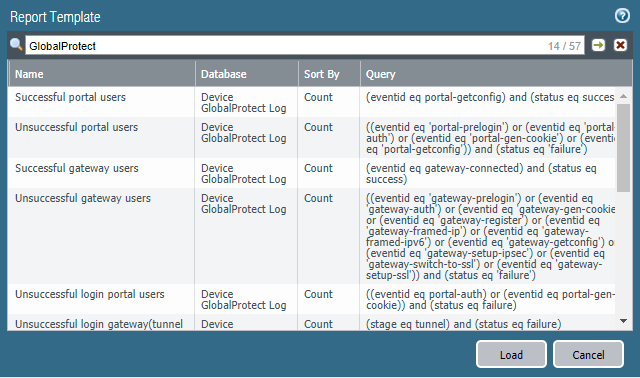
- To base a report on an predefined template, click Load
Template and choose the template. You can then edit
the template and save it as a custom report.
![]()
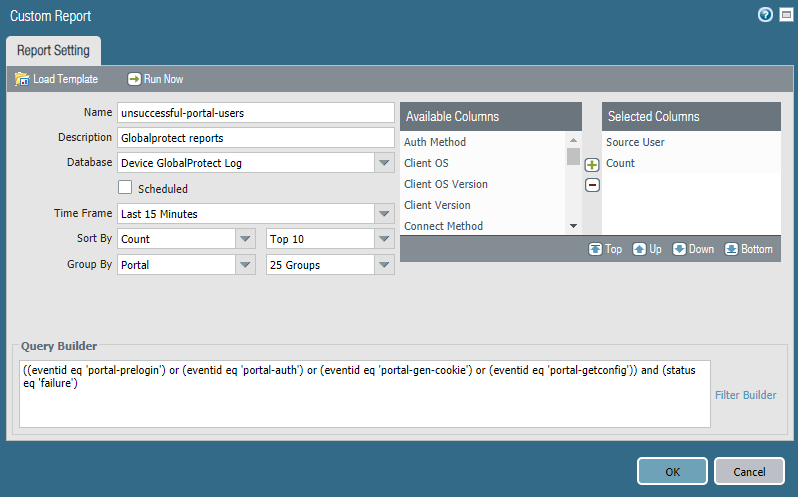
- If you choose to build the report from scratch, select the database you want to use for the report as Device GlobalProtect Log.
- Select the Scheduled check box to run the report each night. The report is then available for viewing in the Reports column on the side.
- Define the filtering criteria. Select the Time Frame, the Sort By order, Group By preference, and select the columns that must display in the report.
- (Optional) Select the Query Builder attributes
if you want to further refine the selection criteria. To build a
report query, specify the following and click Add. Repeat
as needed to construct the full query.
- Connector—Choose the connector (and/or) to precede the expression you are adding.
- Negate—Select the check box to interpret the query as a negation. If, for example, you choose to match entries in the last 24 hours and/or are originating from the untrust zone, the negate option causes a match on entries that are not in the past 24 hours and/or are not from the untrust zone.
- Attribute—Choose a data element. The available options depend on the choice of database.
- Operator—Choose the criterion to determine whether the attribute applies (such as =). The available options depend on the choice of database.
- Value—Specify the attribute value to match.
For example, to build a report for GlobalProtect portal users with unsuccessful login attempts, use a query similar to the following:((eventid eq 'portal-prelogin') or (eventid eq 'portal-auth') or (eventid eq 'portal-gen-cookie') or (eventid eq 'portal-getconfig')) and (status eq 'failure')![]()
- To test the report settings, select Run Now. Modify the settings as required to change the information that is displayed in the report.
- Click OK to save the custom report.