Prisma Access
Integrate Prisma Access with Aryaka SD-WAN
Table of Contents
Integrate Prisma Access with Aryaka SD-WAN
Learn how to integrate Prisma Access with Aryaka SD-WAN.
| Where Can I Use This? | What Do I Need? |
|---|---|
|
|
Aryaka's SD-WAN solution combines the overlay and underlay network that includes a global
private network, WAN optimization, cloud connectivity and MyAryaka visibility that are
essential for an Enterprise WAN solution with superior application performance. Aryaka
owns and manages all aspects of the SD-WAN and network connectivity end to end, which
provides an agile and quick-to-deploy solution.
The following figure shows a sample Aryaka deployment topology. This sample deployment
has two sites, Site A and Site B. The Aryaka Edge device or Aryaka Network
Access Point (ANAP) is a branch edge device that is included as part of the Aryaka
SmartConnect service. The Aryaka devices optimize, accelerate, and encrypt site-to-site
traffic originating from the client side before they send the traffic over a secure
IPSec tunnel to the Aryaka global SD-WAN. The SD-WAN then encrypts the internet-bound
traffic and sends it over a secure IPSec tunnel to Prisma Access to secure your
traffic.

| Use Case | Architecture | Supported? |
|---|---|---|
| Securing traffic from each branch site with 1 WAN link
(Type 1) Use an IPSec tunnel from each branch to Prisma Access. Use an
Aryaka SmartConnect device at the branch. |

| Yes |
| Securing branch and HQ sites with active/backup SD-WAN connections |
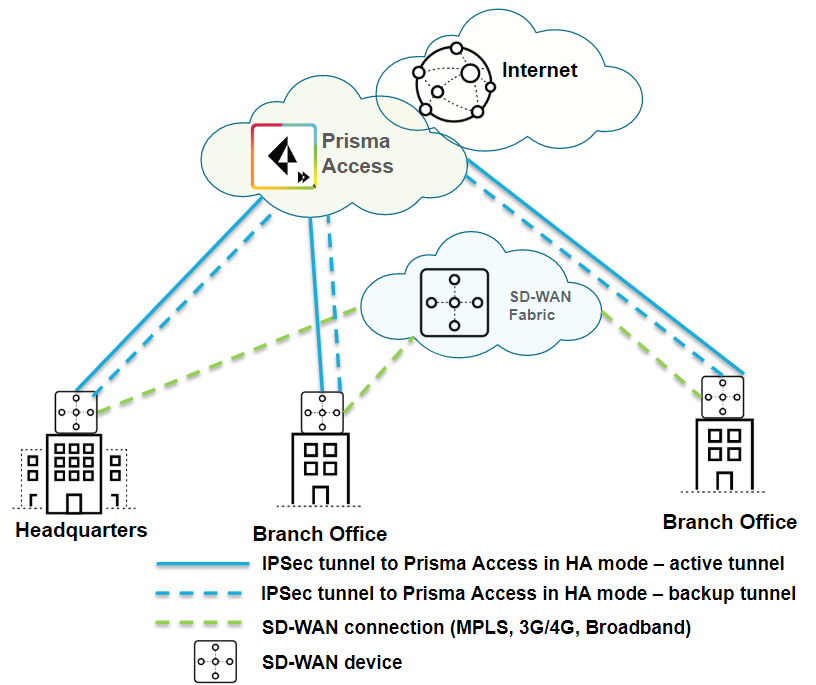
| Yes |
| Securing branch and HQ sites with active/active SD-WAN connections |
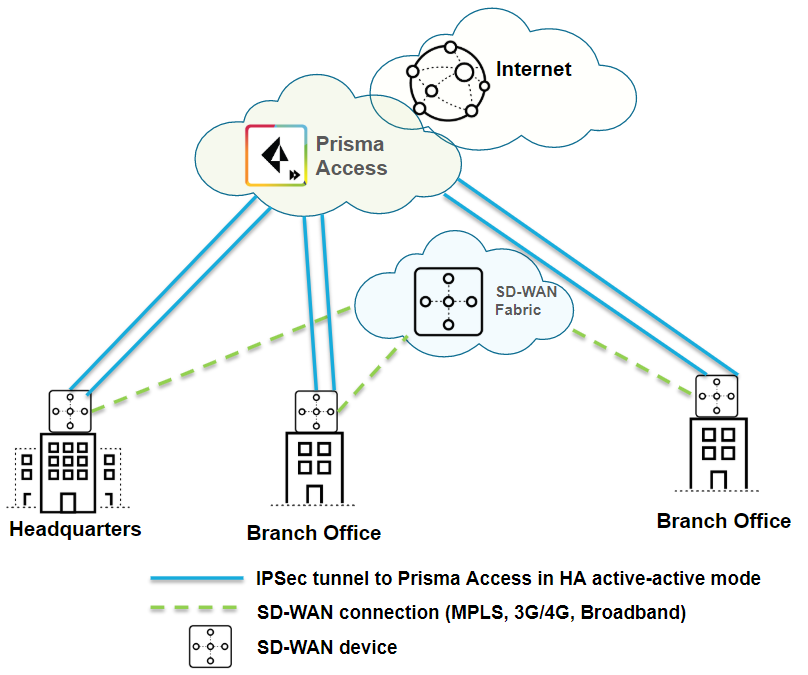
| No |
| Securing branch and HQ sites with SD-WAN edge devices in HA mode |
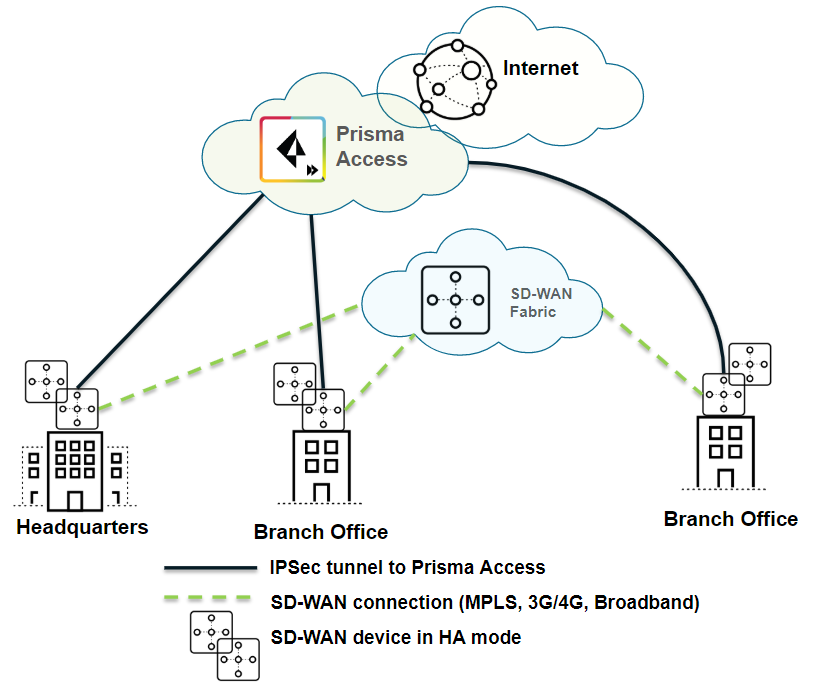
| Yes |
| Securing SD-WAN deployments with Regional Hub/POP architecture (Type 2) |
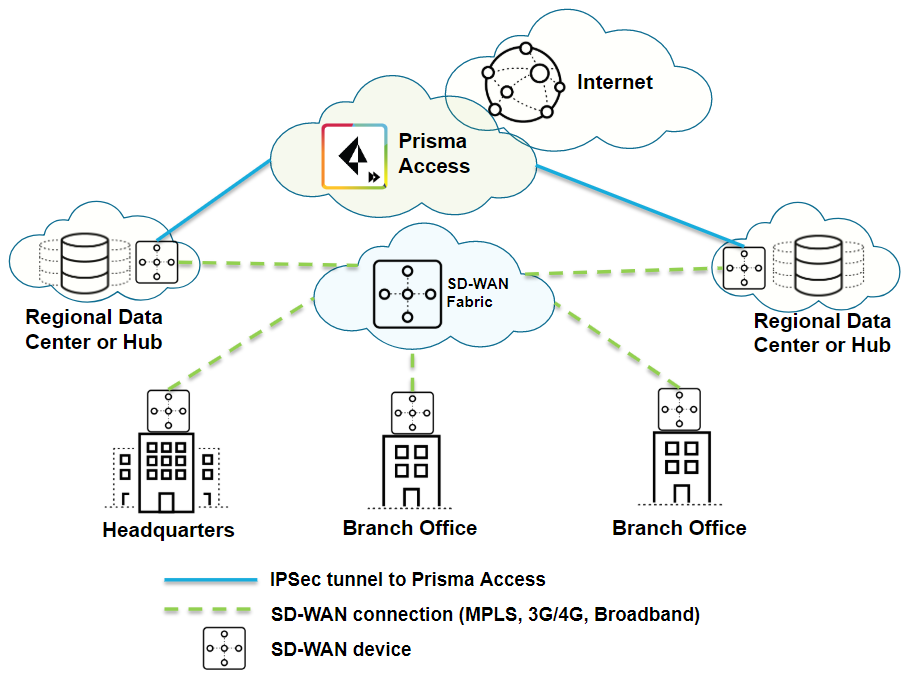
| Yes |
To begin integrating the Aryaka SD-WAN with Prisma Access, set up the service
infrastructure in Prisma Access, then configure and create an IPSec tunnel with Internet
Key Exchange (IKE) and IPSec settings.
Integrate Prisma Access with Aryaka SD-WAN (Strata Cloud Manager)
set up Prisma Access for use with an Aryaka SD-WAN.
To set up Prisma Access for use with an Aryaka SD-WAN, complete the following
task.
- Configure the Prisma Access Service Infrastructure.Follow the steps to Connect a remote network to Prisma Access.When creating a new IPSec Tunnel during the onboarding procedure, make a note of the IPSec Tunnel name and the IKE Gateway and IPSec Crypto profile that you use.If you configure a pre-shared key (PSK) for the IKE Gateway, make a note of it; you enter this PSK when you configure the IPSec tunnel in Aryaka SmartConnect.Commit the configuration changes and push the configuration out to Prisma Access for remote networks.
- Click .Make a note of the Service IP of the Prisma Access side of the tunnel. To find this address in Prisma Access (Managed by Strata Cloud Manager), select . Look for the Service IP field corresponding to the remote network configuration you created.
Configure the IPSec Tunnel in Aryaka SmartConnect
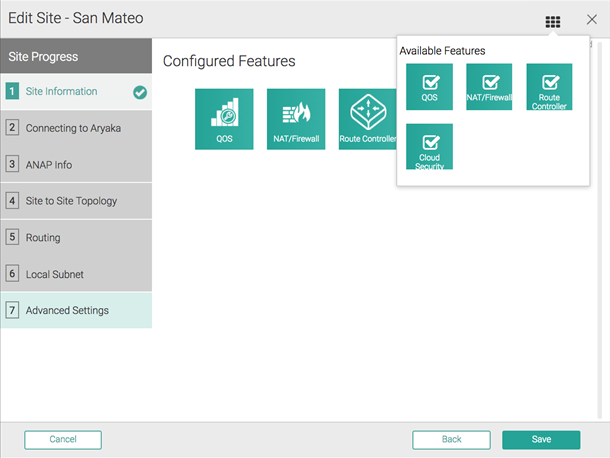
You configure Aryaka SmartConnect in the Cloud Security Connector section of the MyAryaka portal at https://my.aryaka.com/. Alternatively, you can contact the Aryaka support team to assist with the configuration.Your MyAryaka account must have write permission access to configure the Cloud Security Service. To verify that you have this access, log in to MyAryaka and select .To complete the tunnel configuration for Aryaka SmartConnect, complete the following task.- Log in to MyAryaka and navigate to the SmartConnect site for which you want to deploy Prisma Access.Click Edit Site, then select Cloud Security from the list of Advanced Settings.
![]() Enter information for the remote network tunnel.Enter the following settings:
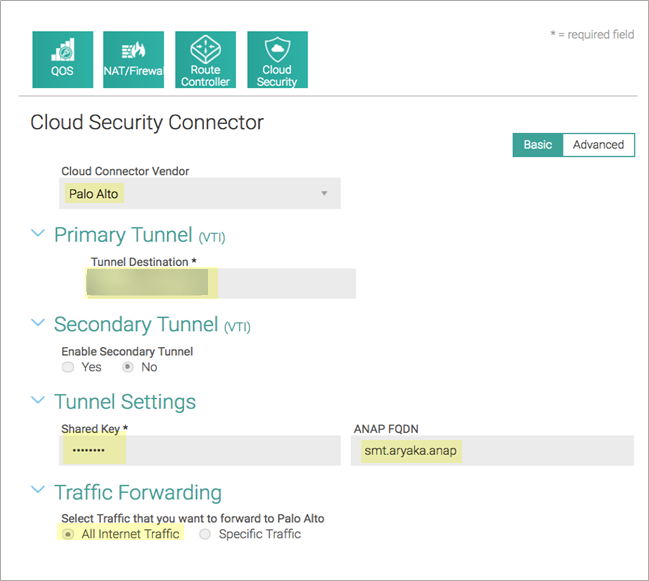
Enter information for the remote network tunnel.Enter the following settings:- Select Palo Alto in the Cloud Connector Vendor field.
- Enter the Service IP Address for the remote network tunnel from Prisma Access in the field.
- Enter the PSK value from the Prisma Access IKE gateway in the field.
- Enter a FQDN for the Aryaka Network Access Point (ANAP), if the IP address of the M1/M2 interface is dynamic.
- Select All Internet Traffic in the Traffic Forwarding field.
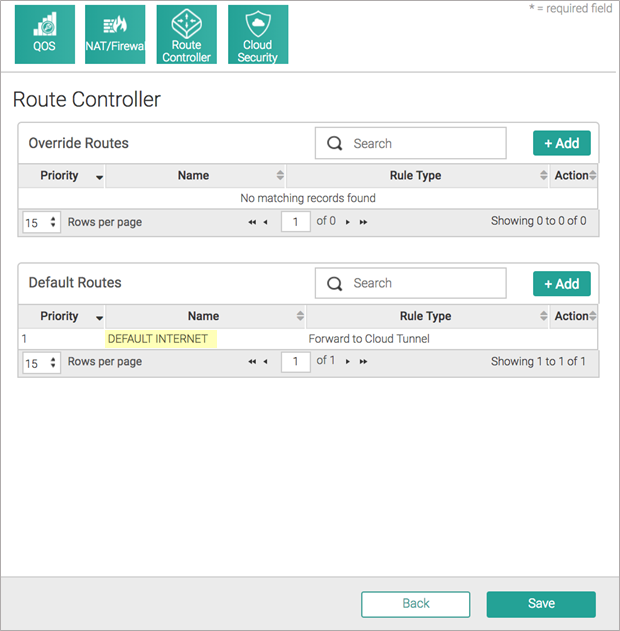
![]() After you choose to forward all internet traffic to Prisma Access, a default rule named DEFAULT INTERNET is inserted in the Route Controller, in the Default Routes section. The following screenshot shows the traffic forwarding settings.
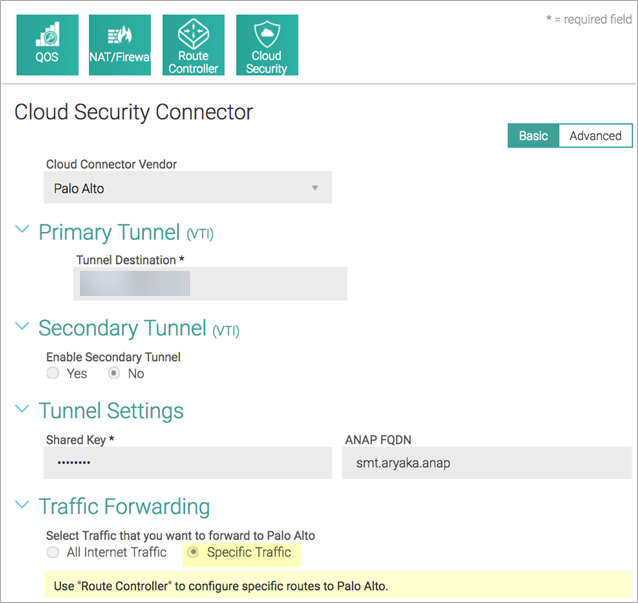
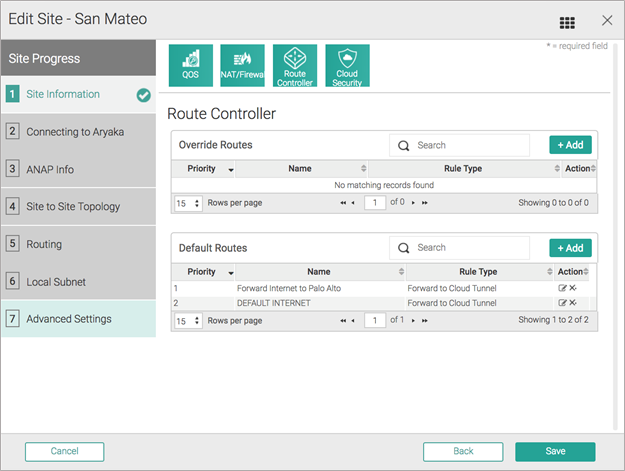
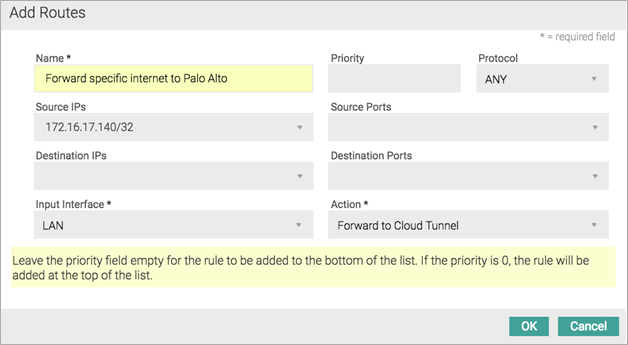
After you choose to forward all internet traffic to Prisma Access, a default rule named DEFAULT INTERNET is inserted in the Route Controller, in the Default Routes section. The following screenshot shows the traffic forwarding settings.![]() (Optional) If you choose to forward only specific internet traffic to Prisma Access, program appropriate routes in the Router Controller section.Aryaka recommends that you edit Default Routes and not override routes to control forwarding. Override routes take precedence over any Aryaka-destined traffic and may accidentally cause site-to-site traffic to be routed to Prisma Access.The following figures provide screenshots of the Route Controller feature.
(Optional) If you choose to forward only specific internet traffic to Prisma Access, program appropriate routes in the Router Controller section.Aryaka recommends that you edit Default Routes and not override routes to control forwarding. Override routes take precedence over any Aryaka-destined traffic and may accidentally cause site-to-site traffic to be routed to Prisma Access.The following figures provide screenshots of the Route Controller feature.![]()
![]()
![]() Check the status of the tunnels.
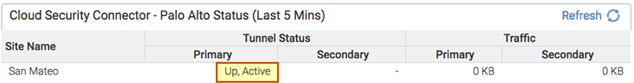
Check the status of the tunnels.- To check the status from the Aryaka Cloud Security Connector, click the Status tab. Aryaka uses Dead Peer Detection (DPD) to determine the availability of the tunnel.
![]()
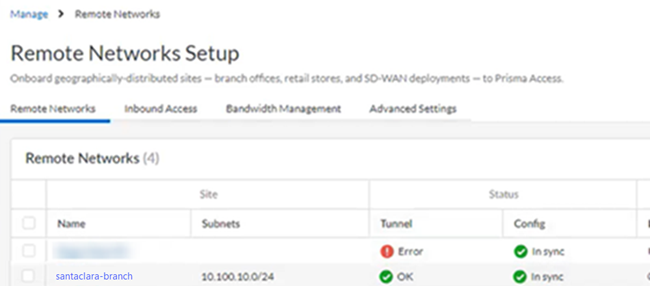
- To check the status from Prisma Access (Managed by Strata Cloud Manager), select to verify that the remote network has been successfully deployed.
Monitor Remote Network Traffic
To monitor remote network tunnel traffic from the Aryaka SD-WAN, complete the following task.- Click the Monitor tab, then select Cloud Security Connector Traffic.Pick a reference site, select a time, and click Apply.To zoom in any of these graphs, click a graph and drag the cursor.
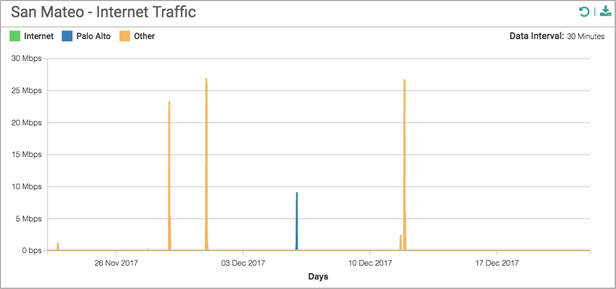
- The following information displays in the Internet Traffic graph:
- Total Internet—All traffic forwarded to the internet.
- Total Palo Alto —All internet traffic forwarded to Prisma Access.
- Total Other—All traffic forwarded to internet that isn't going to Prisma Access.
![]()
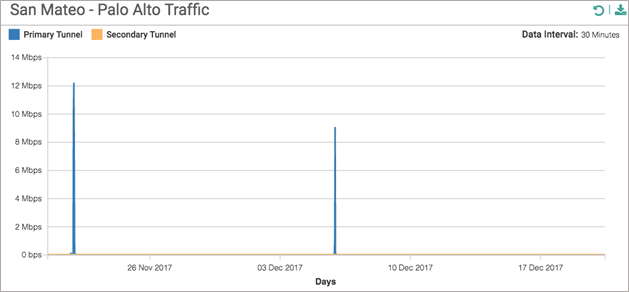
- The Palo Alto Traffic graph shows traffic data (in Mbps) over IPSec tunnels to Prisma Access for the time period that you select. This graph shows traffic flow in both directions to Prisma Access.
![]()
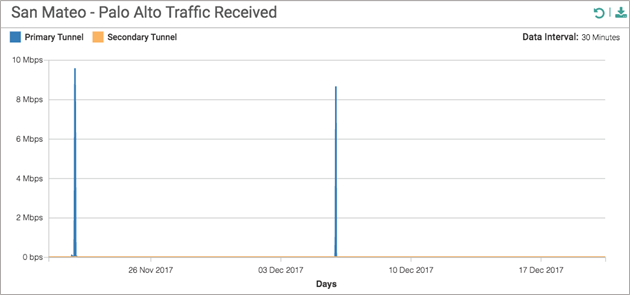
- The Palo Alto Received graph shows traffic received on the IPSec tunnels to Prisma Access. This graph shows all internet traffic inbound to the site from Prisma Access.
![]()
- The Palo Alto Transmitted graph shows all traffic that is transmitted on IPSec tunnels to Prisma Access. This graph shows all traffic outbound to Prisma Access from the site.
![]()
Troubleshoot the Aryaka Remote Network
Prisma Access provides logs and widgets that provide you with the status of remote tunnels and the status of each tunnel.- Go to and check the Status of the tunnel.
![]()
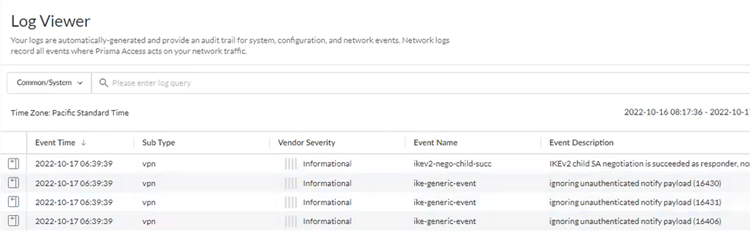
- Go to and check the Common/System logs for IPSec- and IKE-related messages.To view VPN-relates messages, set the filter to sub_type.value = vpn.The message ignoring unauthenticated notify payload indicates that the route has not been added in the crypto map on the other side of the IPSec tunnel after the IPSec negotiation has already occurred.
![]()
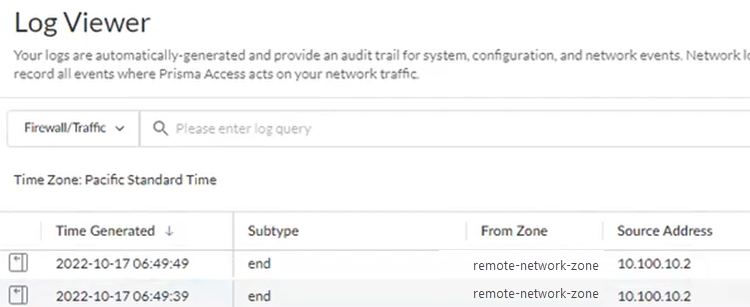
- Check the Firewall/Traffic logs and view the messages that are coming from the zone that has the same name as the remote network.In the logs, the remote network name is used as the source zone.
![]()
Integrate Prisma Access with Aryaka SD-WAN (Panorama)
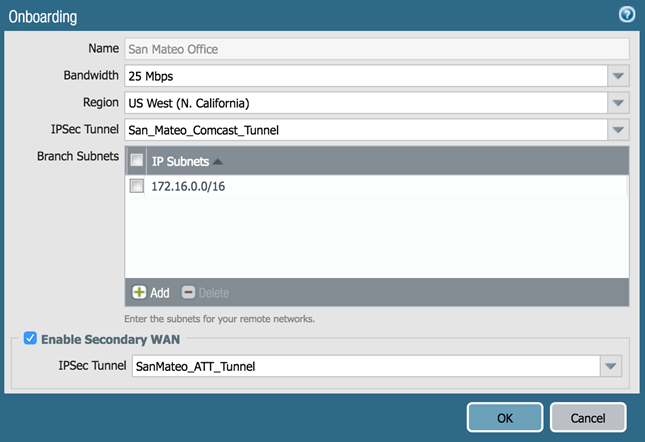
To set up Prisma Access for use with an Aryaka SD-WAN, complete the following task.- In Prisma Access, configure the service infrastructure ( and create an Infrastructure Subnet.Configure the remote network connection.When you add a new IPSec Tunnel during the onboarding procedure, make a note of the IPSec Tunnel name and the IKE Gateway and IPSec Crypto profile that you use (or use the Default IPSec Crypto profile) for the tunnels you create.If you configure a pre-shared key (PSK) for the IKE Gateway, make a note of it; you enter this PSK when you configure the IPSec tunnel in Aryaka SmartConnect.The following example configures a remote network with a Bandwidth of 25 Mbps, a Region of US West (N. California), and a Secondary WAN configured for this location.
![]() Enable zone mapping.Commit the configuration changes to Panorama and push the configuration out to Prisma Access for remote networks.
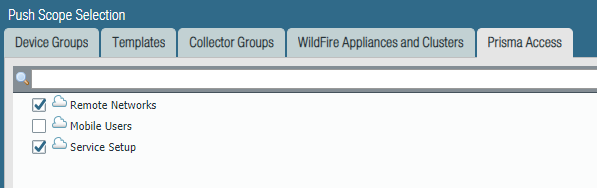
Enable zone mapping.Commit the configuration changes to Panorama and push the configuration out to Prisma Access for remote networks.- Click .Click . Click , and select both Prisma Access for remote networks and Prisma Access for service setup to push the configuration out to the service.
![]() Click OK and Push.Make a note of the Service IP address of the Prisma Access side of the tunnel. To find this address in Panorama, select , click the Remote Networks radio button, and find the address in the Service IP Address field.
Click OK and Push.Make a note of the Service IP address of the Prisma Access side of the tunnel. To find this address in Panorama, select , click the Remote Networks radio button, and find the address in the Service IP Address field.Configure the IPSec Tunnel in Aryaka SmartConnect
You configure Aryaka SmartConnect in the Cloud Security Connector section of the MyAryaka portal at https://my.aryaka.com/. Alternatively, you can contact the Aryaka support team to assist with the configuration.Your MyAryaka account must have write permission access to configure the Cloud Security Service. To verify that you have this access, log in to MyAryaka and select .To complete the tunnel configuration for Aryaka SmartConnect, complete the following task.- Log in to MyAryaka and navigate to the SmartConnect site for which you want to deploy Prisma Access.Click Edit Site, then select Cloud Security from the list of Advanced Settings.
![]() Enter information for the remote network tunnel.Enter the following settings:
Enter information for the remote network tunnel.Enter the following settings:- Select Palo Alto in the Cloud Connector Vendor field.
- Enter the Service IP Address for the remote network tunnel from Prisma Access in the field.
- Enter the PSK value from the Prisma Access IKE gateway in the field.
- Enter a FQDN for the Aryaka Network Access Point (ANAP), if the IP address of the M1/M2 interface is dynamic.
- Select All Internet Traffic in the Traffic Forwarding field.
![]() After you choose to forward all internet traffic to Prisma Access, a default rule named DEFAULT INTERNET is inserted in the Route Controller, in the Default Routes section. The following screenshot shows the traffic forwarding settings.
After you choose to forward all internet traffic to Prisma Access, a default rule named DEFAULT INTERNET is inserted in the Route Controller, in the Default Routes section. The following screenshot shows the traffic forwarding settings.![]() (Optional) If you choose to forward only specific internet traffic to Prisma Access, program appropriate routes in the Router Controller section.Aryaka recommends that you edit Default Routes and not override routes to control forwarding. Override routes take precedence over any Aryaka-destined traffic and may accidentally cause site-to-site traffic to be routed to Prisma Access.The following figures provide screenshots of the Route Controller feature.
(Optional) If you choose to forward only specific internet traffic to Prisma Access, program appropriate routes in the Router Controller section.Aryaka recommends that you edit Default Routes and not override routes to control forwarding. Override routes take precedence over any Aryaka-destined traffic and may accidentally cause site-to-site traffic to be routed to Prisma Access.The following figures provide screenshots of the Route Controller feature.![]()
![]()
![]() Check the status of the tunnels.
Check the status of the tunnels.- To check the status from the Aryaka Cloud Security Connector, click the Status tab. Aryaka uses Dead Peer Detection (DPD) to determine the availability of the tunnel.
![]()
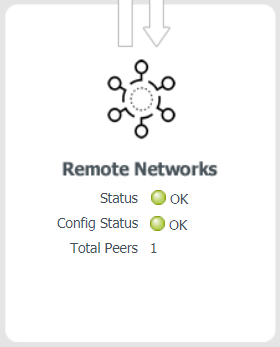
- To check the status from Panorama, select to verify that the remote network has been successfully deployed.
![]()
Monitor Remote Network Traffic
To monitor remote network tunnel traffic from the Aryaka SD-WAN, complete the following task.- Click the Monitor tab, then select Cloud Security Connector Traffic.Pick a reference site, select a time, and click Apply.To zoom in any of these graphs, click a graph and drag the cursor.
- The following information displays in the Internet Traffic graph:
- Total Internet—All traffic forwarded to the internet.
- Total Palo Alto —All internet traffic forwarded to Prisma Access.
- Total Other—All traffic forwarded to internet that isn't going to Prisma Access.
![]()
- The Palo Alto Traffic graph shows traffic data (in Mbps) over IPSec tunnels to Prisma Access for the time period that you select. This graph shows traffic flow in both directions to Prisma Access.
![]()
- The Palo Alto Received graph shows traffic received on the IPSec tunnels to Prisma Access. This graph shows all internet traffic inbound to the site from Prisma Access.
![]()
- The Palo Alto Transmitted graph shows all traffic that is transmitted on IPSec tunnels to Prisma Access. This graph shows all traffic outbound to Prisma Access from the site.
![]()
Troubleshoot the Aryaka Remote Network
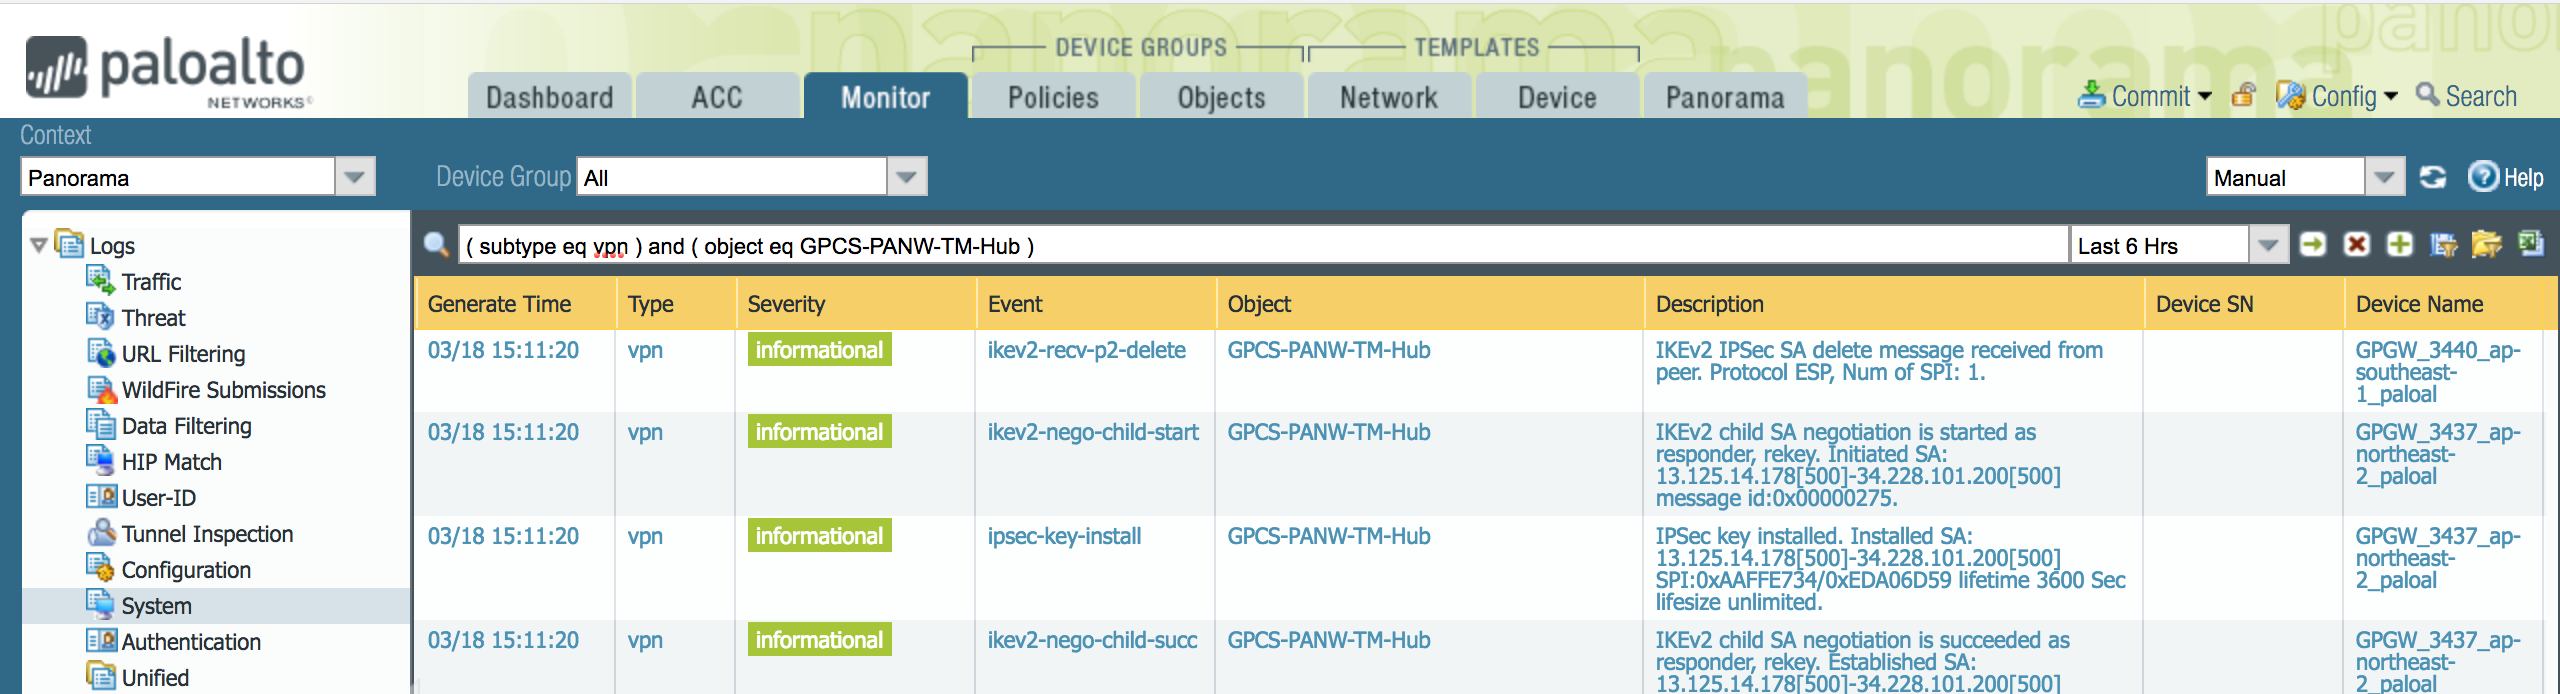
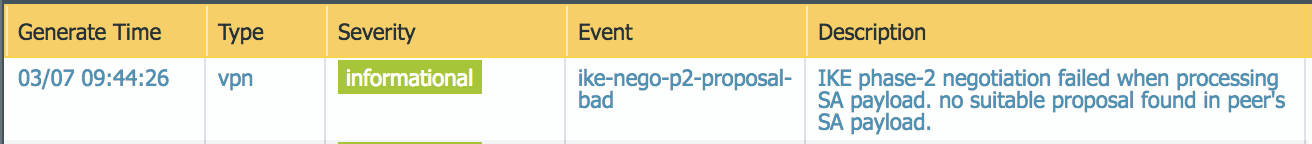
Prisma Access provides logs that provide you with the status of remote tunnels and the status of each tunnel. To view these logs in Panorama, select .To debug tunnel issues, you can filter for tunnel-specific logs by using the object identifier corresponding to that tunnel. The following figures show errors related to tunnel misconfiguration and negotiation issues.![]()
![]()
![]()
![]()
![]()
![]()