Prisma Access
Integrate Prisma Access with Nuage SD-WAN
Table of Contents
Integrate Prisma Access with Nuage SD-WAN
Integrate Prisma Access with Nuage SD-WAN.
| Where Can I Use This? | What Do I Need? |
|---|---|
|
|
You integrate Prisma Access with the Nuage networks SD-WAN by creating a remote network
connection as an IPSec tunnel between Prisma Access and the SD-WAN. You create matching
IKE crypto profiles, IPSec crypto profiles, and IKE gateway settings on each side of the IPSec
tunnel in the Nuage Networks SD-WAN and Prisma Access. For Prisma Access (Cloud
Management), ensure that you use supported IKE and IPSec cryptographic settings
detailed here. You set up these connections on the Nuage Networks side directly from the
customer premises equipment (CPE) to Prisma Access without the need of SD-WAN gateways
to perform WAN functionality. Nuage Networks’ solution differs from other SD-WAN vendors
in that it uses customer premises equipment (CPE) that enables more advanced
capabilities. These fully-functional CPEs can scale, set up a full mesh, and perform
direct internet breakout to internet directly. The Nuage Networks SD-WAN does not
require gateways or hubs to enable WAN functionality.
Integrate Prisma Access with Nuage SD-WAN (Strata Cloud Manager)
Integrate Prisma Access with Nuage SD-WAN.
Complete the following task to configure the remote network connection as a
site-to-site IPSec tunnel.
- Follow the steps to Connect a remote network to Prisma Access.
- Enter a Site Name and select a Prisma Access Location that is close to the remote network location that you want to onboard.Select the IPSec Termination Node to use for the remote network.Configure the primary tunnel.
- Set Up the primary tunnel.When configuring the tunnel, use the validated settings.
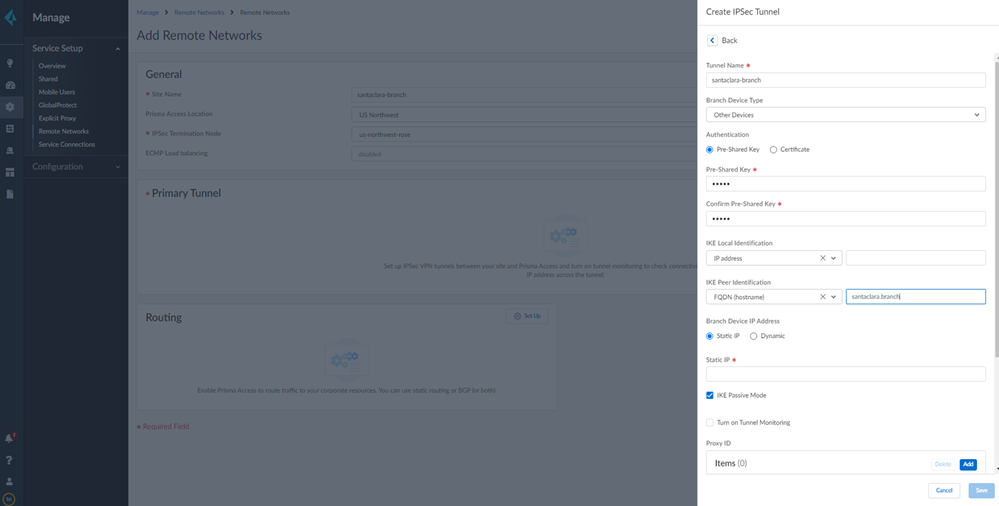
![]() Specify a name for the IPSec Tunnel and click Create New.Enter a Tunnel Name.Set the Branch Device Type to Other Devices.Set the Authentication type to Pre-Shared Key and then enter Pre-Shared Key and Confirm Pre-Shared Key.Specify how the peers will identify each other.
Specify a name for the IPSec Tunnel and click Create New.Enter a Tunnel Name.Set the Branch Device Type to Other Devices.Set the Authentication type to Pre-Shared Key and then enter Pre-Shared Key and Confirm Pre-Shared Key.Specify how the peers will identify each other.- Set the IKE Local Identification and IKE Peer Identification to User FQDN (email address).Make note of the value that you use for the Peer Identification and the Pre-Shared key you use; you must match these settings for the Nuage Networks side of the connection in step 6 when you Set Up the Remote Network Tunnel in Nuage Networks.
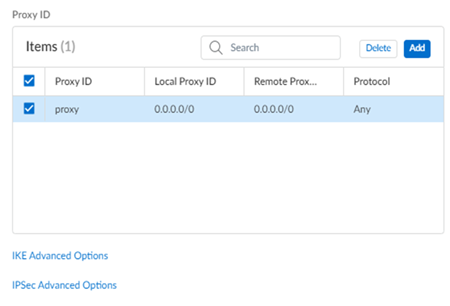
Enable IKE Passive Mode.In the Proxy ID section and Add a default route for all local and remote prefixes.Creating this route ensures that all prefixes in the VPN use this IPSec tunnel.![]() Select IPSec Advanced Options and Create New to create a new IPSec crypto profile for the remote network tunnel using the recommended settings.Make sure you use IPSec crypto settings that are supported with Prisma Access and Nuage Networks SD-WANSelect IKE Advanced Options and Create New to create a new IKE cryptographic profile for the remote network tunnel.Make sure you enable IKE NAT Traversal. The Nuage Network Services Gateway (NSG) initiates the IKE negotiation, and allows the negotiation to occur even if Nuage Networks side is behind NAT. Refer to the IKE crypto settings that are supported with Nuage for the rest of the settings and make a note of the values you use.Save the tunnel configuration.Push your configuration changes.
Select IPSec Advanced Options and Create New to create a new IPSec crypto profile for the remote network tunnel using the recommended settings.Make sure you use IPSec crypto settings that are supported with Prisma Access and Nuage Networks SD-WANSelect IKE Advanced Options and Create New to create a new IKE cryptographic profile for the remote network tunnel.Make sure you enable IKE NAT Traversal. The Nuage Network Services Gateway (NSG) initiates the IKE negotiation, and allows the negotiation to occur even if Nuage Networks side is behind NAT. Refer to the IKE crypto settings that are supported with Nuage for the rest of the settings and make a note of the values you use.Save the tunnel configuration.Push your configuration changes.- Return to and select .
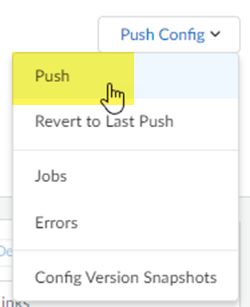
![]() Select Remote Networks.
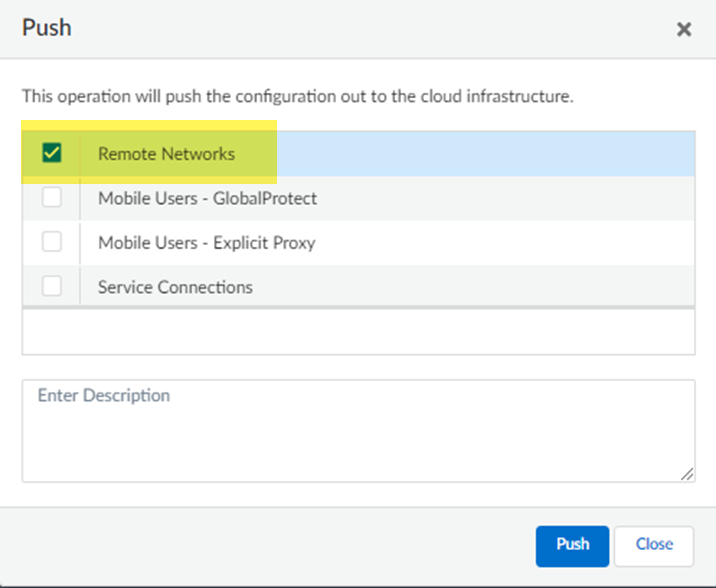
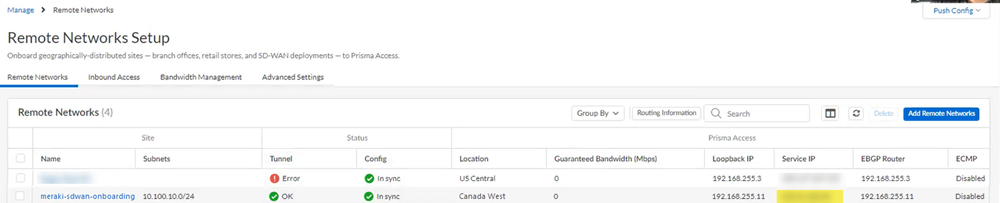
Select Remote Networks.![]() Push your changes.Find the IP address used on the Prisma Access side of the IPSec tunnel.
Push your changes.Find the IP address used on the Prisma Access side of the IPSec tunnel.- Go to and make a note of the Service IP address.You use this IP address as the peer address when you set up the IPSec tunnel on the Meraki SD-WAN.
![]()
Set Up the Remote Network Tunnel in Nuage Networks
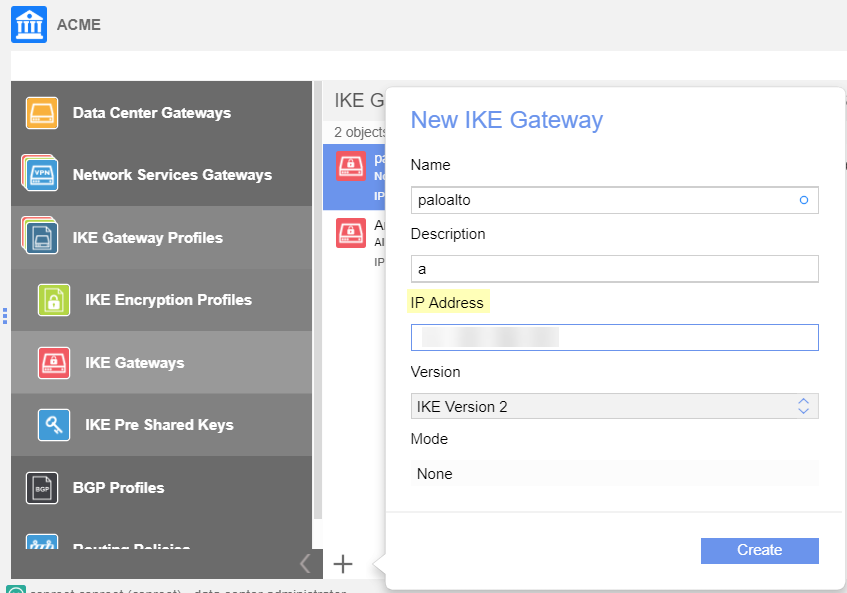
After you configure the remote network tunnel in Prisma Access, configure the tunnel in Nuage Networks by completing the following task.Note that Dead Peer Detection (DPD) is only configured in Nuage Networks. No DPD configuration is required in Prisma Access because the NSG is the DPD initiator and Prisma Access can only reply to requests.- In your organization, create the Gateway using the Nuage Networks IKE gateway object.In the IP Address field, enter the Service IP address that you retrieved after you completed the setup of the remote network tunnel in Prisma Access.
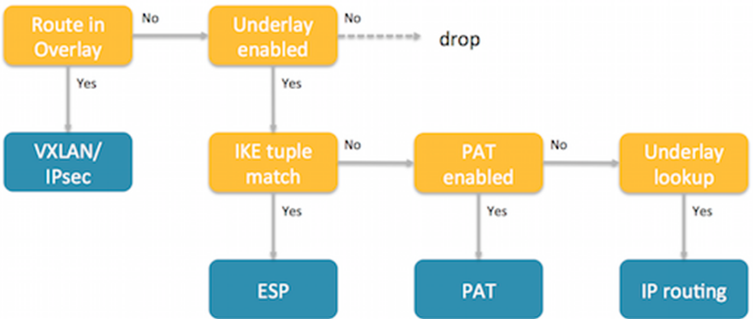
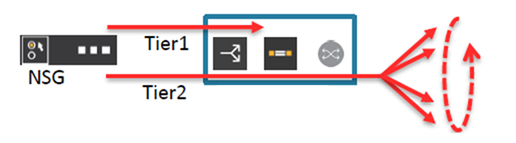
![]() Define the remote subnet for which traffic will be sent to the gateway.The IKE gateway connection uses the underlay breakout mechanism as shown in the following diagram:
Define the remote subnet for which traffic will be sent to the gateway.The IKE gateway connection uses the underlay breakout mechanism as shown in the following diagram:![]() All traffic to Prisma Access is through the underlay. If you enable underlay, and if the remote subnet associated with Prisma Access matches the destination IP in the customer packet, then the Nuage Networks SD-WAN sends the packet to Prisma Access. If the destination IP does not match, the SD-WAN sends the packet to internet breakout using underlay breakout and port address translation (PAT) rules.Specify a default route to the gateway so that the network sends all internet traffic to Prisma Access.
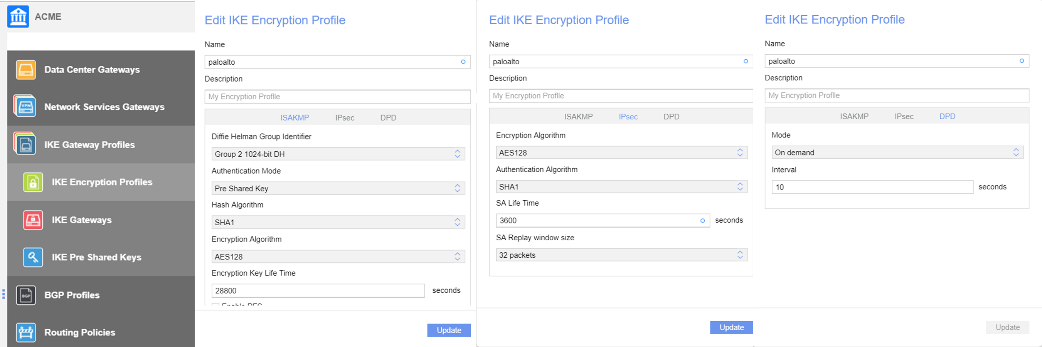
All traffic to Prisma Access is through the underlay. If you enable underlay, and if the remote subnet associated with Prisma Access matches the destination IP in the customer packet, then the Nuage Networks SD-WAN sends the packet to Prisma Access. If the destination IP does not match, the SD-WAN sends the packet to internet breakout using underlay breakout and port address translation (PAT) rules.Specify a default route to the gateway so that the network sends all internet traffic to Prisma Access.![]() Create an IKE encryption profile.This profile must match the values that you specified in the Prisma Access IPSec configuration.
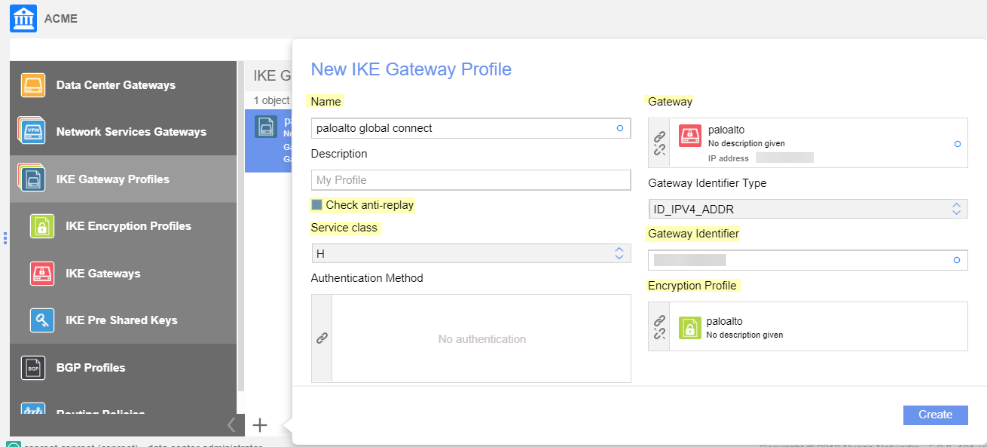
Create an IKE encryption profile.This profile must match the values that you specified in the Prisma Access IPSec configuration.![]() Create an IKE gateway profile.
Create an IKE gateway profile.- Enter a Name for the gateway profile.Select Check anti-replay.Select the Service class.Select the Gateway and Encryption Profile, using the settings you created for Prisma Access.The example in the following screenshot uses one pre-shared key per connection, which means that the IKE Gateway profile won't use a pre-shared key object, and the Authentication Method field is empty.
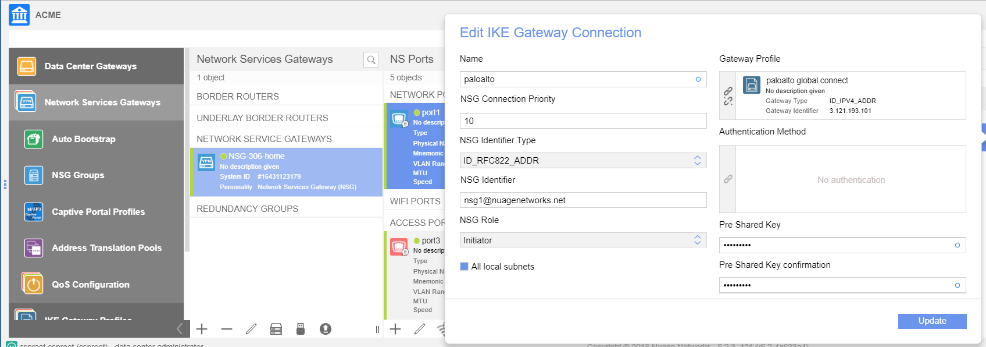
![]() Associate the remote network connection with the NSG uplink port.You associate the remote network connection with the Nuage Networks NSG at the uplink VLAN level. This association contains an NSG identifier in RFC 822 format and includes the pre-shared key that is used for the connection.
Associate the remote network connection with the NSG uplink port.You associate the remote network connection with the Nuage Networks NSG at the uplink VLAN level. This association contains an NSG identifier in RFC 822 format and includes the pre-shared key that is used for the connection.![]() Check the status of the tunnel connection by entering the following command.A status of UP indicates that the connection is successful.
Check the status of the tunnel connection by entering the following command.A status of UP indicates that the connection is successful.A:vsc1# tools vswitch 86.229.176.112 command "nuage-nsg-ike-cli show tunnel-status-summary" ------------------------------------------------------------------------------- Gateway Name Local IP Remote IP Phase1 Phase2 ------------------------------------------------------------------------------- paloalto 192.168.0.103 3.121.193.101 up up -------------------------------------------------------------------------------
Next steps: Learn how Nuage Networks monitors the remote network, and troubleshoot the Nuage Networks remote network connection to Prisma Access, if required.Nuage Networks Dead Peer Detection and Internet Probing
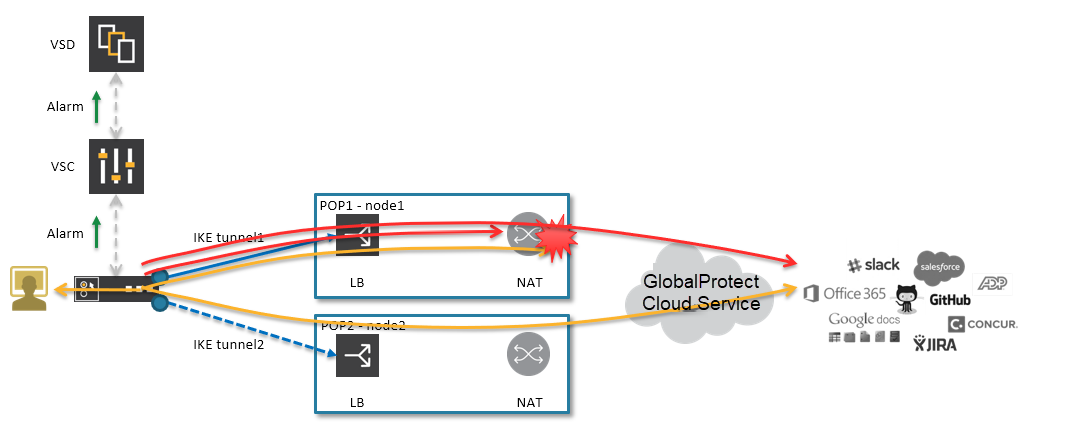
To detect issues with an IKE gateway for the remote network connection, Nuage Networks VNS uses the Dead Peer Detection (DPD) mechanism, in addition to using a probing mechanism to probe internet services.The probes are divided into two hierarchical levels: Tier1 and Tier2. Nuage Networks initiates the probe. The Tier 1 probe tests the connectivity of the remote network connection to Prisma Access and the Tier 2 probe tests the connectivity to the internet.![]() Each connection is composed of an Active IPSec tunnel (priority 100) and a backup IPSec tunnel (priority 200). The HTTP probes run on both connections.
Each connection is composed of an Active IPSec tunnel (priority 100) and a backup IPSec tunnel (priority 200). The HTTP probes run on both connections.![]()
- Tier 1 Probe—Each Tier1 probe is associated to a weight (between 1 and 100%). For Tier1 to fail, the sum of the Tier1 probes that fail must be equal to or greater than 100%. If the Tier1 probe goes down, Tier 2 probe monitoring also goes down.
- Tier 2 Probe—The Tier 2 probe uses round-robin monitoring across a set of internet FQDNs. Consecutive probe tests must fail for the Tier2 probe to fail.
Create an HTTP Probe Object
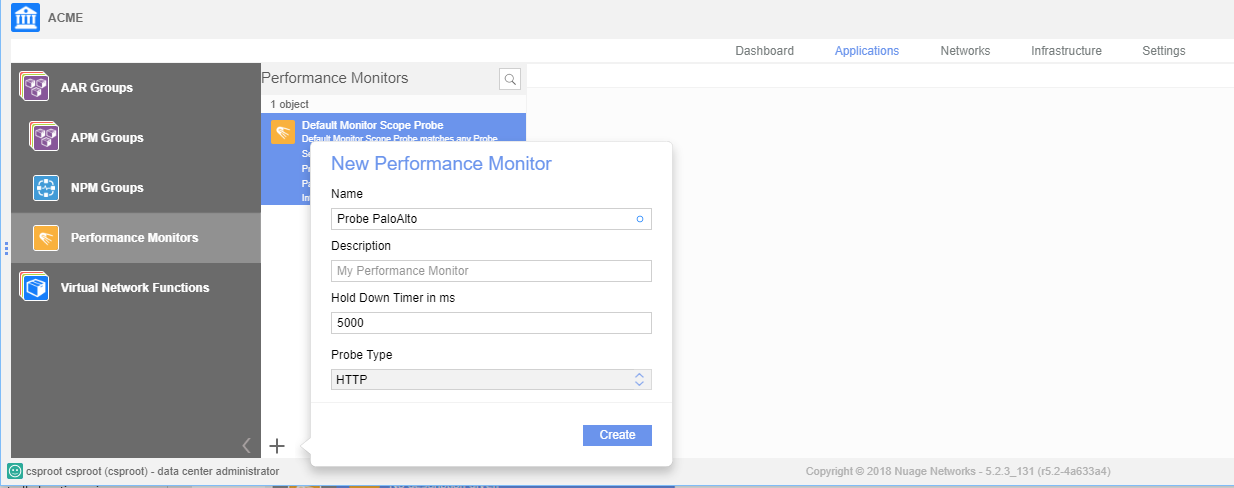
To create an HTTP probe object, complete the following task.- In the Nuage Networks UI, select Performance Monitors.Create a performance monitor with the following values:
- Specify a Hold Down Timer value that defines how long the VSD waits for a response before it determines that the performance monitor is unsuccessful and switches to the backup tunnel. The default is 1000 ms.
- Specify a Probe Type of HTTP.
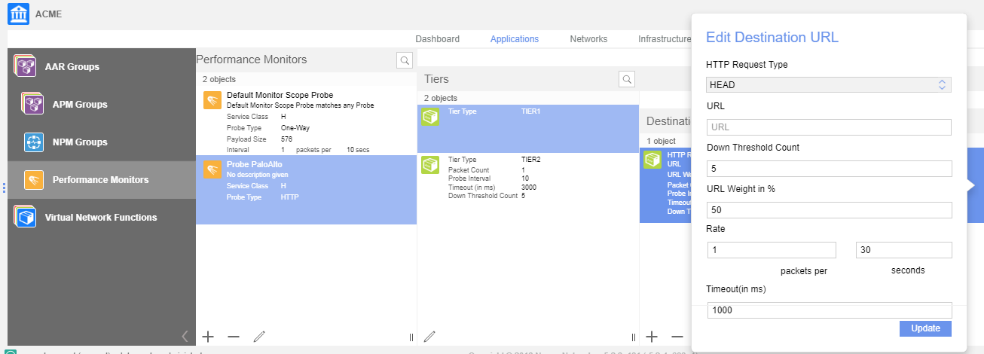
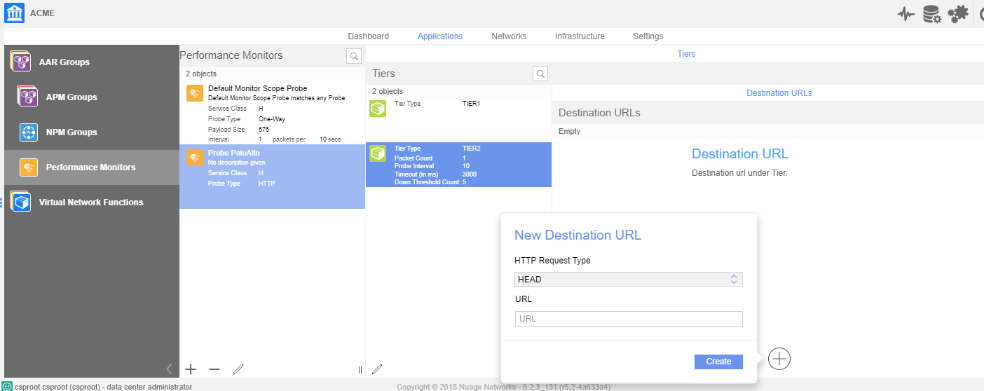
After you click Create, the Nuage VNS creates two tiers: Tier 1 and Tier 2. There is no option to add or Remove tiers.![]() Create Tier 1 URLs, specifying the following values:
Create Tier 1 URLs, specifying the following values:- Down Threshold Count—Defines the number of consecutive failed probes before the VSD declares a state change and raises an alarm.
- HTTP Request Type—Specifies the HTTP request method used for the HTTP ping.
- URL Weight—Defines the percent weight for the URL within Tier 1. The sum of the URL weights in Tier 1 cannot exceed 100.
- URL—Defines the HTTP or HTTPS target. Specify one URL up to 2000 characters long.
- Rate—Defines the rate at which the probe sends probe packets to the destination target.
- Timeout (ms)—Defines how long the VSD waits for a response before considering a probe unsuccessful.
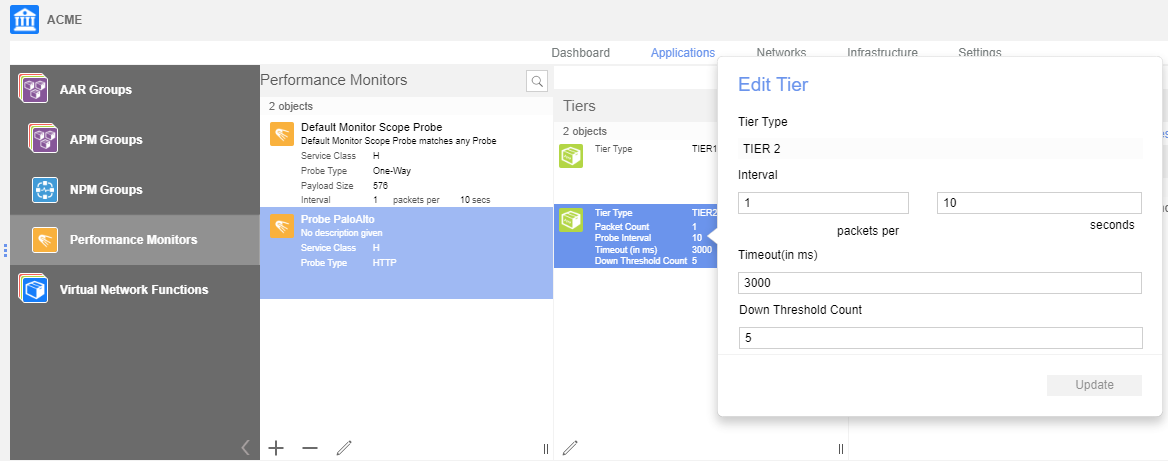
![]() Edit Tier 2 options to change the interval and timeout values of the Tier 2 probe by specifying the following values:
Edit Tier 2 options to change the interval and timeout values of the Tier 2 probe by specifying the following values:- Interval (s)—Defines the rate at which the probe sends packets to the destination target.
- Probe Timeout (ms)—This parameter defines how long the VSD waits for a response before it determines a probe to be unsuccessful.
- Down Threshold Count—This parameter defines the number of consecutive failed probes before the VSD declares a state change and raises an alarm.
![]() Create Tier 2 URLs with the following values:
Create Tier 2 URLs with the following values:- HTTP Request Type—Specifies the HTTP request method that is used for the HTTP ping.
- URL—Defines the HTTP or HTTPS target. Specify one URL up to 2000 characters long.
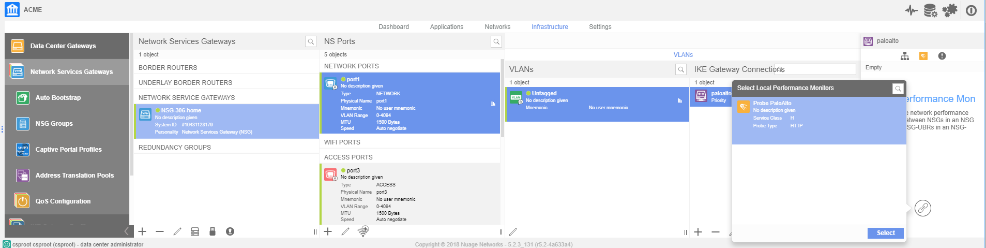
![]() After you create the HTTP probe object with Tier 1 and Tier 2 information, associate the probe to the active and backup IPSec tunnel.
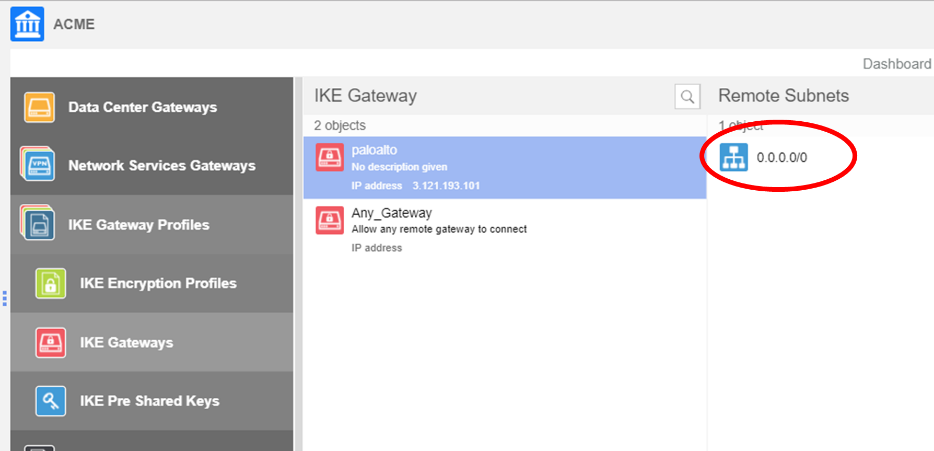
After you create the HTTP probe object with Tier 1 and Tier 2 information, associate the probe to the active and backup IPSec tunnel.![]() The following condition must apply to associate a probe with an IKE gateway connection:
The following condition must apply to associate a probe with an IKE gateway connection:- The remote subnet associated with IKE gateway must be 0.0.0.0/0.
- You must associate all local subnets with the uplink IPSec connection.
If you do not meet the preceding conditions, tunnel association fails.Troubleshoot the Remote Network
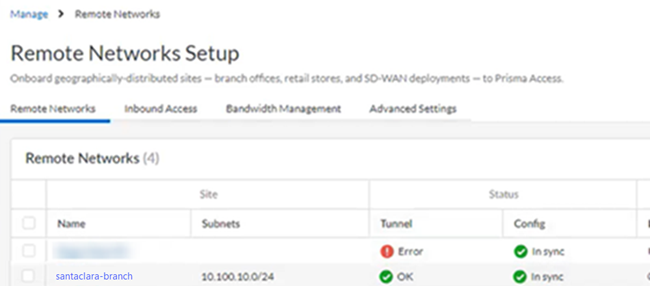
Prisma Access provides logs and widgets that provide you with the status of remote tunnels and the status of each tunnel.- Go to and check the Status of the tunnel.
![]()
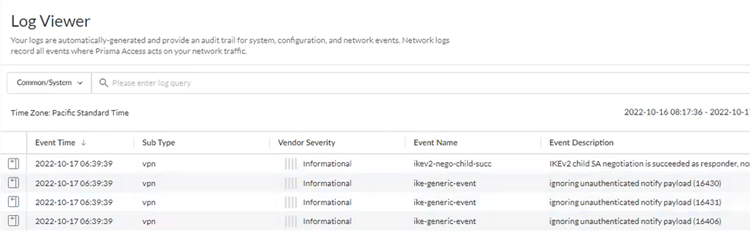
- Go to and check the Common/System logs for IPSec- and IKE-related messages.To view VPN-relates messages, set the filter to sub_type.value = vpn.The message ignoring unauthenticated notify payload indicates that the route has not been added in the crypto map on the other side of the IPSec tunnel after the IPSec negotiation has already occurred.
![]()
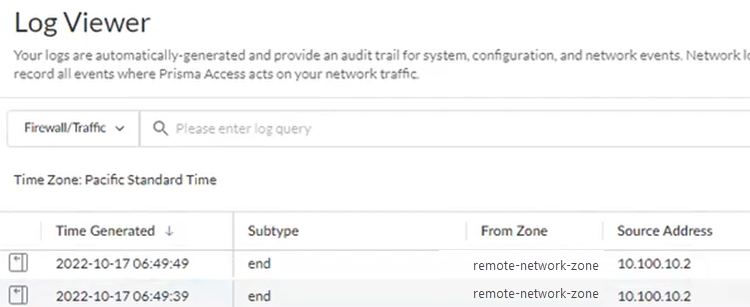
- Check the Firewall/Traffic logs and view the messages that are coming from the zone that has the same name as the remote network.In the logs, the remote network name is used as the source zone.
![]()
Integrate Prisma Access with Nuage SD-WAN (Panorama)
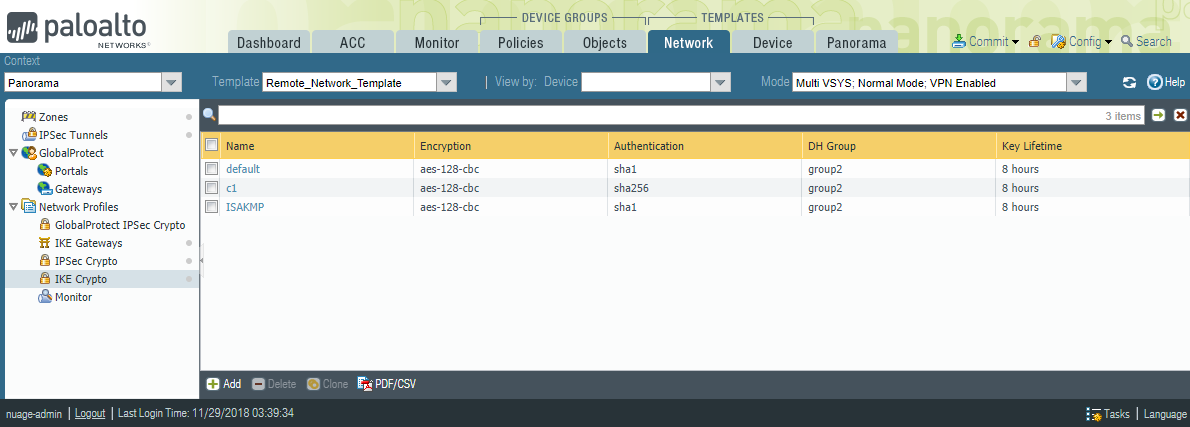
Complete the following task to configure the remote network connection as a site-to-site IPSec tunnel.- Select and Add an IKE crypto profile for the IPSec tunnel.Make sure you have specified the Template of Remote_Network_Template before starting this task.
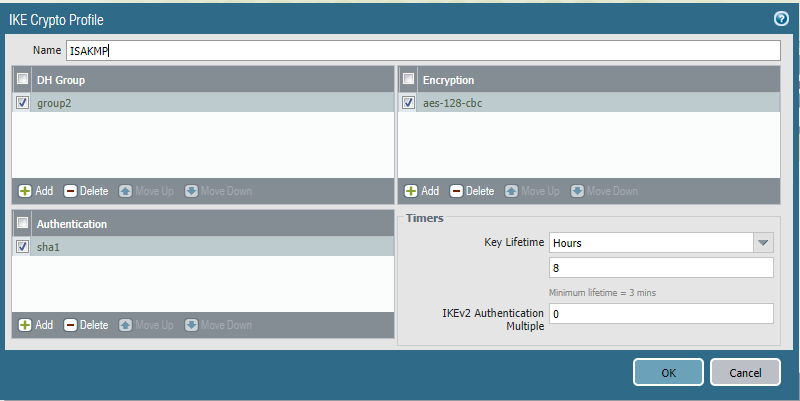
![]() Give the profile a name and specify IKE settings.Make a note of these settings; you specify the same settings when you create the IPSec tunnel in the Nuage Networks SD-WAN.
Give the profile a name and specify IKE settings.Make a note of these settings; you specify the same settings when you create the IPSec tunnel in the Nuage Networks SD-WAN.![]() Select and Add a new IPSec crypto profile.
Select and Add a new IPSec crypto profile.![]() Specify a name for the profile and specify IPSec crypto parameters.Make a note of these parameters; you specify these same parameters when you configure the Nuage Networks side of the remote network tunnel in a later task.
Specify a name for the profile and specify IPSec crypto parameters.Make a note of these parameters; you specify these same parameters when you configure the Nuage Networks side of the remote network tunnel in a later task.![]() Select and Add a new IKE gateway.
Select and Add a new IKE gateway.![]() Specify a Name, Version, Peer IP Address Type, and Authentication, and specify a Peer Identification that will be synchronized with the Nuage Networks configuration.Make note of the of the User FQDN (email address) that you use for the Peer Identification and the Pre-Shared key you use; you must match these settings for the Nuage Networks side of the connection in step 6 when you Set Up the Remote Network Tunnel in Nuage Networks.
Specify a Name, Version, Peer IP Address Type, and Authentication, and specify a Peer Identification that will be synchronized with the Nuage Networks configuration.Make note of the of the User FQDN (email address) that you use for the Peer Identification and the Pre-Shared key you use; you must match these settings for the Nuage Networks side of the connection in step 6 when you Set Up the Remote Network Tunnel in Nuage Networks.![]() Click the Advanced Options tab and make sure that Enable Passive Mode and Enable NAT Traversal are selected.The Nuage Network Services Gateway (NSG) initiates the IKE negotiation, and allows the negotiation to occur even if Nuage Networks side is behind NAT.
Click the Advanced Options tab and make sure that Enable Passive Mode and Enable NAT Traversal are selected.The Nuage Network Services Gateway (NSG) initiates the IKE negotiation, and allows the negotiation to occur even if Nuage Networks side is behind NAT.![]() Select and Add an IPSec tunnel.
Select and Add an IPSec tunnel.![]() Select the IKE Gateway and IPSec Crypto Profile you created earlier in this task.
Select the IKE Gateway and IPSec Crypto Profile you created earlier in this task.![]() Select the Proxy IDs tab and create a default route for all local and remote prefixes.Creating this route ensures that all prefixes in the VPN use this IPSec tunnel.
Select the Proxy IDs tab and create a default route for all local and remote prefixes.Creating this route ensures that all prefixes in the VPN use this IPSec tunnel.![]() Add a new remote network connection.
Add a new remote network connection.- Select and Add the connection.
![]() Enter a Name, select the Bandwidth and Region, and select the IPSec Tunnel you specified in a previous step, and specify a route to the Nuage Networks SD-WAN.You cannot change the name of this tunnel after you create it.This example specifies a Static Route to the Nuage Networks SD-WAN with an IP address of 10.61.0.0/16.
Enter a Name, select the Bandwidth and Region, and select the IPSec Tunnel you specified in a previous step, and specify a route to the Nuage Networks SD-WAN.You cannot change the name of this tunnel after you create it.This example specifies a Static Route to the Nuage Networks SD-WAN with an IP address of 10.61.0.0/16.![]() Commit the configuration changes to Panorama and push the configuration out to Prisma Access for remote networks.
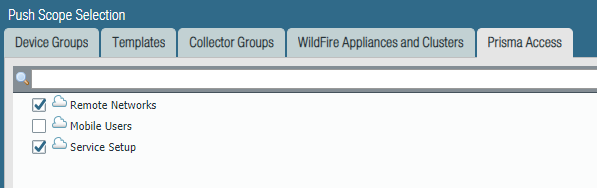
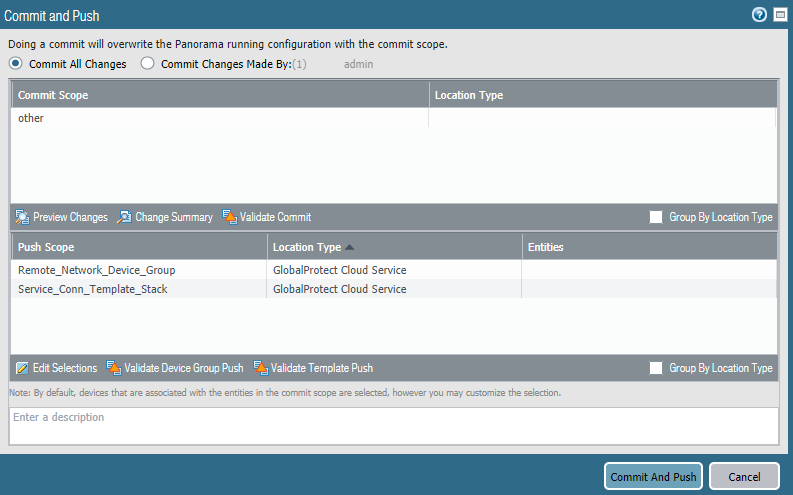
Commit the configuration changes to Panorama and push the configuration out to Prisma Access for remote networks.- Click .Click . Click , and select both Prisma Access for remote networks and Prisma Access for service setup to push the configuration out to the service.
![]() Click OK, then click Commit and Push.
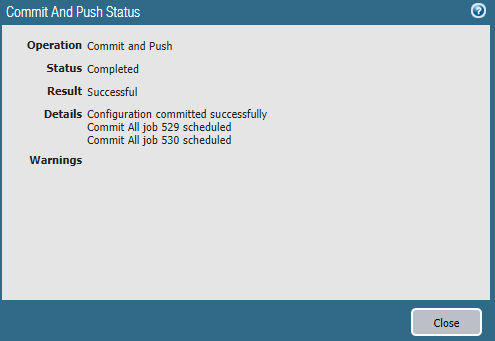
Click OK, then click Commit and Push.![]() Prisma Access displays a success page after the commit succeeds.
Prisma Access displays a success page after the commit succeeds.![]() Make a note of the Service IP address of the Prisma Access side of the tunnel. To find this address in Panorama, select , click the Remote Networks radio button, and find the address in the Service IP Address field.
Make a note of the Service IP address of the Prisma Access side of the tunnel. To find this address in Panorama, select , click the Remote Networks radio button, and find the address in the Service IP Address field.Set Up the Remote Network Tunnel in Nuage Networks
After you configure the remote network tunnel in Prisma Access, configure the tunnel in Nuage Networks by completing the following task.Note that Dead Peer Detection (DPD) is only configured in Nuage Networks. No DPD configuration is required in Prisma Access because the NSG is the DPD initiator and Prisma Access can only reply to requests.- In your organization, create the Gateway using the Nuage Networks IKE gateway object.In the IP Address field, enter the Service IP address that you retrieved after you completed the setup of the remote network tunnel in Prisma Access.
![]() Define the remote subnet for which traffic will be sent to the gateway.The IKE gateway connection uses the underlay breakout mechanism as shown in the following diagram:
Define the remote subnet for which traffic will be sent to the gateway.The IKE gateway connection uses the underlay breakout mechanism as shown in the following diagram:![]() All traffic to Prisma Access is through the underlay. If you enable underlay, and if the remote subnet associated with Prisma Access matches the destination IP in the customer packet, then the Nuage Networks SD-WAN sends the packet to Prisma Access. If the destination IP does not match, the SD-WAN sends the packet to internet breakout using underlay breakout and port address translation (PAT) rules.Specify a default route to the gateway so that the network sends all internet traffic to Prisma Access.
All traffic to Prisma Access is through the underlay. If you enable underlay, and if the remote subnet associated with Prisma Access matches the destination IP in the customer packet, then the Nuage Networks SD-WAN sends the packet to Prisma Access. If the destination IP does not match, the SD-WAN sends the packet to internet breakout using underlay breakout and port address translation (PAT) rules.Specify a default route to the gateway so that the network sends all internet traffic to Prisma Access.![]() Create an IKE encryption profile.This profile must match the values that you specified in the Prisma Access IPSec configuration.
Create an IKE encryption profile.This profile must match the values that you specified in the Prisma Access IPSec configuration.![]() Create an IKE gateway profile.
Create an IKE gateway profile.- Enter a Name for the gateway profile.Select Check anti-replay.Select the Service class.Select the Gateway and Encryption Profile, using the settings you created for Prisma Access.The example in the following screenshot uses one pre-shared key per connection, which means that the IKE Gateway profile won't use a pre-shared key object, and the Authentication Method field is empty.
![]() Associate the remote network connection with the NSG uplink port.You associate the remote network connection with the Nuage Networks NSG at the uplink VLAN level. This association contains an NSG identifier in RFC 822 format and includes the pre-shared key that is used for the connection.
Associate the remote network connection with the NSG uplink port.You associate the remote network connection with the Nuage Networks NSG at the uplink VLAN level. This association contains an NSG identifier in RFC 822 format and includes the pre-shared key that is used for the connection.![]() Check the status of the tunnel connection by entering the following command.A status of UP indicates that the connection is successful.
Check the status of the tunnel connection by entering the following command.A status of UP indicates that the connection is successful.A:vsc1# tools vswitch 86.229.176.112 command "nuage-nsg-ike-cli show tunnel-status-summary" ------------------------------------------------------------------------------- Gateway Name Local IP Remote IP Phase1 Phase2 ------------------------------------------------------------------------------- paloalto 192.168.0.103 3.121.193.101 up up -------------------------------------------------------------------------------
Next steps: Learn how Nuage Networks monitor the remote network, and troubleshoot the Nuage Networks remote network connection to Prisma Access, if required.Nuage Networks Dead Peer Detection and Internet Probing
To detect issues with an IKE gateway for the remote network connection, Nuage Networks VNS uses the Dead Peer Detection (DPD) mechanism, in addition to using a probing mechanism to probe internet services.The probes are divided into two hierarchical levels: Tier1 and Tier2. Nuage Networks initiates the probe. The Tier 1 probe tests the connectivity of the remote network connection to Prisma Access and the Tier 2 probe tests the connectivity to the internet.![]() Each connection is composed of an Active IPSec tunnel (priority 100) and a backup IPSec tunnel (priority 200). The HTTP probes run on both connections.
Each connection is composed of an Active IPSec tunnel (priority 100) and a backup IPSec tunnel (priority 200). The HTTP probes run on both connections.![]()
- Tier 1 Probe—Each Tier1 probe is associated to a weight (between 1 and 100%). For Tier1 to fail, the sum of the Tier1 probes that fail must be equal to or greater than 100%. If the Tier1 probe goes down, Tier 2 probe monitoring also goes down.
- Tier 2 Probe—The Tier 2 probe uses round-robin monitoring across a set of internet FQDNs. Consecutive probe tests must fail for the Tier2 probe to fail.
Create an HTTP Probe Object
To create an HTTP probe object, complete the following task.- In the Nuage Networks UI, select Performance Monitors.Create a performance monitor with the following values:
- Specify a Hold Down Timer value that defines how long the VSD waits for a response before it determines that the performance monitor is unsuccessful and switches to the backup tunnel. The default is 1000 ms.
- Specify a Probe Type of HTTP.
After you click Create, the Nuage VNS creates two tiers: Tier 1 and Tier 2. There is no option to add or Remove tiers.![]() Create Tier 1 URLs, specifying the following values:
Create Tier 1 URLs, specifying the following values:- Down Threshold Count—Defines the number of consecutive failed probes before the VSD declares a state change and raises an alarm.
- HTTP Request Type—Specifies the HTTP request method used for the HTTP ping.
- URL Weight—Defines the percent weight for the URL within Tier 1. The sum of the URL weights in Tier 1 cannot exceed 100.
- URL—Defines the HTTP or HTTPS target. Specify one URL up to 2000 characters long.
- Rate—Defines the rate at which the probe sends probe packets to the destination target.
- Timeout (ms)—Defines how long the VSD waits for a response before considering a probe unsuccessful.
![]() Edit Tier 2 options to change the interval and timeout values of the Tier 2 probe by specifying the following values:
Edit Tier 2 options to change the interval and timeout values of the Tier 2 probe by specifying the following values:- Interval (s)—Defines the rate at which the probe sends packets to the destination target.
- Probe Timeout (ms)—This parameter defines how long the VSD waits for a response before it determines a probe to be unsuccessful.
- Down Threshold Count—This parameter defines the number of consecutive failed probes before the VSD declares a state change and raises an alarm.
![]() Create Tier 2 URLs with the following values:
Create Tier 2 URLs with the following values:- HTTP Request Type—Specifies the HTTP request method that is used for the HTTP ping.
- URL—Defines the HTTP or HTTPS target. Specify one URL up to 2000 characters long.
![]() After you create the HTTP probe object with Tier 1 and Tier 2 information, associate the probe to the active and backup IPSec tunnel.
After you create the HTTP probe object with Tier 1 and Tier 2 information, associate the probe to the active and backup IPSec tunnel.![]() The following condition must apply to associate a probe with an IKE gateway connection:
The following condition must apply to associate a probe with an IKE gateway connection:- The remote subnet associated with IKE gateway must be 0.0.0.0/0.
- You must associate all local subnets with the uplink IPSec connection.
If you do not meet the preceding conditions, tunnel association fails.Troubleshoot the Remote Network
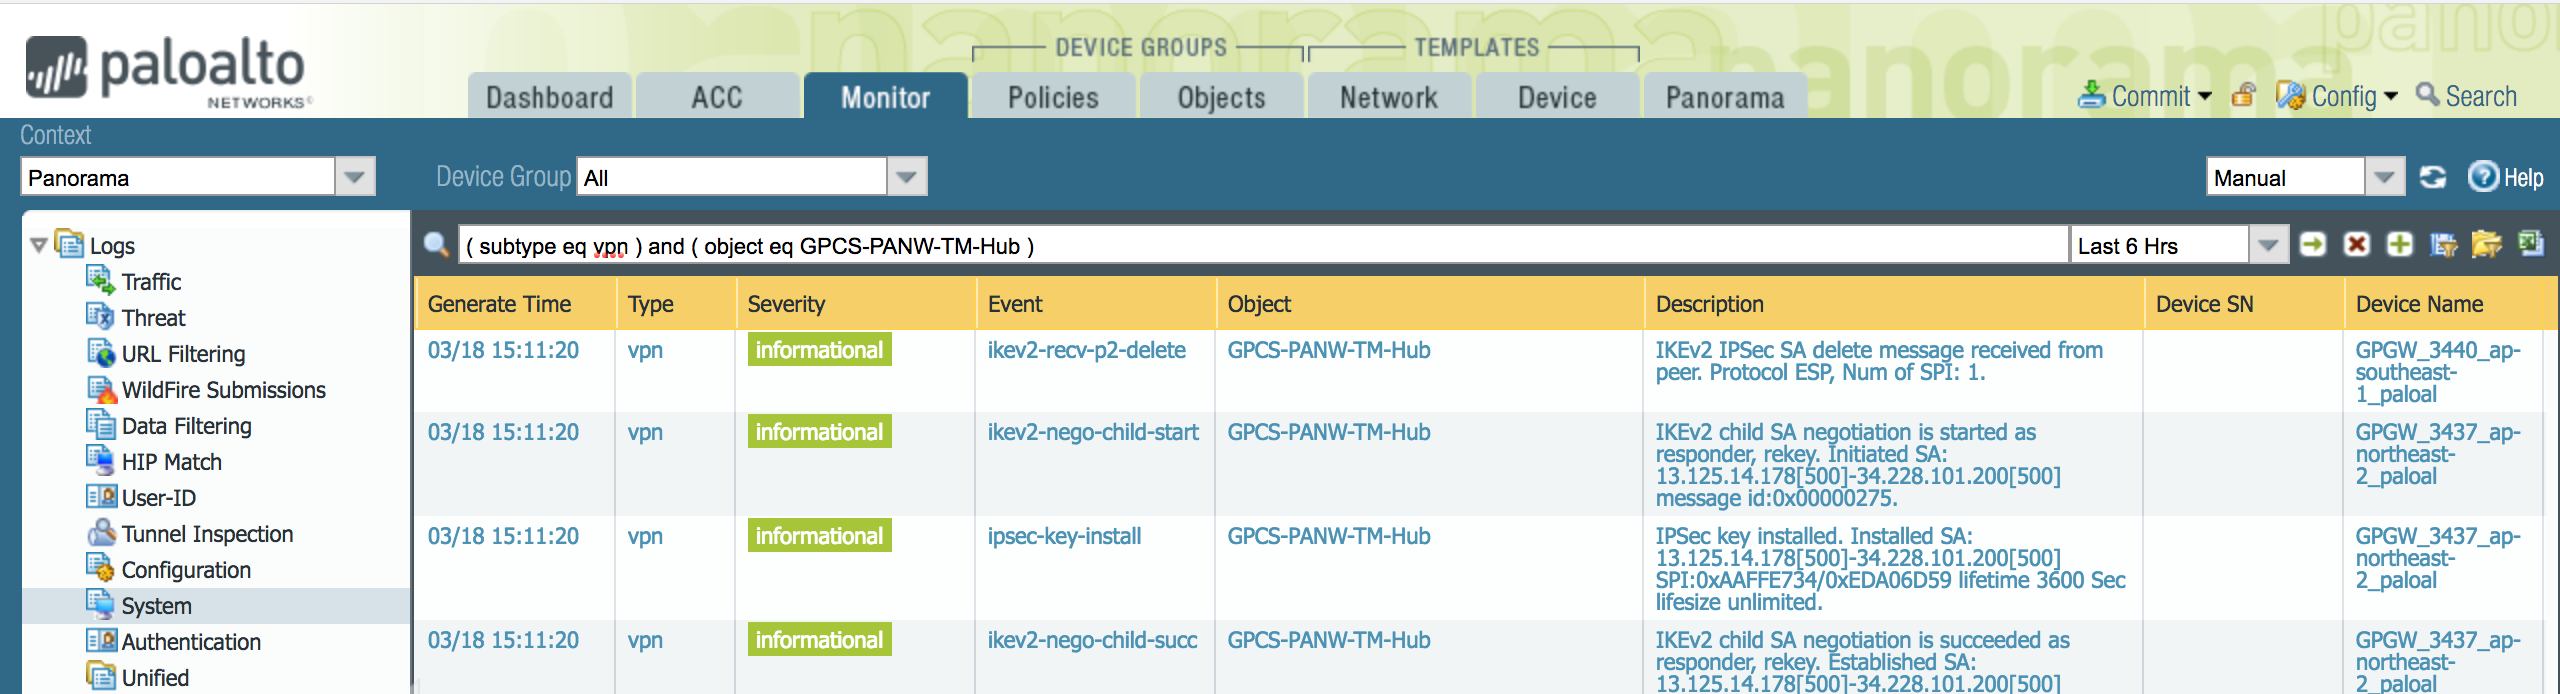
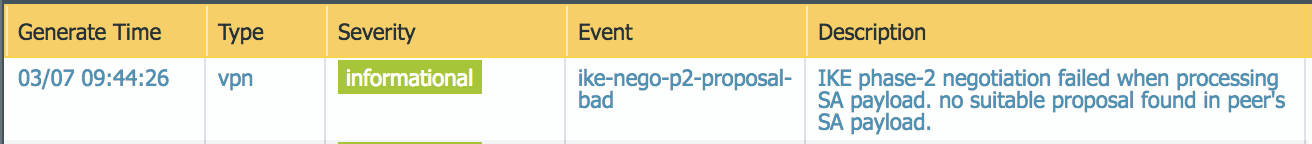
Prisma Access provides logs that provide you with the status of remote tunnels and the status of each tunnel. To view these logs in Panorama, select .To debug tunnel issues, you can filter for tunnel-specific logs by using the object identifier corresponding to that tunnel. The following figures show errors related to tunnel misconfiguration and negotiation issues.![]()
![]()
![]()
![]()
![]()
![]()