Advanced URL Filtering
Generate, Schedule, and Share URL Filtering Reports
Table of Contents
Generate, Schedule, and Share URL Filtering Reports
Learn how to schedule and share various reports relevant for URL filtering and web
activity.
| Where can I use this? | What do I need? |
|---|---|
|
Notes:
|
Palo Alto Networks provides multiple report types in addition to User Activity reports to help you monitor and analyze URL filtering and
web activity. Reporting capabilities also help you validate Security policy rules
and focus your efforts on keeping users safe and productive. On certain platforms,
you can create custom reports by filtering on specific conditions and columns,
focusing on information that matters most to you. You can create custom reports, for
instance, to identify policy rule gaps for certain traffic. You can also specify a
time period during which data is collected and the frequency at which recipients
receive reports. Reports are downloadable as PDFs.
Generate reports regularly to understand traffic matching your tuning rules. Report
insights help you update policy rules to accommodate legitimate websites and
applications. Reports can also help you evaluate web and web application risks and
make appropriate policy rule changes.
Schedule and Share URL Filtering Reports (Strata Cloud Manager)
All reports except for Activity Insights: Users need to be
scheduled and shared from the Reports menu. The Reports menu
includes the following report types that are most relevant to URL filtering:
- Activity Insights – Summary: Monitor traffic usage, and view the top applications, threats, users, URLs, and rules in your network.
- App Usage Report: Know the security challenges associated with the applications traversing your network. Key findings here help you to refine security rules for unsanctioned and risky applications.
- Executive Summary: See how your security subscriptions are protecting you. Peer data gives you perspective on your industry's threat landscape and — for subscriptions you're not using — shows you where you might be exposed to threats.
- Network Activity: Get a view into the different sources generating traffic in your network, and drill down to investigate any unexpected findings.
- User Activity: Get visibility into an individual users' browsing patterns: their most frequently visited sites, the sites with which they're transferring data, and attempts to access high-risk sites.
For more information, see Download, Schedule, or Share a Report.
Schedule and Share URL Filtering Reports (PAN-OS & Panorama)
- Add a new custom report.
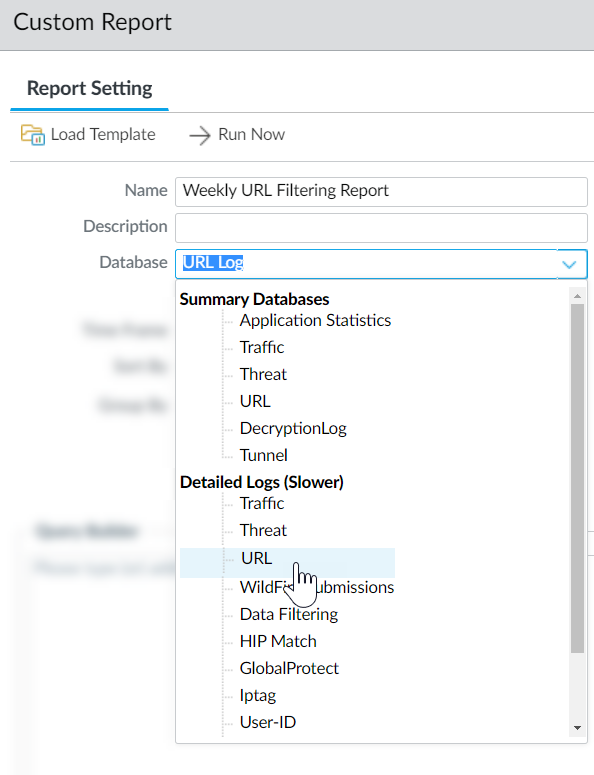
- Select MonitorManage Custom Reports and Add a report.Give the report a unique Name, and optionally a Description.Select the Database you want to use to generate the report. To generate a detailed URL Filtering report, select URL from the Detailed Logs section:
![]() Configure report options.
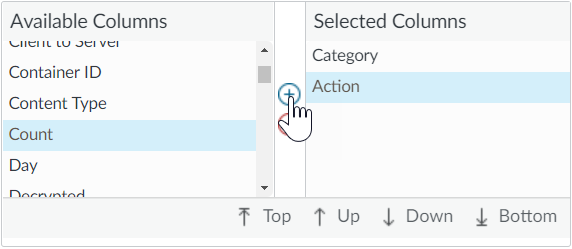
Configure report options.- Select a predefined Time Frame or select Custom.Select the log columns to include in the report from the Available Columns list add them () to the Selected Columns. For example, for a URL Filtering report you might select:
![]()
- Action
- App Category
- Category
- Destination Country
- Source User
- URL
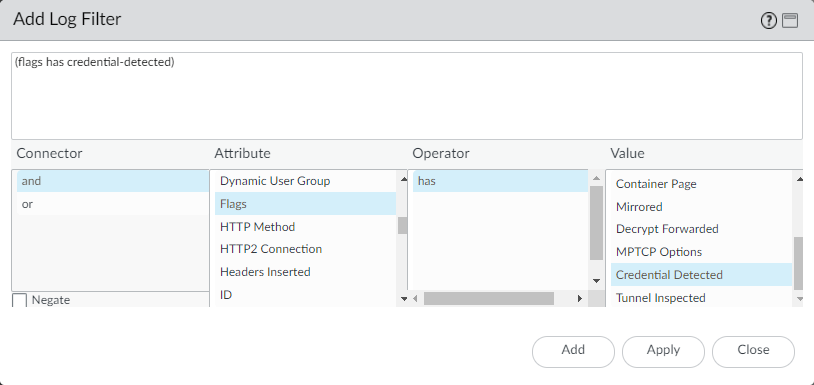
![]() If the firewall is enabled to prevent credential phishing, select the Attribute Flags, the Operator has and the Value Credential Detected to also include events in the report that record when a user submitted a valid corporate credential to a site.
If the firewall is enabled to prevent credential phishing, select the Attribute Flags, the Operator has and the Value Credential Detected to also include events in the report that record when a user submitted a valid corporate credential to a site.![]() (Optional) Select a Sort By option to set the attribute to use to aggregate the report details. If you do not select an attribute to sort by, the report will return the first N number of results without any aggregation. Select a Group By attribute to use as an anchor for grouping data. The following example shows a report with Group By set to App Category and Sort By set to a Count of Top 5.
(Optional) Select a Sort By option to set the attribute to use to aggregate the report details. If you do not select an attribute to sort by, the report will return the first N number of results without any aggregation. Select a Group By attribute to use as an anchor for grouping data. The following example shows a report with Group By set to App Category and Sort By set to a Count of Top 5.![]() Run the report.
Run the report.- Click the Run Now icon to immediately generate the report, which opens in a new tab.When you are done reviewing the report, go back to the Report Setting tab and either tune the settings and run the report again, or continue to the next step to schedule the report.Select the Schedule check box to run the report once per day. This will generate a daily report that details web activity over the last 24 hours.Commit the configuration.View the custom report.
- Select MonitorReports.Expand the Custom Reports pane in the right column and select the report you want to view. The latest report displays automatically.To view the report for a previous date, select the date from the calendar. You can also export the report to PDF, CSV, or XML.


