Autonomous DEM
View Application Experience for a Specific User
Table of Contents
View Application Experience for a Specific User
When you select a user, you can drill down into the details for the user as the
number of devices that the user is logged into and the applications that the user is using.
| Where Can I Use This? | What Do I Need? |
|---|---|
|
|
The User Details page provides a user view for a single Mobile
User. If a user is logged into more than one device, the User's
Devices widget displays one card for each device that the user is logged
in to. Select a tile to view the user experience on that device. You can see the overall
application experience score across the organization in the device tile. View the
experience score trend over the selected time range for each of the monitored
applications on that device under Applications.
You can configure a time range or Add Filters to control
the kind of information that displays on the page.
- User's Devices
- Impact Over Time
- Application Domains
- User’s Experience on Domain
- Application Performance Metrics
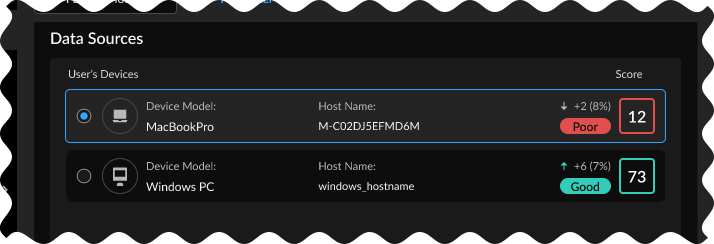
User's Devices
- User's Devices Lists the devices that a user has logged into and the experience score for each.
- Select a device to view user experience insights for the device.
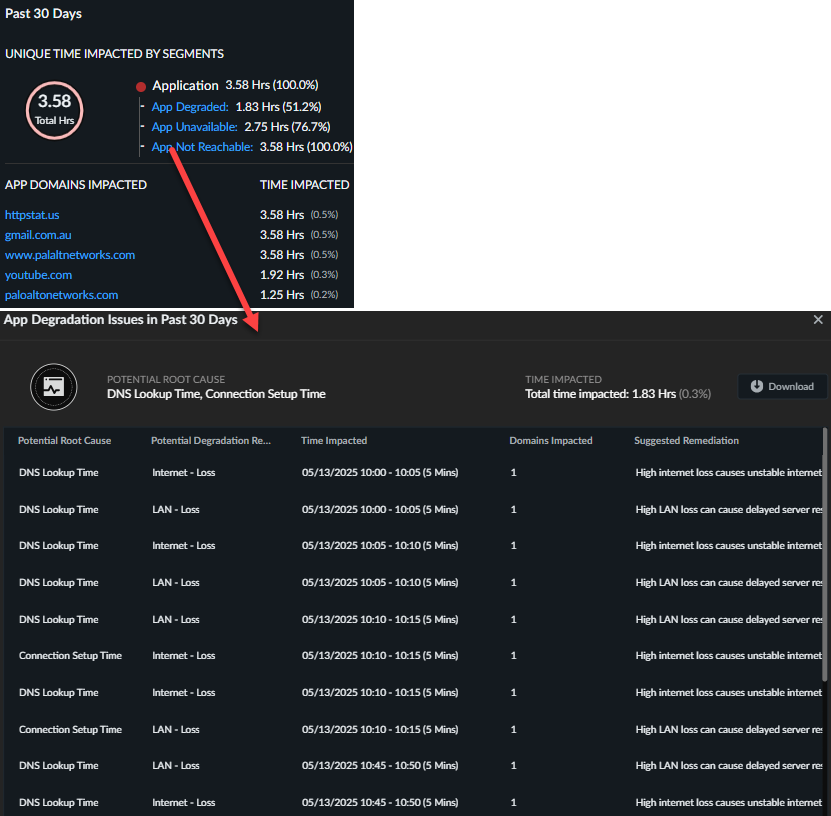
Impact Over Time
Shows the different factors that contributed to a degraded experience over your
configured time range.
| Unique Time Impacted |
The number of minutes during the selected time range
during which one or more service delivery segments were impacted
for this user.
If two or more segments are impacted at the same time,
ADEM counts only the time that the user was impacted, not the
total time of each segment.
For example, only Device and Wi-Fi impact the user
between 10am and 10:15am. Then, the Unique Time Impacted is only
15 minutes, even though Device was impacted for 15 minutes and
Wi-Fi was impacted for 15 minutes.
|
| Segments Impacted | The number of minutes where the segment score for the user over the configured time range is impacted. |
| App Domains Impacted | The domains that were impacted the longest as measured by synthetic app testing or during user browsing. |
| Time Impacted | The amount of time each domain was impacted during synthetic app testing or user browsing. |
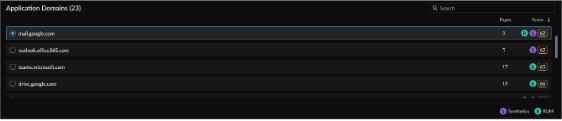
Application Domains
Lists the application domains that the user accessed. You can Search for a
specific domain that you are interested in. Selecting a domain shows the user’s
experience on that domain.
User’s Experience on Domain
When you select an application domain, these widgets display information
about the user’s experience on that domain.
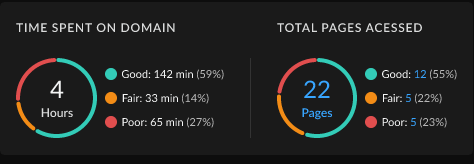
| Time Spent on Domain | The amount of time the user spent accessing the domain and the experience score breakdown for that time. |
| Total Pages Accessed | The number of pages the user accessed on the domain and the experience score breakdown for those pages. |
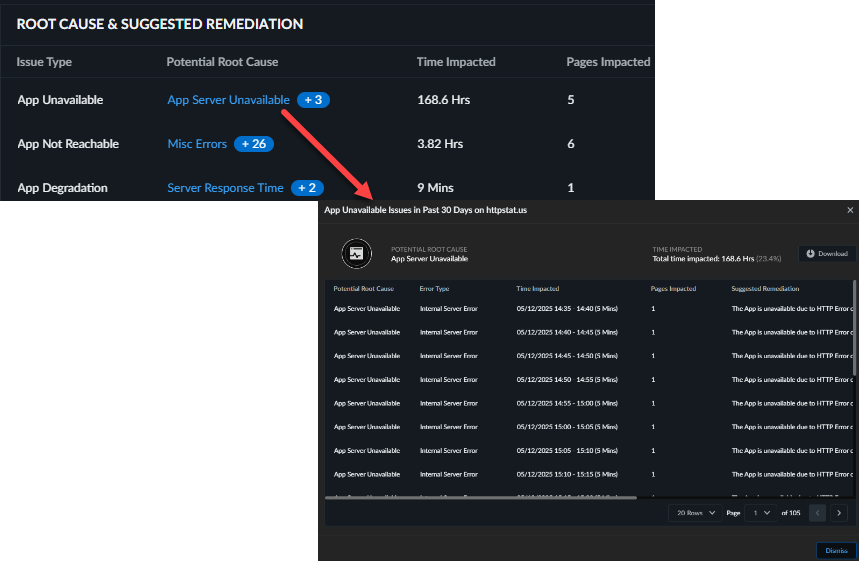
| Segment Impacted | Impacted network segments and the root cause affecting them. Select the segment to view more details about the issue, including suggested remediations. |
| Root Cause Analysis | The root cause of the experience degradation. If multiple root causes, the name of the one impacting the segment for the longest time appears in the table and the number of additional causes appears next to its name. Hover over the number to see other root causes. |
| Pages Impacted | The number of pages with degraded experience due to the root cause during the selected time period. |
| Time Impacted | The number of minutes ADEM considered the segment impacted. |
| % Time Impacted | The percentage that the particular segment was impacted out Unique Time Impacted. |
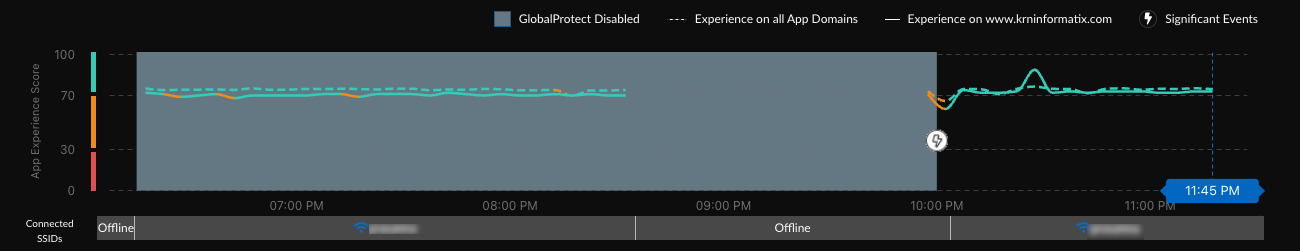
A line graph comparing the
experience score for the user on the selected domain to the user’s experience on
all apps. The experience score comes from either RUM, synthetic metrics, or
both, depending on which is available.
The chart also indicates whether
the user was connected to GlobalProtect so you can assess the impact
of GlobalProtect on their application experience. The chart also
marks Significant Events, such as when the user
disconnected or reconnected to GlobalProtect, clearly showing you
when important changes took place to help you focus your
investigations.
Below the chart, you can see the networks that the user
was connected to during their browser activity.
A time series histogram of the user’s
experience on different pages of the selected domain, based on RUM
data.
The histogram represents the total pages that the user accessed
during the selected time range. The time interval is proportional to the time
range selected. Example: if you select a time range of 3 hours, the histogram
time interval will be every 5 minutes.
The green part is the proportion
of pages during a time interval that had good experience. The red is degraded
experience.
Learn more about the degraded pages by selecting the red part.
This will show you the degraded pages, root cause analysis, suggested
remediation, and more details to help you investigate the cause of the
degradation.

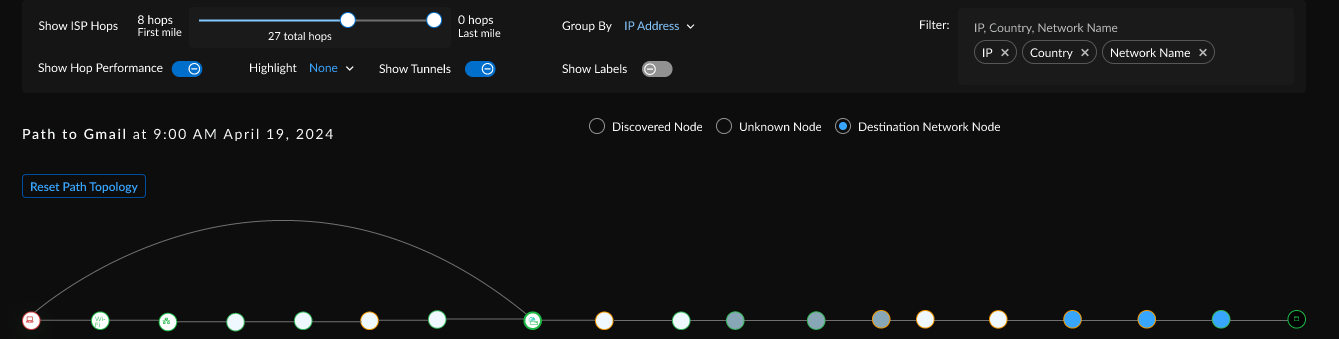
The network segments through which the
user’s traffic traveled to the app. The experience score for a segment
determines its color. If only RUM data is available, the only segments displayed
are Device and App (in this case, Gmail).
- Synthetic monitoring and RUM, or synthetic monitoring only
![]()
- RUM only
![]()
- RUM only with synthetic tests enabled for other domains
![]()


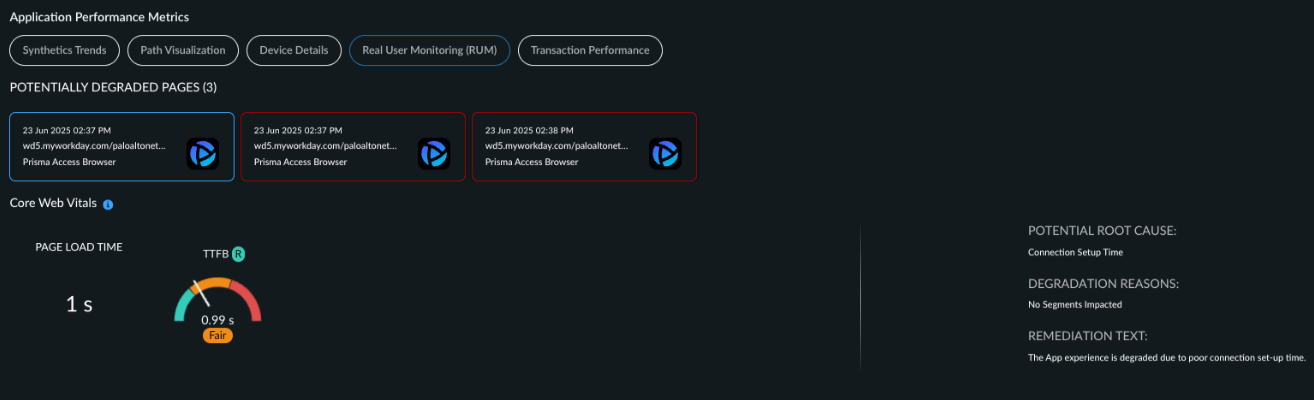
Application Performance Metrics
A series of visualizations for different aspects of application performance for the
user and the selected domain. The visualizations available depend on whether RUM
metrics exist for the user and whether you’ve configured an application test for the
application.
Select a node on the service delivery path to view relevant metrics for it. For
example, select Wi-Fi to view Wi-Fi Metrics.
(Application Test Required) Synthetic Trends
Track responsiveness and availability metrics for all your monitored applications
as well as the health of your devices in this widget. Select the card for the
device in the User's Devices widget to view its Device Health
Metrics or click on an application card to view its
Application Performance Metrics.

You can select any or all of the following metrics by selecting their check
boxes.
| Metric | Description |
|---|---|
| Availability | Application availability (in percentage) during the Time Range. |
| DNS Lookup | DNS resolution time. |
| TCP Connect | Time taken to establish a TCP connection. |
| SSL Connect | Time taken to establish an SSL connection. |
| HTTP Latency | Time taken to establish an HTTP connection. |
| Time to First Byte | The total of DNS Lookup, TCP Connect, SSL Connect and HTTP Latency time results in the Time to First Byte. |
| Data Transfer | Total time taken for the entire data to be transferred. |
| Time to Last Byte | Time to First Byte + Data Transfer time. |
View the metrics
associated with the Memory and CPU of your device. This section of the widget
also displays the top 5 processes on your device that are consuming the most
memory and CPU power.
You can select any or all of the following metrics
by selecting their check boxes.
| Metric | Description |
|---|---|
| Memory | Memory used by the device at a particular time in the Time Range. Hover over the trend line to see the average amount of memory the device used during the Time Range. |
| CPU | CPU power used by the device at a particular time in the Time Range. Hover over the trend line to see the average amount of CPU the device used during the Time Range. |
| Battery | Hover over the trend line to see the amount of battery power the device is using at any point during the Time Range. |
| Disk Usage | How much of the hard disk space has been used. Hover over the trend line to see the amount of disk space in use on the device during the Time Range. |
| Disk Queue Length | The number of outstanding requests that are waiting to be sent to the disk, a high number implies poor performance. |
The Top 5 Processes Consuming Most Memory and
Top 5 Processes Consuming Most CPU widgets display
the 5 processes that consume the most memory and CPU on a user's device. These
widgets are not dependent on the Self-Serve feature being enabled or disabled.
The numbers displayed here are an aggregate of all samples taken during the
selected Time Range. Refer to the AI-Powered ADEM Administrator's guide
for the frequency of data samples collected. They list each process by name and
how much memory or CPU the process was consuming at the selected time. You can
collapse these widgets by clicking on the arrow next to the widget
title.
Path Visualization
(Application Test Required)
Shows you the hop-by-hop network details of the traffic flow from the user to an
application. Even if your VPN is disabled, it will provide visibility on all the
internet hops from the user to an application. If your application (private
application) is not reachable from an untrusted network when the VPN is
disabled, it will fail the availability test and the application experience for
that session will be impacted.
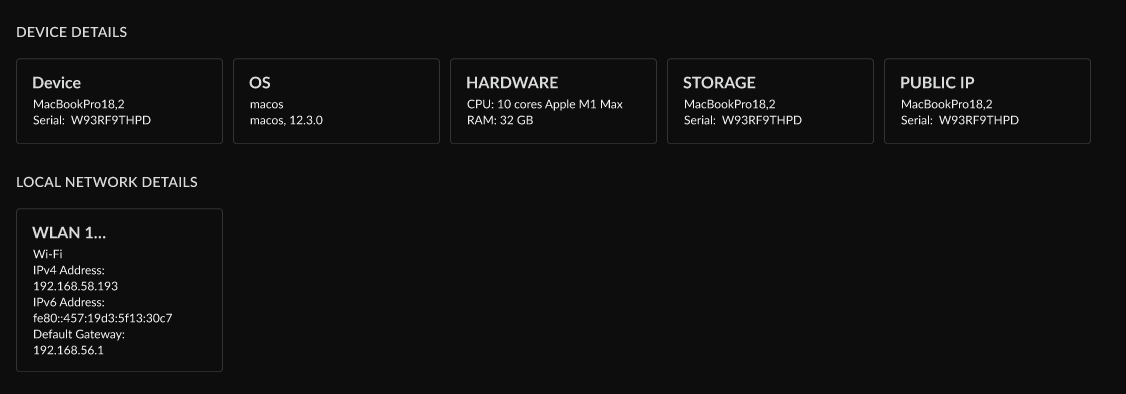
Device Details
Shows information about the selected user device. Local network details
change according to the point selected on the Experience
Trend chart.
Shows the pages on the selected domain with
potential performance degradation. Selecting a page will show RUM metrics for
the page.
Shows the application experience of the user as
they browse different pages of the selected domain over the previous 5 minutes
of the point selected on the Experience Trend graph. You
can use this information to determine which pages were the most problematic for
the user.