Strata Cloud Manager
Activity Insights: Applications
Table of Contents
Activity Insights: Applications
View the applications in your Prisma Access and NGFW setups, users using the
application, risk scores, user experience for each application, and their potential security
impact.
| Where Can I Use This? | What Do I Need? |
|---|---|
| You must have at least one of these licenses to use the Activity
Insights:
|
Monitor the applications in your Prisma Access and NGFW setups, users using the
application, risk scores, user experience for each application, and understand the
security impact posed by the risky applications. Application Usage findings can help
you to refine your security policy to control unsanctioned and risky applications.
Click to view the following information:
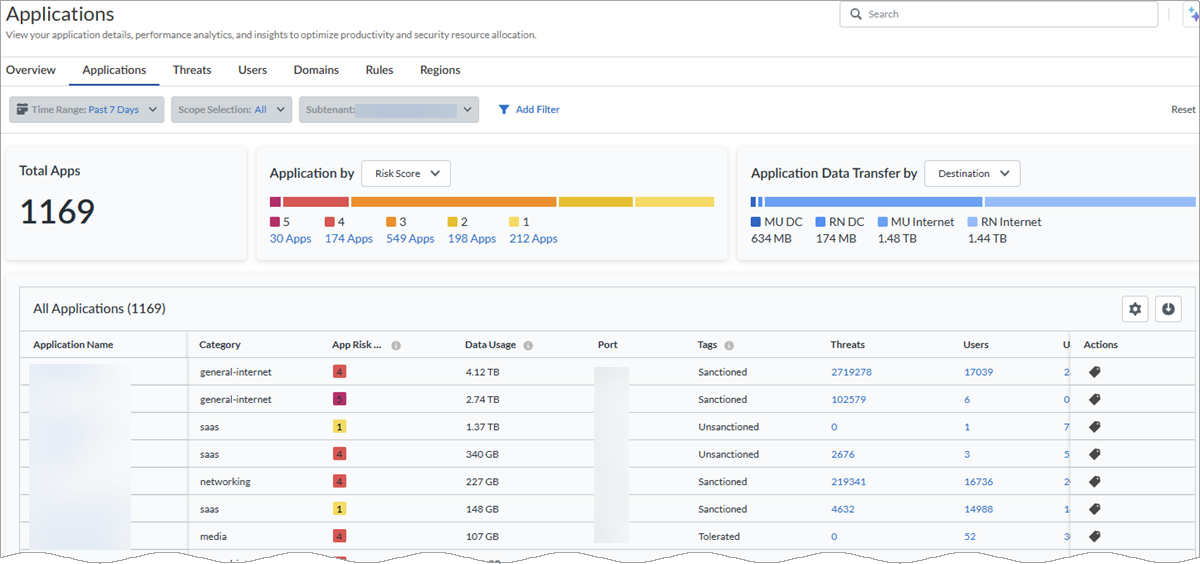
- Applications by Risk Score—The total number of applications running in your organization and the number of applications that are doing Good, Fair, and Poor. The applications are categorized as Good, Fair, and Poor based on their application experience scores.
- Applications by Tag—View whether applications are approved within your organization. From the Applications by drop-down, select Tag to see apps by Sanctioned, Tolerated, or Unsanctioned.
- Application Data Transfer by—Total data download and uploaded across NGFW and Prisma Access firewalls during the time range selected. You can filter to view data transfer originating from the application category and flowing through the destination from the device (data center or firewall).
- All Applications—Use this widget to see which Prisma Access applications are monitored with synthetic tests running on them and applications running on your NGFW environments. The table also displays their experience scores, which give you the health of each application.
- If you have a Prisma Access Browser subscription, you'll see a column for PA Browser Events. Select the number of events, and it will redirect you to the Prisma Access Browser management pages.
- You can also change the tag applied to Gen AI apps based on the application risk score to reflect whether the application is approved within your organization. In the Actions column, select the tag icon and choose the Sanctioned, Tolerated, or Unsanctioned tag and click Apply.
-
Column Description Application NameThe name of the application being monitored.CategoryApplication type.App Risk ScoreThe app risk score, with 1 being the lowest risk and 5 being the highest risk.Data UsageTotal traffic in the infrastructure detected to the specific application.Avg. (Average) Throughput(App Acceleration) View average throughput your traffic has been accelerated.Accelerated(App Acceleration) Some or all of your application traffic has been accelerated.PortPort used by the application.TagSanctioned, Tolerated, or Unsanctioned.ThreatsTotal number of threats experienced by the application.UsersTotal number of users accessing this application during the time range specified.URLsTotal number of URLs accessing this application during the time range specified.SubcategoryApplication subcategory.Rule NameThe security policy rule name.PA Browser EventsNumber of Prisma Access Browser events accessing this application.User ExperienceApplication experience scores collected by Autonomous DEM. It's aggregated across all users monitored for this application.Site Experience Score(ADEM) Application experience score for this specific branch site.Application Test Name(ADEM) The name of the test set up by the user for this application.Application Test Target Name(ADEM) IP address of the FQDN to which the synthetic tests are targeted from various endpoints. - (Prisma Access applications only) You can download the data in the table in csv format. Click the Manage Tests button to view all the synthetic tests that are set up for all your Prisma Access applications in the Application Tests table. If you want to create a test to monitor an application, click Monitor App to view Health under the User Experience column.
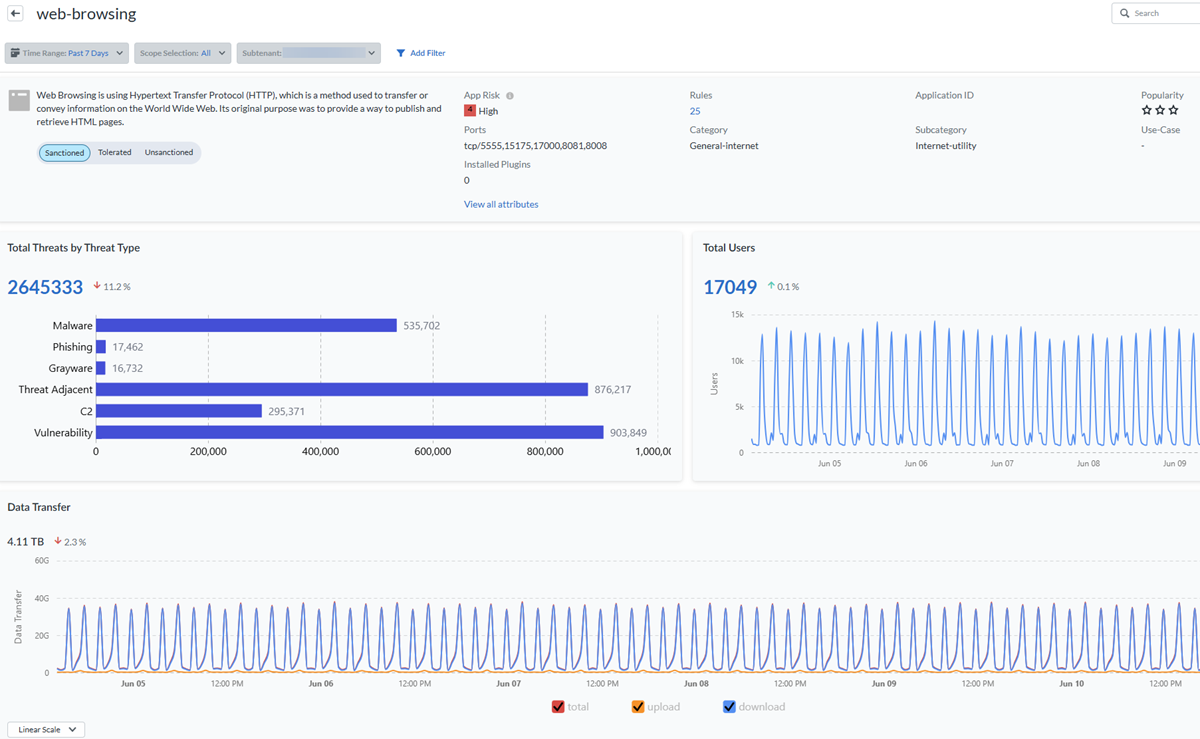
- Application Details—Select any application in the All Applications table to view general details of the application along with details concerning application activity and application experience.
![]()
- About the app—View whether the application you selected is tagged as Sanctioned, Tolerated, or Unsanctioned.
- App Risk—See information about this App Risk, including its risk score, ports used, and any plugins used. Select View All Attributes for further information.
- Rules—The number of security policy rules matched against this application's traffic.
- Application ID—The application type and subcategory.
- Total Threats by Threat Type—View a graph of the number of threats by threat type that this application faces.
- Total Users—View how many users have accessed this application during the time range selected.
- Data Transfer—See how many times this application has been uploaded and downloaded during the time range selected.
- Sensitive Data—Sensitive data detected by this application.
- The Activity tab shows the total number of threats seen in the application, total users accessing the application, data transferred through the application, PA Browser Data Events, and PA Browser Access Events.
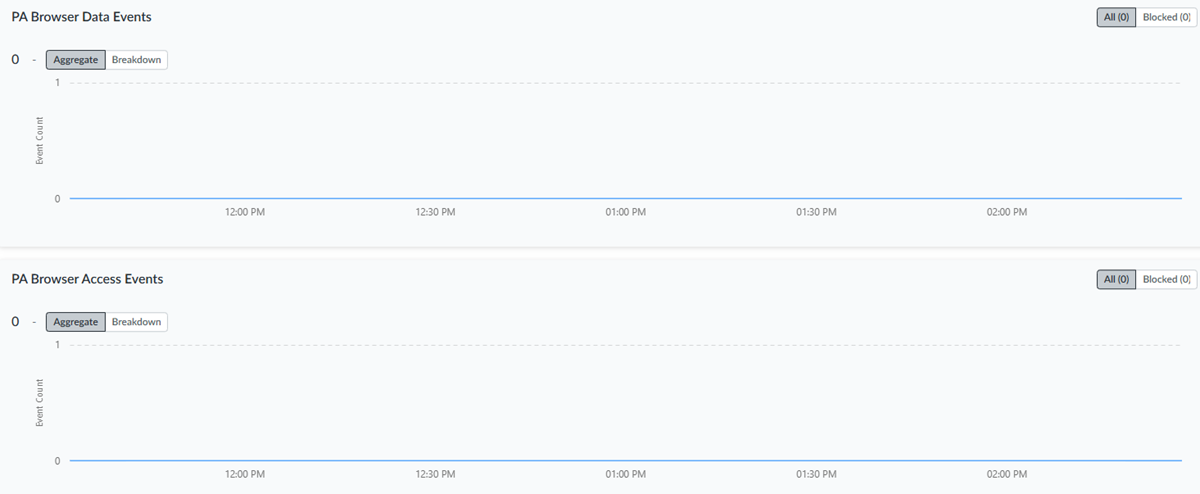
- The following image shows Application Details about PA Browser Data Events and PA Browser Access Events. The default view shows an Aggregate of all events and blocked events, or you can choose to view a Breakdown by Event Type and Count.
![]()
- The Experience tab shows the application experience score, score trend during the selected time range, and network performance metrics.
If an app is a container app, then the displayed statistics
are a roll-up of all the applications in the container. For example, gmail is a
container app (there is no App-ID for gmail). It groups applications such as
gmail-posting, gmail-downloading, gmail-uploading, and so forth. The risk score set
for this container app is the highest risk score found for the contained
applications. All other metrics are calculated by summing the values found for the
contained applications.
Reports—You cannot generate a report that covers
the data in this view. However, you can use the Application
Usage report to view application usage data in your network. To
schedule a report, from the menu, click the
![]() icon against the App Usage
Report template.
icon against the App Usage
Report template.