Prisma Access
View and Monitor Prisma Access in Strata Cloud Manager
Table of Contents
View and Monitor Prisma Access in Strata Cloud Manager
View your network activities and monitor the health and connectivity status of your
remote networks, applications, and mobile users in Prisma Access.
| Where Can I Use This? | What Do I Need? |
|---|---|
|
Each of these licenses include access to Strata Cloud Manager:
Other licenses and prerequisites needed to access certain Activity
Insights views are:
The features and capabilities available to you in Strata Cloud
Manager depend on which license(s) you are
using.
|
Palo Alto Networks Strata Cloud Manager Command Center is an
AI-powered Network Security platform. With Strata Cloud Manager and Strata Cloud Manager Command Center, you can
easily manage your Palo Alto Networks Network Security infrastructure from a single,
streamlined user interface.
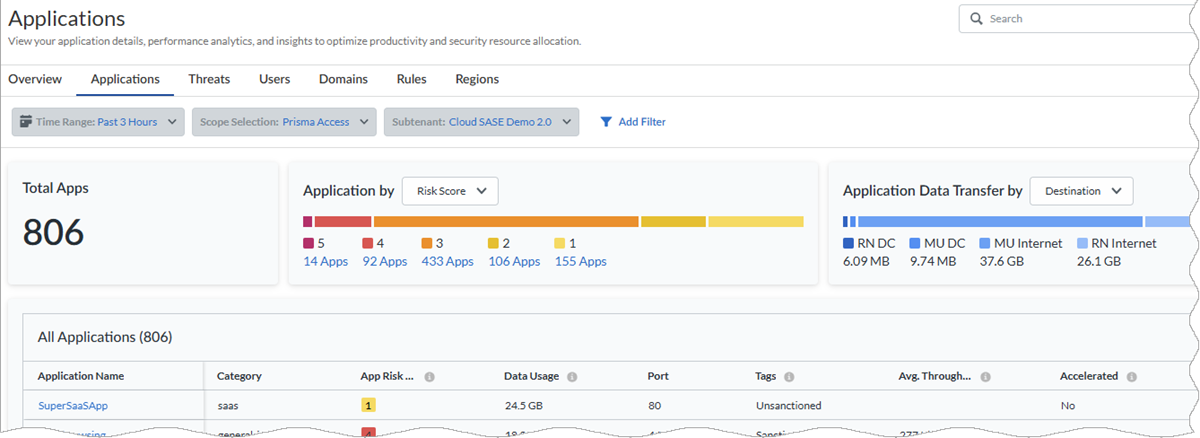
- Activity Insights: Applications—Monitor
the applications in your Prisma Access and NGFW setups, users using the application,
risk scores, user experience for each application, and understand the security
impact posed by the risky applications. Application Usage findings can help you to
refine your security policy to control unsanctioned and risky applications.
- Applications by Risk Score—The total number of applications running in your organization and the number of applications that are doing Good, Fair, and Poor. The applications are categorized as Good, Fair, and Poor based on their application experience scores.
- Application Data Transfer—Total data download and uploaded across NGFW and Prisma Access firewalls during the time range selected. You can filter to view data transfer originating from the application category and flowing through the destination from the device (data center or firewall).
- All Applications—Use this widget to see which Prisma Access applications are monitored with synthetic tests running on them and applications running on your NGFW environments. The table also displays their experience scores, which give you the health of each application.
- Application Details—View general details of the application along with details concerning application activity and application experience.
![]()
- Activity Insights: App Acceleration—App Acceleration addresses the causes of poor application performance and acts in real time to mitigate them, improving the user experience for Prisma Access GlobalProtect and Remote Network users.
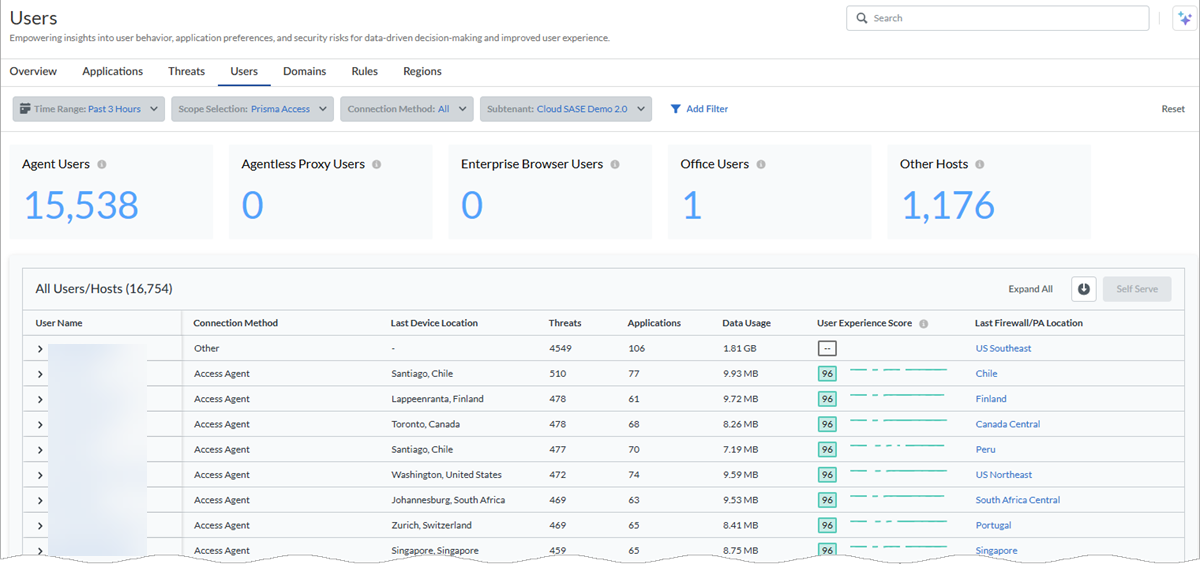
- Activity Insights: Users—Monitor user
activity in your Prisma Access and NGFW environment. Monitoring the user activity
helps to detect and stop potential threats, protect misuse of sensitive information,
and adjust your Security policy rule to close security gaps. You can easily
determine a user's or host's connection status to NGFW or Prisma Access, whether at
a branch site, service connection, or remote location. You can view information
about:
- The total number of unique users currently connected to Palo Alto Networks security solutions and users connected to NGFW and Prisma Access.
- The number of users who are connected during a certain time range, broken down by users connected through NGFW and Prisma Access.
- Agent-based users connected through NGFW and Prisma Access.
- Agent-based or browser-based Explicit Proxy users connected to NGFW and Prisma Access.
- Users connected through Prisma Access Browsers.
- A list of unmanaged device users accessing Prisma Access.
- A list of users connecting from branch locations to Prisma Access.
- A list of users connecting their data centers using specific service connections.
![]()
- Activity Insights: IPv6 for Mobile Users—If you use IPv6 networking in your GlobalProtect deployment, you can configure Prisma Access to use IPv6 addresses in your mobile user networking. You also need to enable IPv6 networking globally in your Prisma Access infrastructure before you can use IPv6 addressing.
- Activity Insights: Branch Sites—View the health and connectivity of your Remote Networks and the usage of all your Remote Networks deployed in different Prisma Access locations. See the real-time connectivity status and bandwidth consumption details, along with other deployment details. Mobile Users, branch offices, and retail locations connect to Remote Networks. You can also view the health of the tunnels configured in your Remote Networks and Mobile Users.In addition to the widgets that display with the Prisma Access license, this dashboard displays the Site Experience Score and Prisma SD-WAN branch site details page only if you have the ADEM Observability or the AI-Powered ADEM license.
- Insights: Data Centers—See aggregated service connections data as well as information about individual service connections. Beyond providing access to corporate resources, service connections allow your mobile users to reach branch locations. You can view your service connections in Strata Cloud Manager to see service connection status, bandwidth consumption trends, tunnel data and trends, and information about overall service connection health.
- Configuration: ZTNA Connectors—The Zero Trust Network Access (ZTNA) Connector simplifies private application access for all your applications. The ZTNA Connector VM in your environment automatically forms tunnels between your private applications and Prisma Access. View a summary of all configured ZTNA connectors, including the Application Targets associated with the connector, its average and median bandwidth, and the Status (Up, Partially Up, or Down).
- —Get visibility into your private apps that were added through ZTNA Connector access objects by viewing data such as the number of apps added by FQDNs, IP subnets, and wildcards, each access object's connectivity status, and the Connector Groups and Connectors associated with each access object. By viewing this information, you can get an overall picture of the health and connectivity of your deployment.
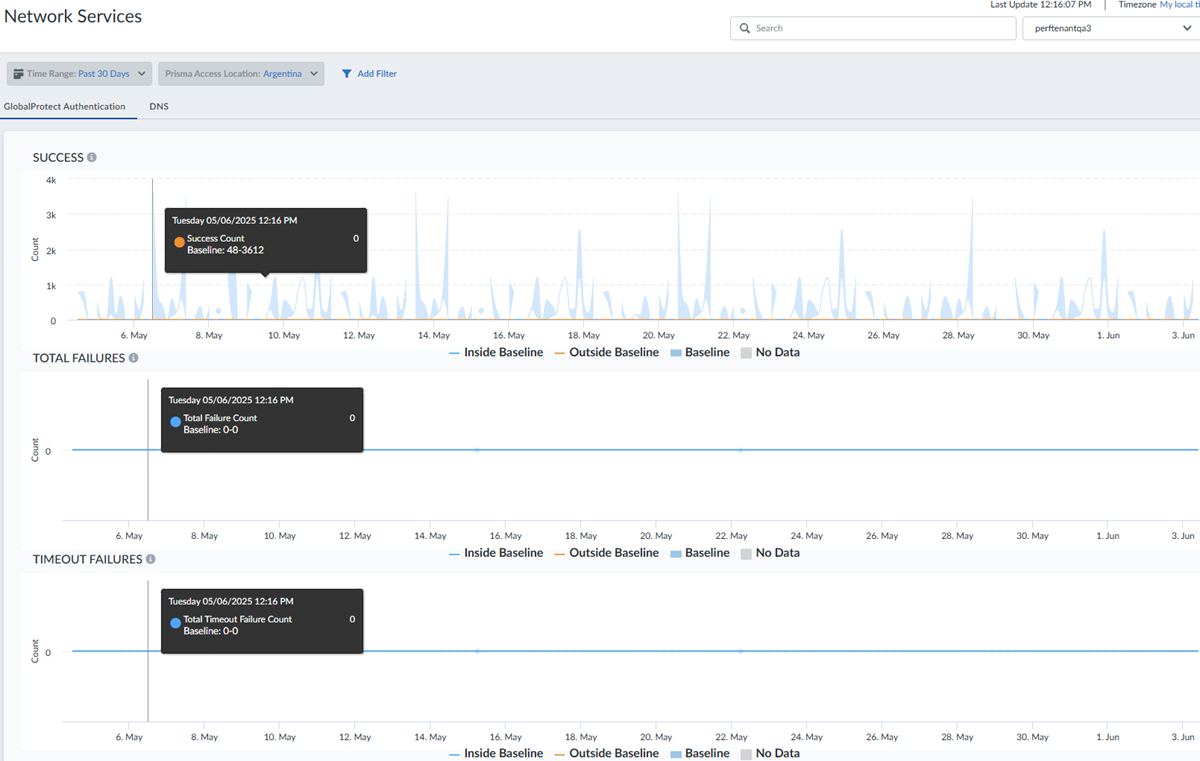
- —View the performance of common network services that affect your user
experience for accessing applications in Insights. Network services include
reporting the number of GlobalProtect Authentication successes and failures as a
measure of mobile users being able to connect to Prisma Access. You can view:
- specifics about authentication success counts for GlobalProtect for different locations.
- authentication failure counts for GlobalProtect for different locations.
- authentication timeout failures for GlobalProtect for different locations.
![]()
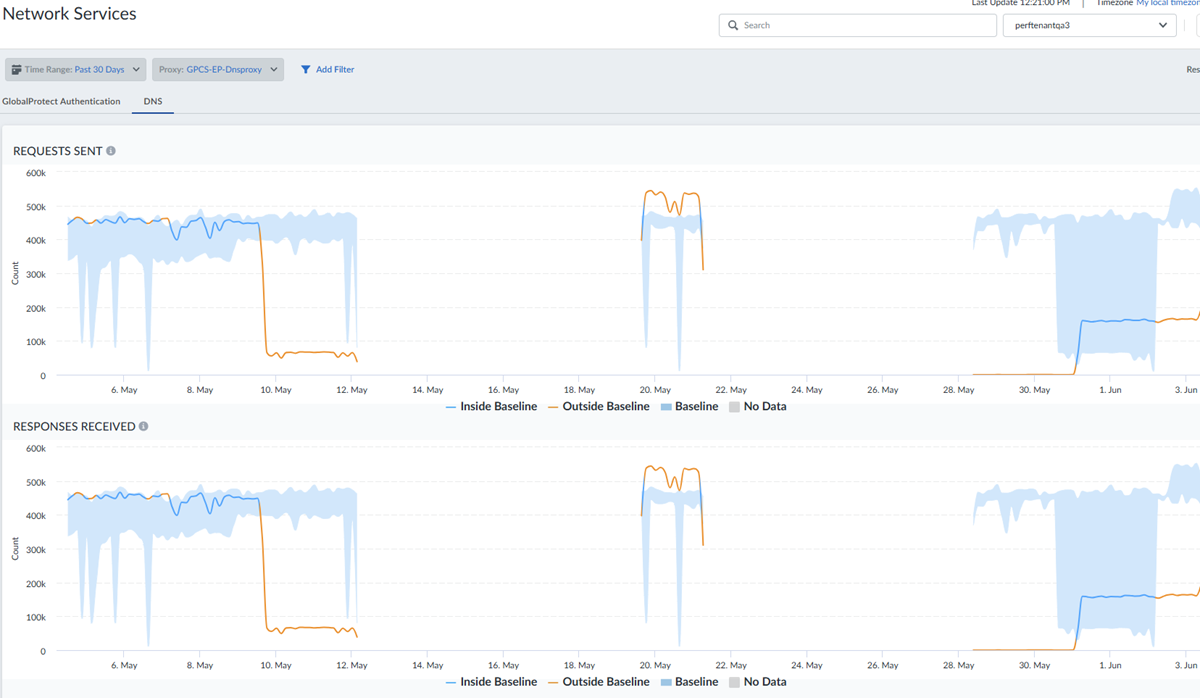
- Insights: Network Services
DNS—View the performance of common network services that affect your
user experience for accessing applications, including displays of DNS proxy requests
and responses forwarded to servers during a time range you specify.
![]()
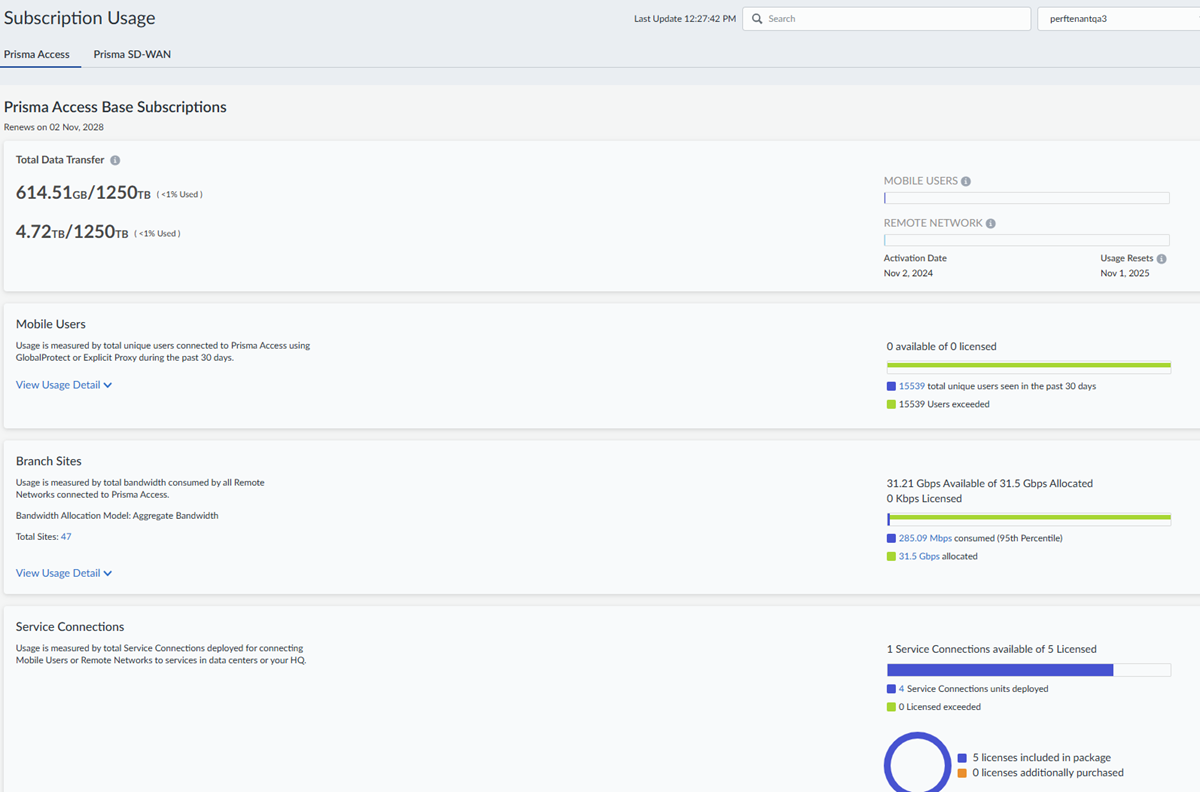
- System Settings: Subscription
Usage—View details about your Prisma Access Base
Subscriptions usage, including the total number of unique users connected,
bandwidth consumed by remote network users, the total number of service connections
deployed, and details about any add-on subscriptions.
![]()
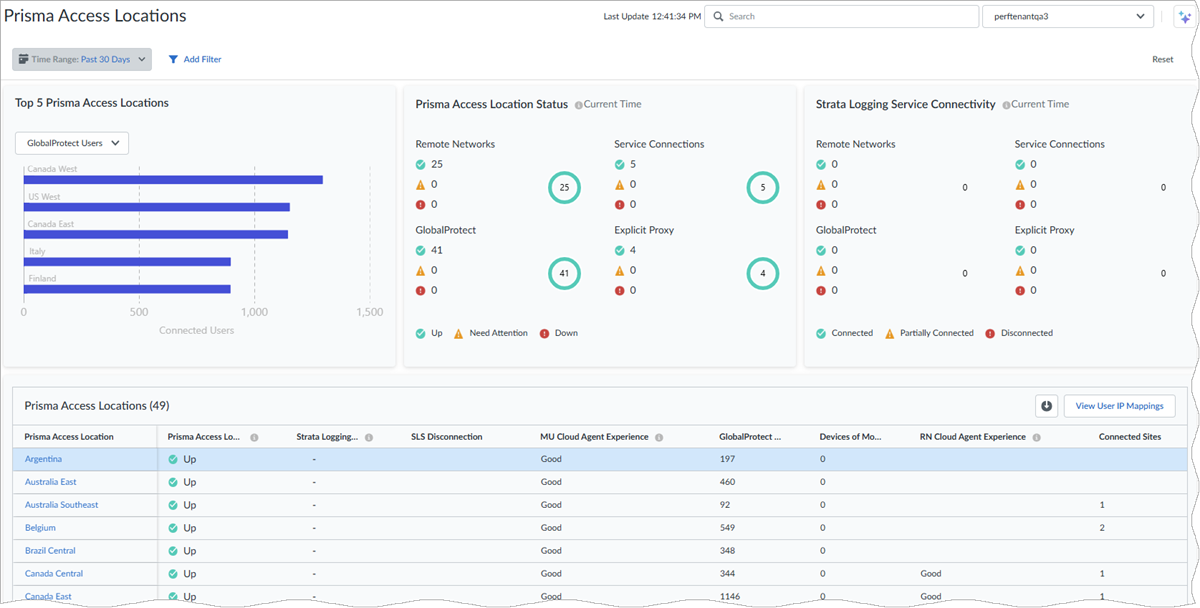
- Insights: Prisma Access
Locations—View the health of all your Prisma Access locations for
your remote networks and mobile users.
![]()