Manage Tunnel Health
Table of Contents
Manage Tunnel Health
View the health of the tunnels configured in your Remote Networks and Mobile Users.
The Tunnels dashboard
enables you to view the health of the tunnels configured in your
Remote Networks and Mobile Users.
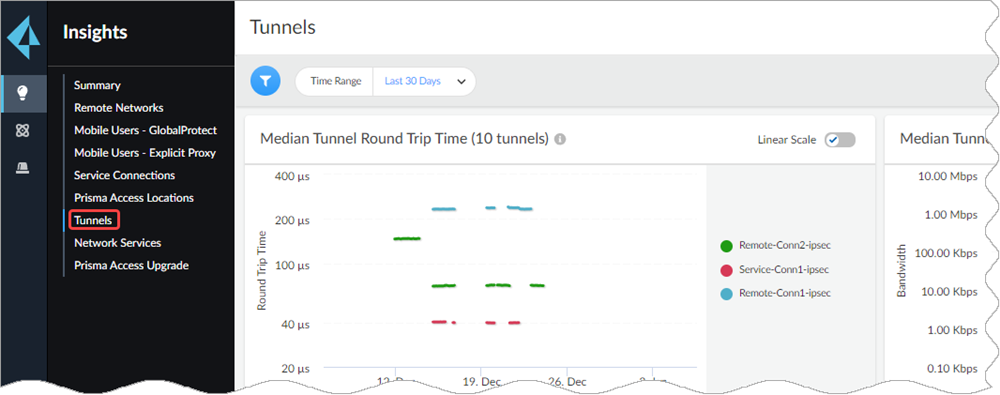
View Tunnel Status Details
The Tunnels page shows widgets
that provide details on your remote networks and mobile users’ tunnel
health.
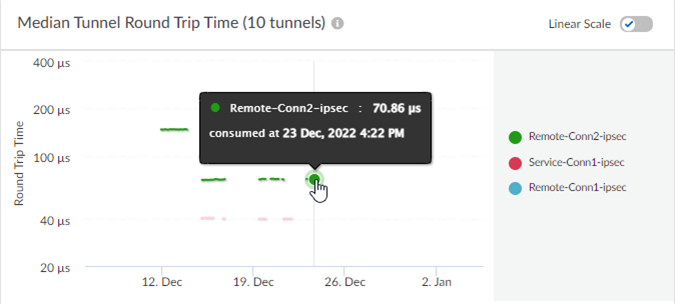
See Median Tunnel Round Trip Time (Number of Tunnels)
You can select a number of tunnels and view their median
round trip time (RTT). If you don’t specify a set of tunnels, by
default the median RTT is computed for the 10 tunnels with the highest
observed RTT.
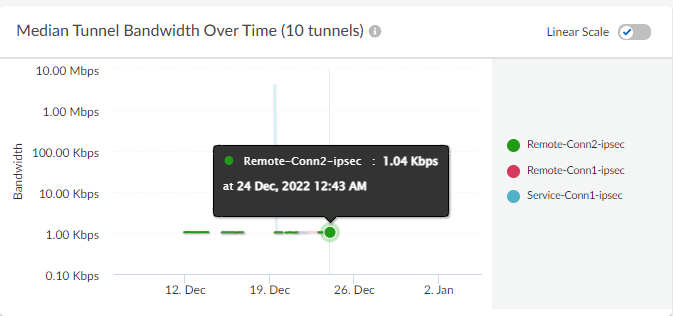
See Median Tunnel Bandwidth Over Time (Number of Tunnels)
You can select a number of tunnels and view their median
tunnel bandwidth values. If you don’t specify a set of tunnels,
by default the median bandwidth value is computed for the 10 tunnels
with the highest observed bandwidth values.
View Tunnel State Distribution
You can view all the tunnels that you have configured
for your Remote Networks and Mobile Users and their status. Hover
your cursor over the circle chart to see how many tunnels are up,
down, inactive, or have an issue with them that needs some resolution.
You see one of the following status for each tunnel:
- Up—All tunnels are up
- Down—All tunnels are down
- Inactive—The tunnel has been idle for a period of time
- Not available—The tunnel has been decommissioned

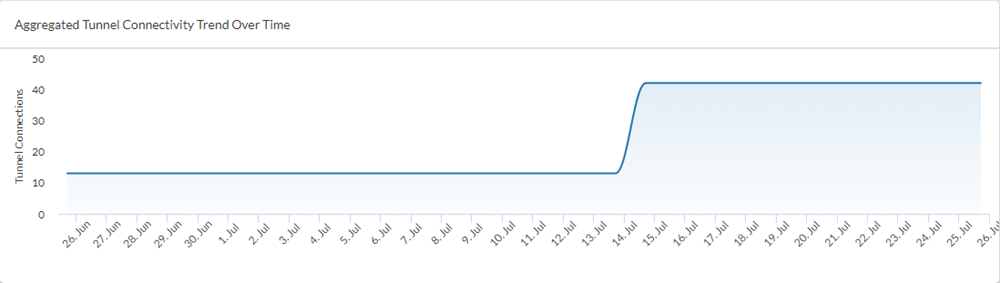
See Aggregated Tunnel Connectivity Trends Over Time
Aggregated Tunnel Connectivity Trend Over Time shows
you the total number of connected tunnels.
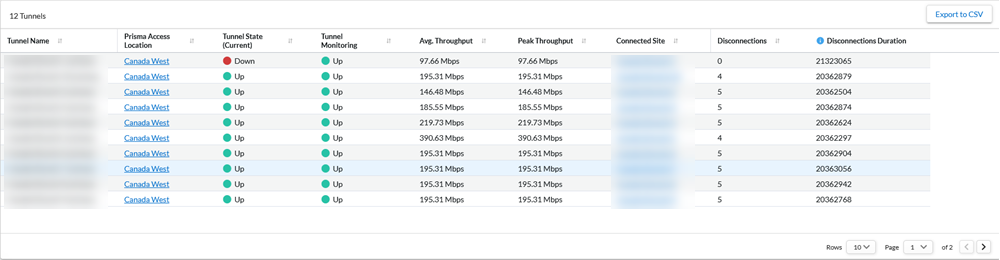
View Tunnels Associated with Prisma Access Locations
The (Number of) Tunnels tabular list shows the details of each site and
their tunnels. The tunnel names are retrieved from the Prisma Access
configuration. Clicking anywhere on the circle in the Tunnel State
Distribution or the trend line in the Aggregate
Tunnel Connectivity Trend Over Time creates a condition in the
filter that sorts the data in the Tunnels table.
The Average Throughput column in the table shows the amount of traffic
flowing through the tunnel. The Disconnections column
show the number of times the sites got disconnected from the Prisma Access
node in the selected Time Range. The
Disconnection Duration column displays data in
seconds, displaying the aggregate time that this tunnel was disconnected in the
time range selected. You can select a Prisma Access
Location to go to the Prisma Access Locations page and see
information about that location.