Monitor SCTP Security
Table of Contents
Monitor SCTP Security
Monitor SCTP traffic by viewing logs, ACC displays generated
from SCTP logs, and predefined and custom reports.
You can enable SCTP association start logs
and end logs for SCTP endpoints configured in a Security policy
rule from an SCTP Protection profile. All other SCTP traffic logs
are event-based logs that are generated based on the options you
enable in the SCTP Protection profile.
To help you monitor
SCTP traffic, the firewall uses the SCTP logs to create a visual
display on the Mobile Network Activity tab in the ACC. The firewall
also gives you predefined reports and the ability to generate custom
reports.
SCTP logs are event-based logs that include information
on a wide range of SCTP attributes, including SCTP event type, chunk
type, payload protocol ID, SCTP cause code, association ID, stream
ID, and chunks, in addition to the general information that the
firewall identifies, such as source and destination address, source
and destination port, and timestamp. The SCTP logs also provide
additional information on some applications running over SCTP, including
Diameter and SS7 protocols. View the SCTP logs to verify that your
SCTP Protection profile settings are securing SCTP traffic as you
intend.
You must allocate a log storage quota for SCTP
when you Configure SCTP Security before
you can view SCTP log events.
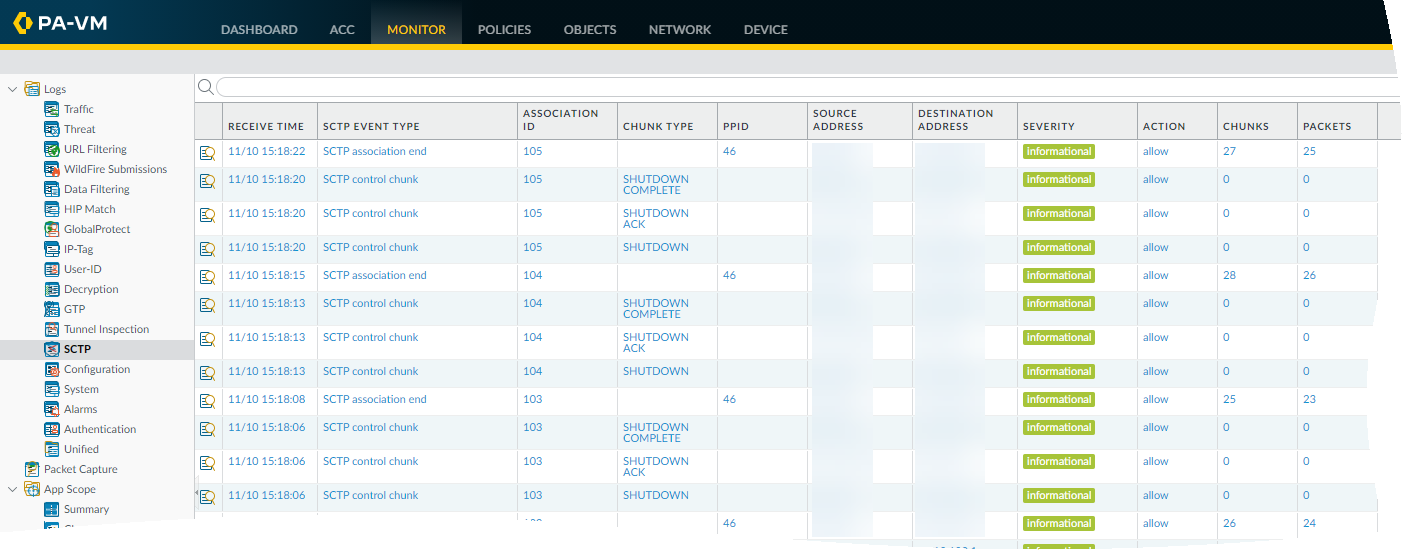
- View SCTP logs to see, for example,
source and destination IP addresses of SCTP traffic, whether control
chunks were allowed, whether data chunks were filtered by their
PPID, and when SCTP associations started and ended.
- Select .
![]()
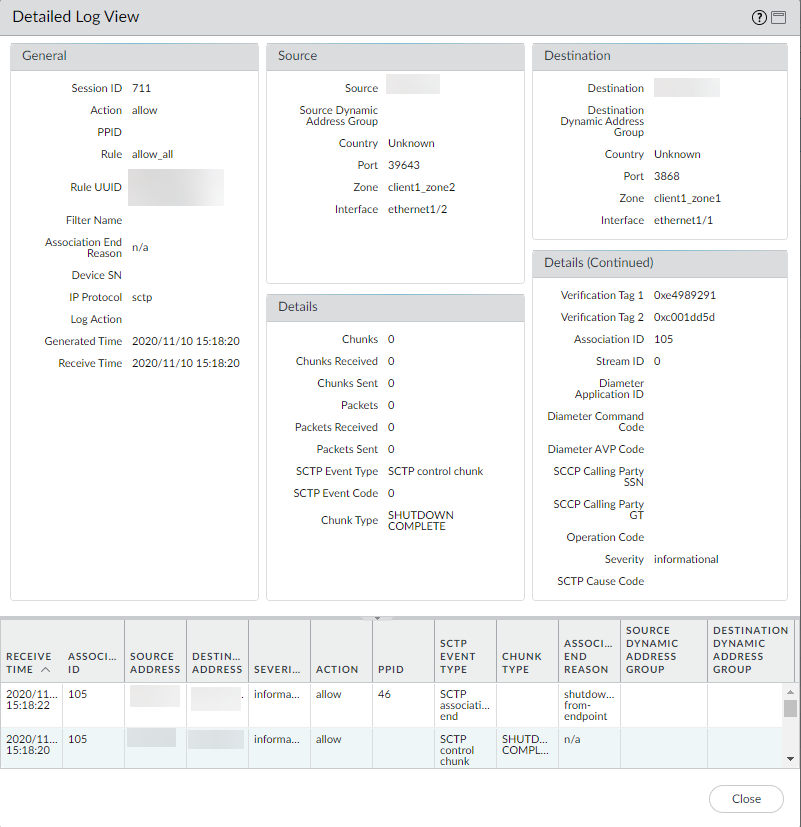
- Select the Detailed Log View ( ) for a specific log to view details about that log, such as the names of the Security policy rule and the SCTP filter that applied to the packets, the Verifications Tags, the Diameter Application ID, the Diameter Command Code, and the SCCP Calling Party SSN.
![]()
![]()
- Select .
- View a detailed traffic log for an SCTP association,
including the name of the Security policy rule that applied to the
packet, the association ID, and the numbers of chunks sent and received.
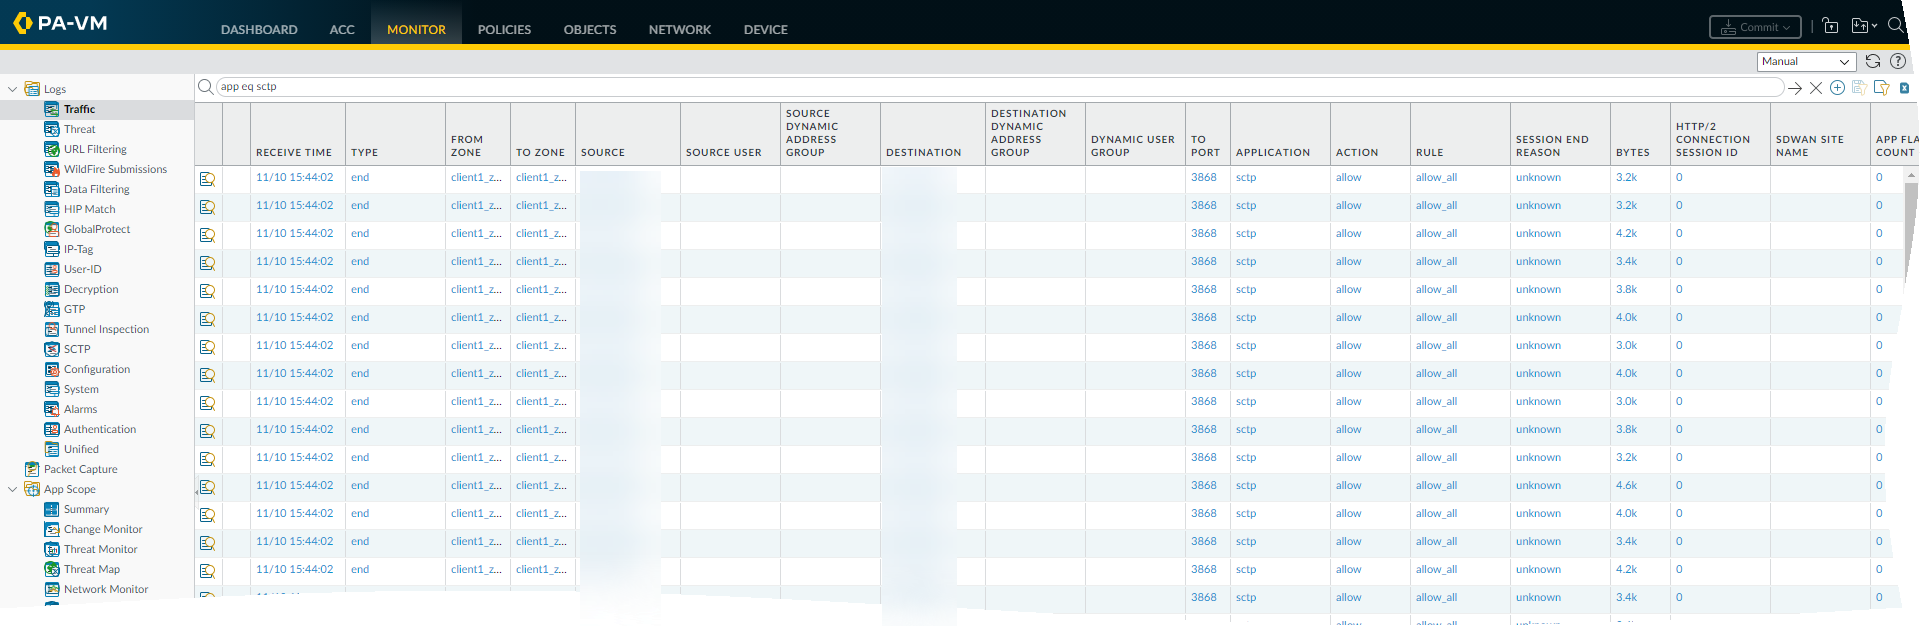
- Select and,
in the filter field, enter app eq sctp and
apply the filter to filter the traffic logs.
![]()
- Select the Detailed Log View ( ) for a specific log where the Application is sctp.
![]()
- Select and,
in the filter field, enter app eq sctp and
apply the filter to filter the traffic logs.
- (Optional) Clear SCTP logs based on your operational
requirements.
- Select .
- In the Manage Logs section, Clear SCTP Logs.
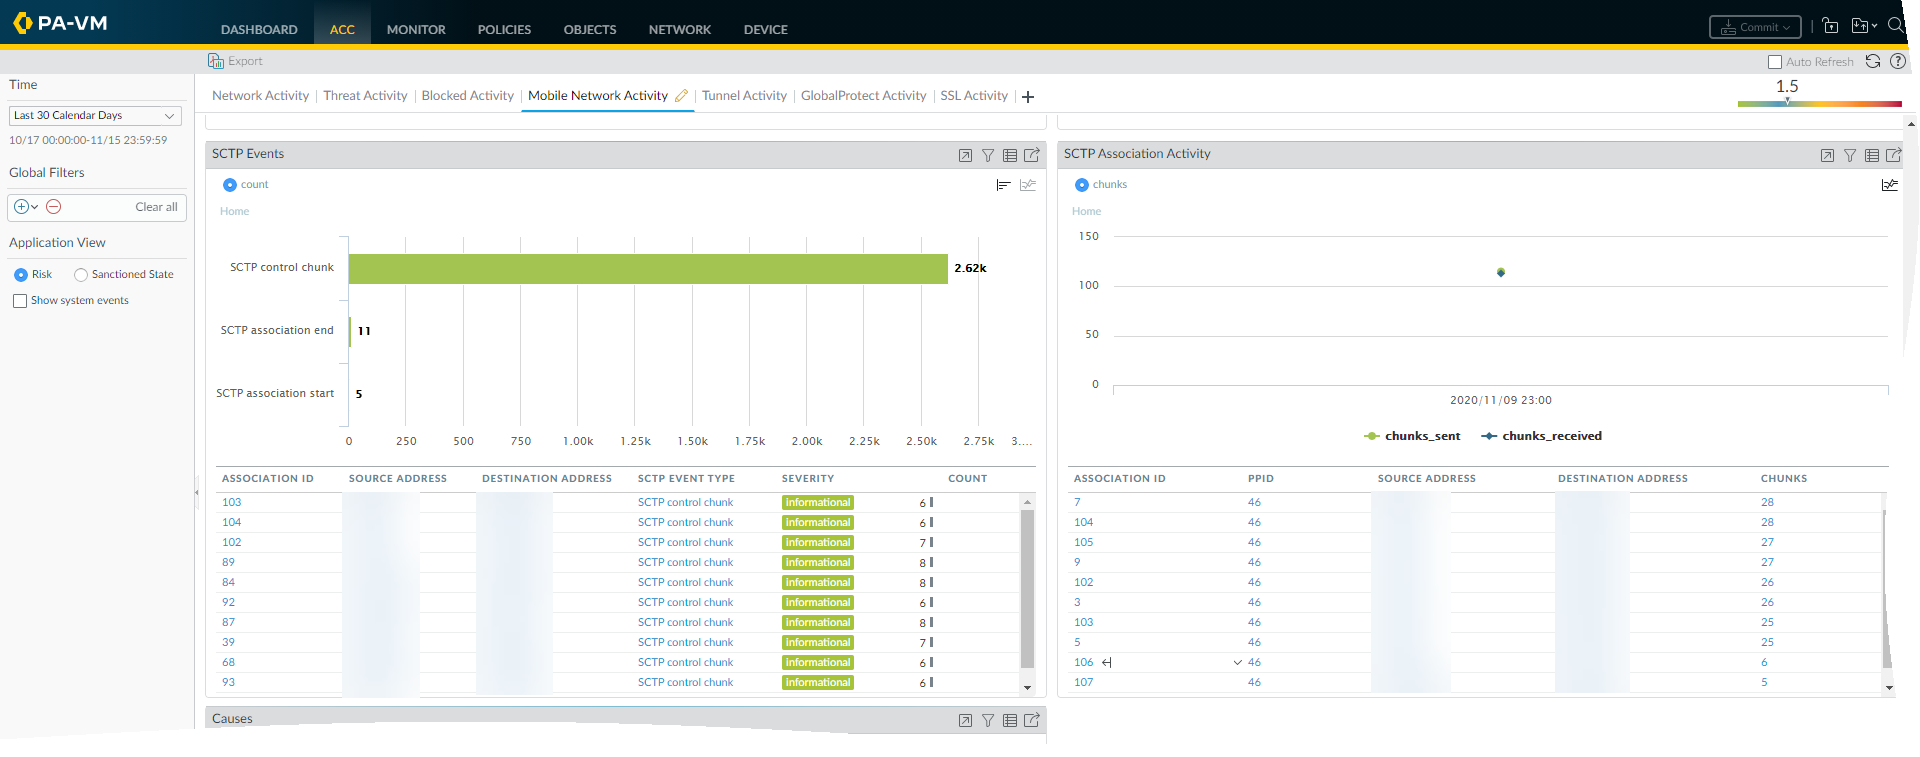
- Use ACC to view SCTP events and association activity.
- Select .
- Select the Virtual System you want to view or select All (default).
- Select a Time period.
- In the SCTP Events window, select an association ID
to see details of that association, such as chunks, source address,
and destination address.
![]()
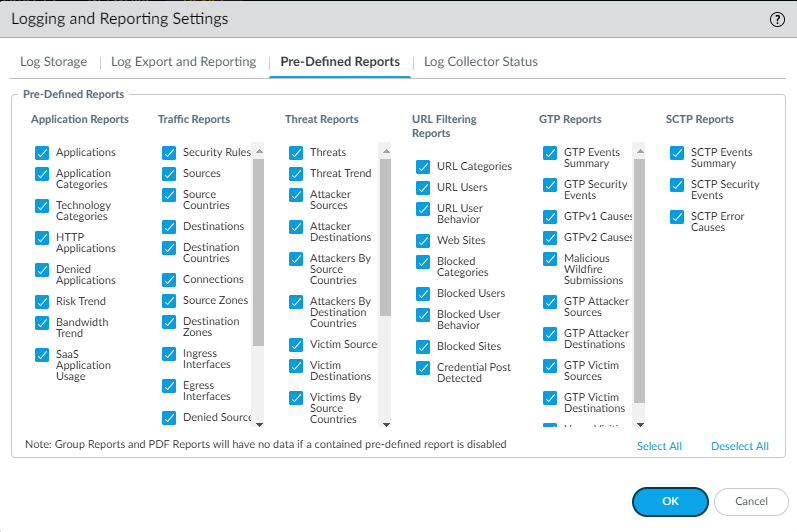
- View predefined reports about SCTP events and errors.
- Select .
- Edit the Logging and Reporting Settings and select Pre-Defined Reports.
- In the SCTP Report section, select any of the following: SCTP Events Summary, SCTP Security Events, or SCTP Error Causes (enabled by default).
- Click OK.
![]()
- Create a custom report on SCTP events.
- Select and Add a custom report.
- Enter a Name for the report.
- For the Database, select SCTP from Summary Databases or Detailed Logs (Slower).
- Generate Custom Reports to create your report and build queries based on SCTP elements, such as Chunk Type, PPID, and SCTP Event Type.