Strata Cloud Manager
Insights: Threat Search
Table of Contents
Insights: Threat Search
You can search on a security artifact to interact with data just for that
artifact.
| Where Can I Use This? | What Do I Need? |
|---|---|
|
Each of these licenses include access to Strata Cloud Manager:
The other licenses and prerequisites needed for visibility
are:
→ The features and capabilities available to you in Strata Cloud Manager depend on which license(s) you are
using.
|
You can search on a security artifact to interact with data just for that artifact.
Search results include:
- The artifact’s history and activity in your network. Using this data, you can assess how prevalent the artifact is in your network and compare to Palo Alto Networks global data.
- Palo Alto Networks threat intelligence on the artifact, based on analysis data of all traffic processed by Palo Alto Networks.
- Passive DNS data that is used to populate the Passive DNS History widget (for URL and domain searches) is generated based on user data from telemetry collected by the firewall.
Click to get started.
To get started, search for one of these types of artifacts: a file hash
(SHA-256), a URL, a domain, or an IP address (IPv4 or IPv6).
IP Address
You can search for an IP address (IPv4 and IPv6) to analyze the threat
information related to IP address activities in your network. The following data
is displayed in the search result:
- Total number of times an IP address was detected and allowed into in your network over the past 30 days.
- Graphical representation of global telemetry counts.
- Associated threat actors, malware Campaigns, vulnerabilities, techniques, in the form of tags associated with the IOC.
|
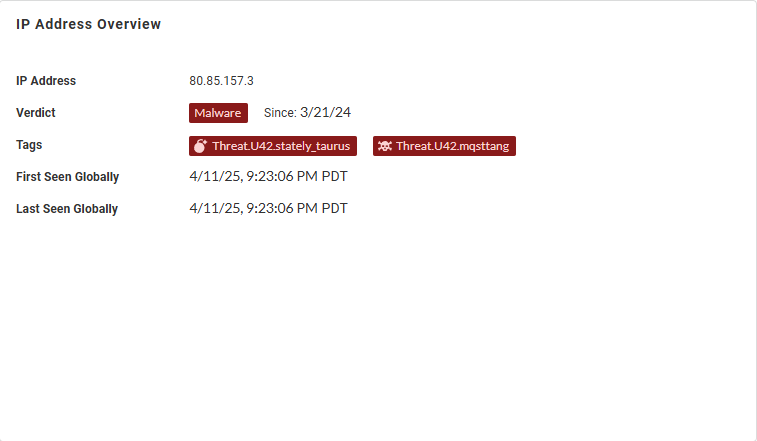
IP Address Overview—View general information about the
IP address, including the verdict, associated tags, and, if
the IP address has been analyzed previously, the timestamp
when it was initially and last observed, globally.
| |
|
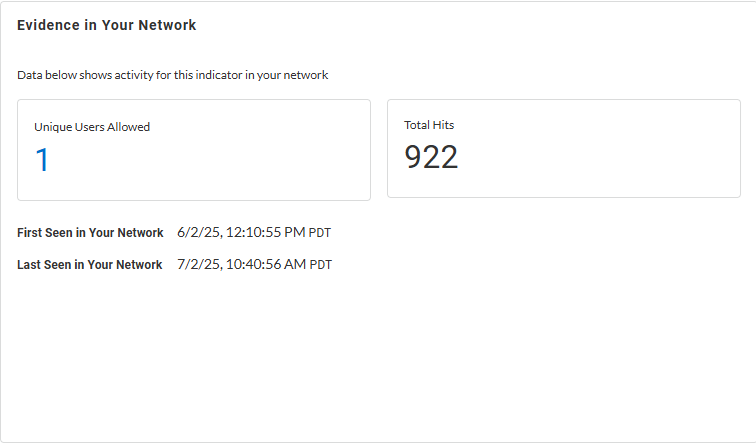
Evidence in Your Network—Learn about
detection reasons with timestamps when it was initially and
last observed in your network, unique allowed users, and
total hits data for the web request.
| |
|
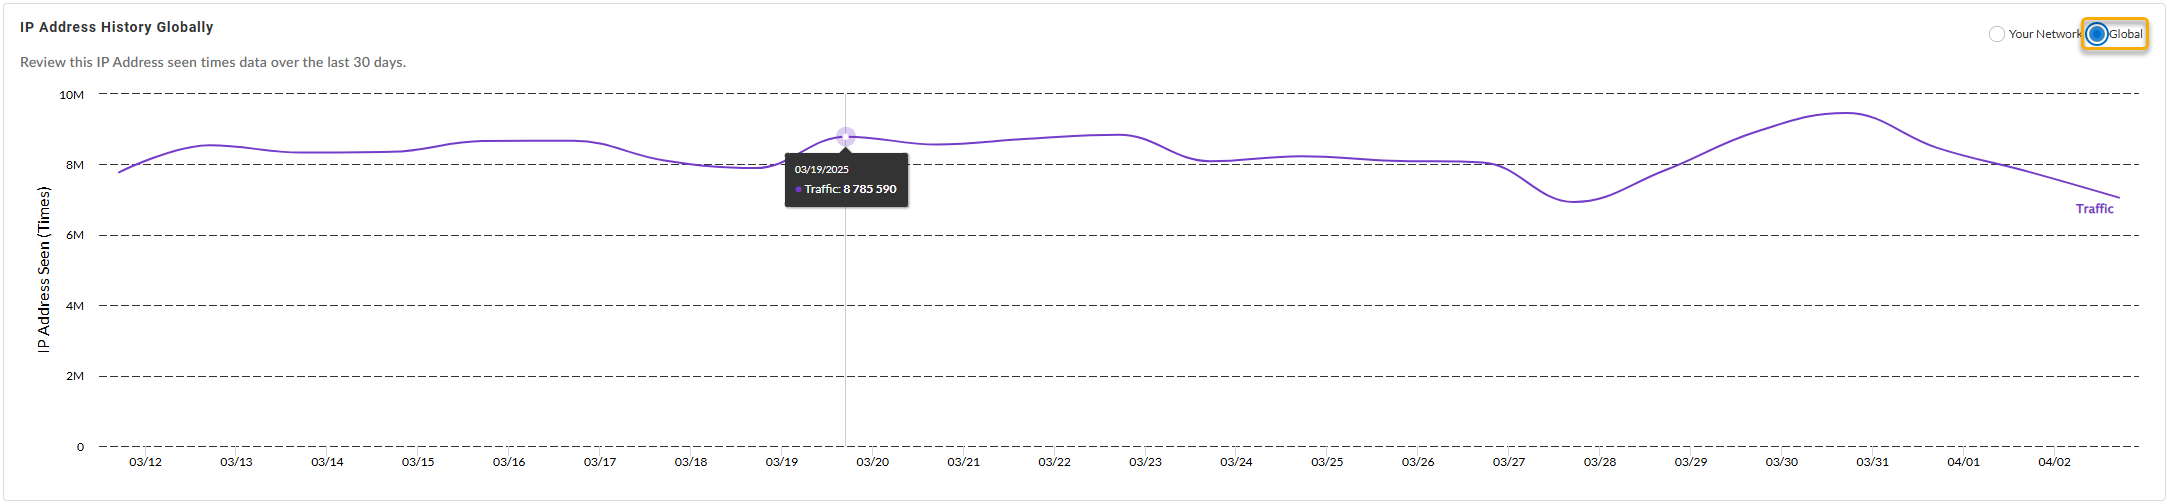
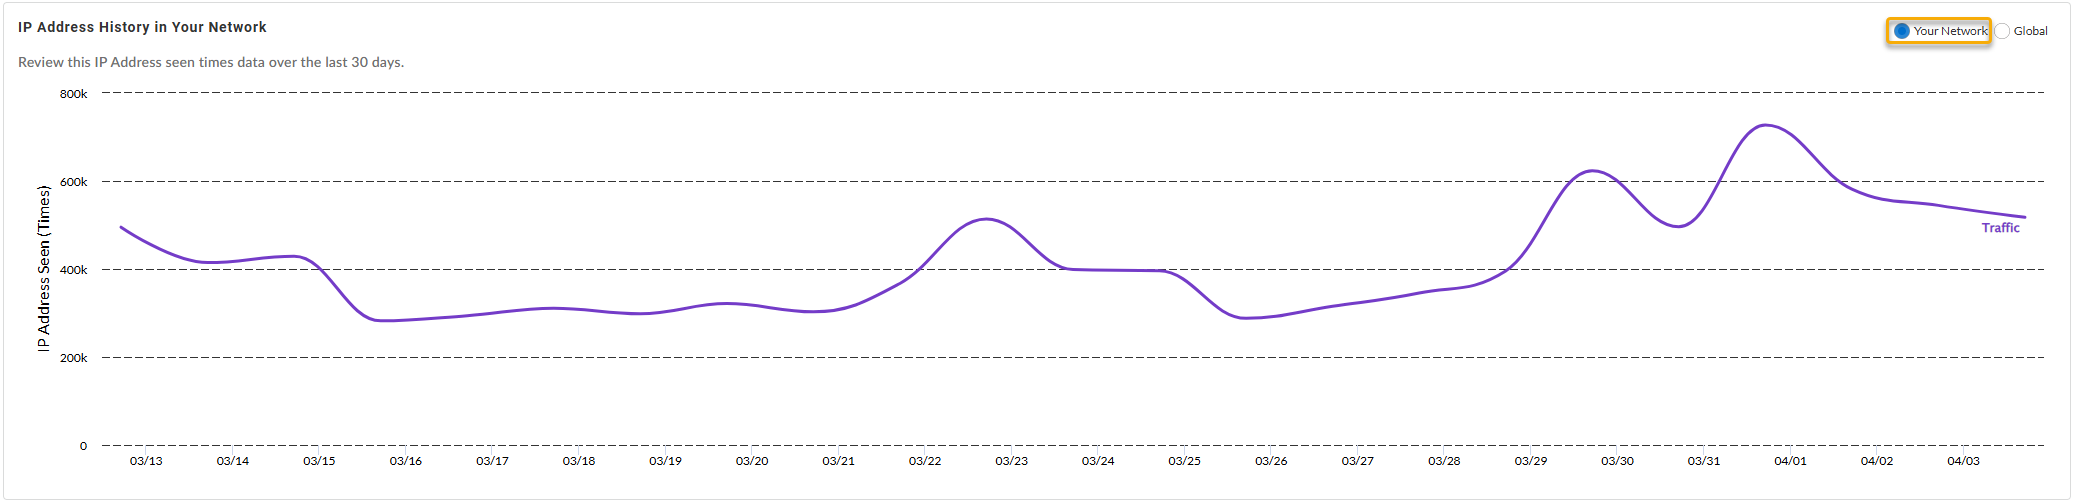
IP Address History {in Your Network | Globally}—Shows
the number of times the IP address was accessed by various
endpoints in your network (or globally, depending on the
widget setting) during the past 30 days.
Globally:
In Your Network:
| |
|
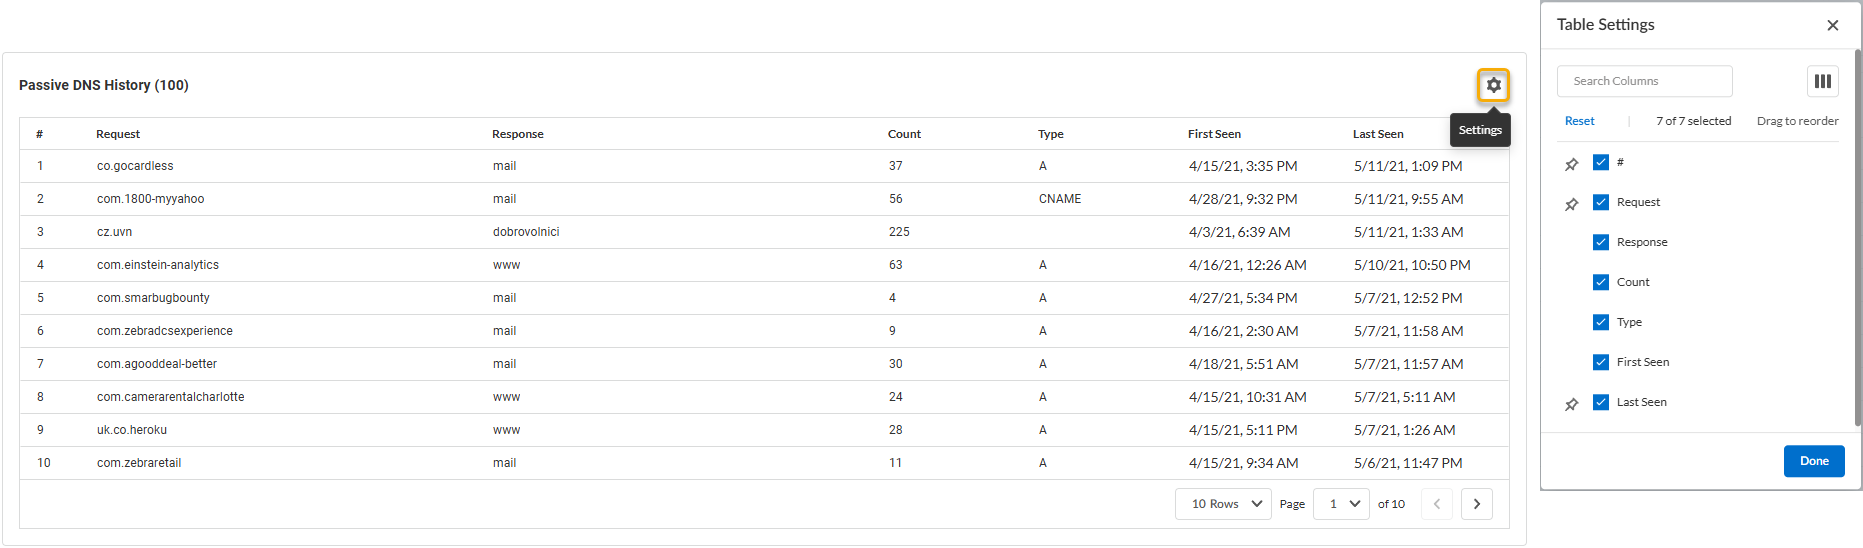
Passive DNS History —Review the passive DNS history of
DNS traffic records associated with the IP address. That can
allow you to examine how domains have been resolved in the
past, track changes in DNS configurations, and identify
potentially malicious activities.
You can configure the fields displayed in the passive DNS
history table based on the following fields:
| |
|
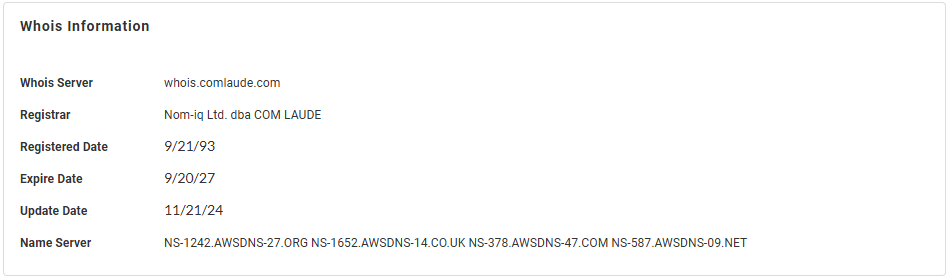
Whois Information —Displays general domain information
based on the resource's publicly available registration
details.
|
Domain
View a summary of the activities associated with the domain in your network. The
search results include:
- Classification of the domain in your network based on analysis data from URL Filtering and DNS Security.
- Total number of activities associated with the domain over a specified duration, both in your network and globally.
- Enforcement applied to each activity in a graphical format.
- DNS activity collected from across all WildFire submissions that contain instances of this domain.
The IOC Search does not currently support visualization of local network
activity seen by the Advanced DNS Security Resolver.
|
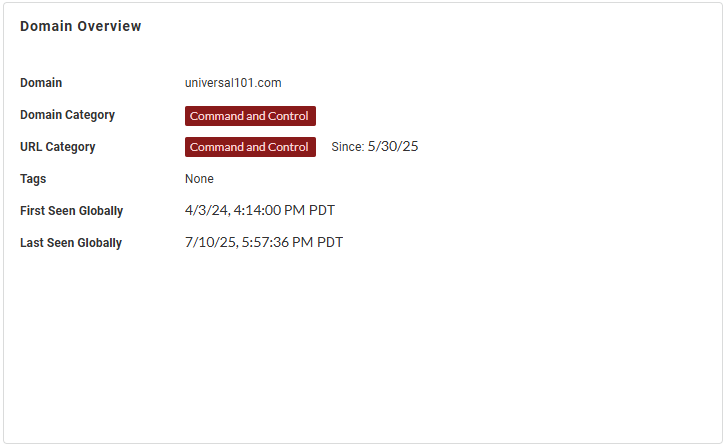
Domain Overview—View general information about the
domain, including the domain and URL categories as
determined by the Advanced DNS Security and Advanced URL
Filtering services, respectively, the category tags, and, if
the IP address has been analyzed previously, the timestamp
when it was initially and last observed, globally.
| |
|
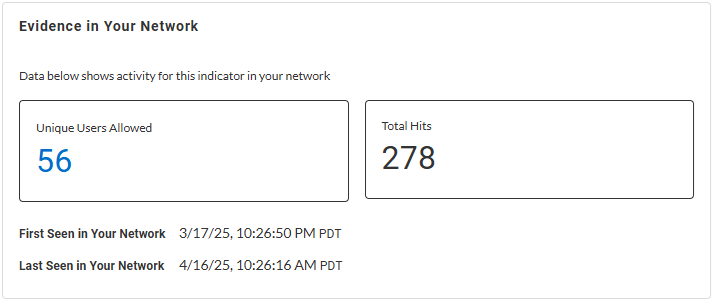
Evidence in Your Network—Learn about
detection reasons with timestamps when it was initially and
last observed in your network, unique allowed users, and
total hits data for the web request.
| |
|
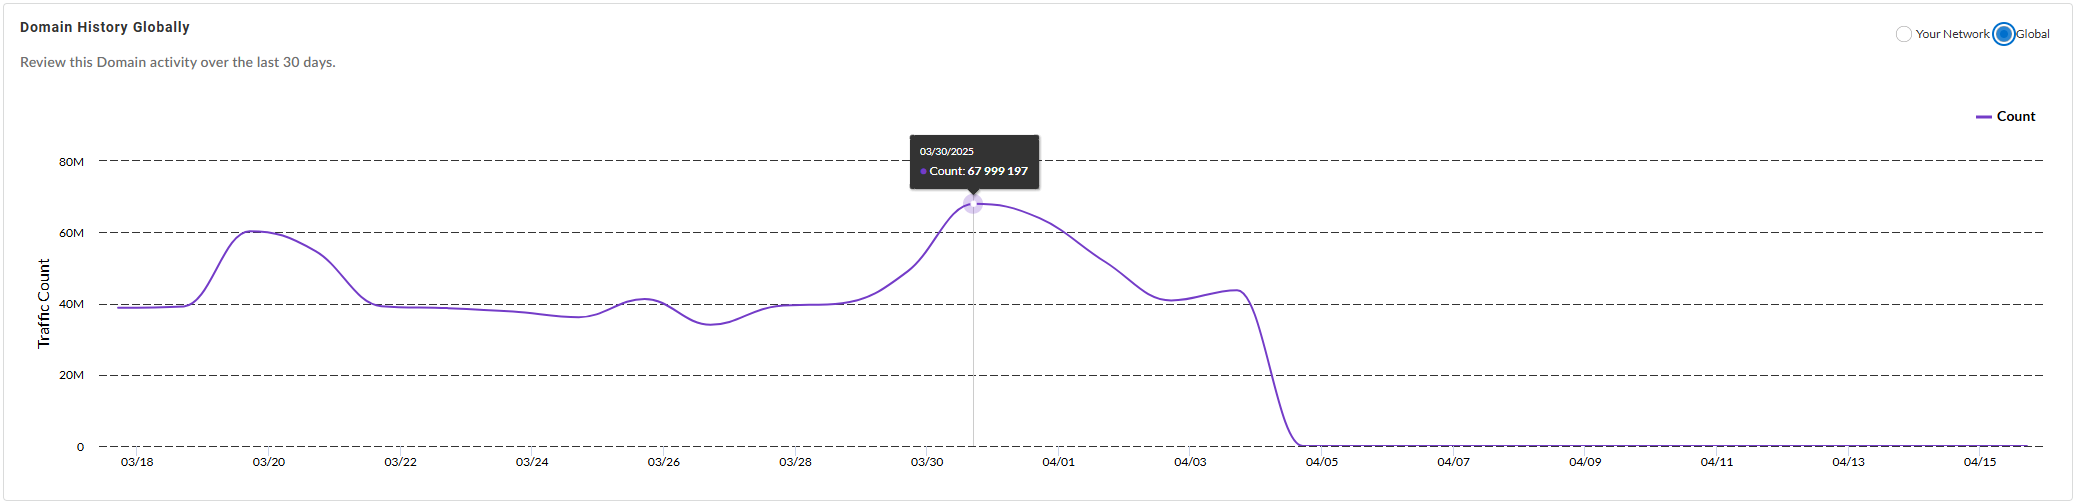
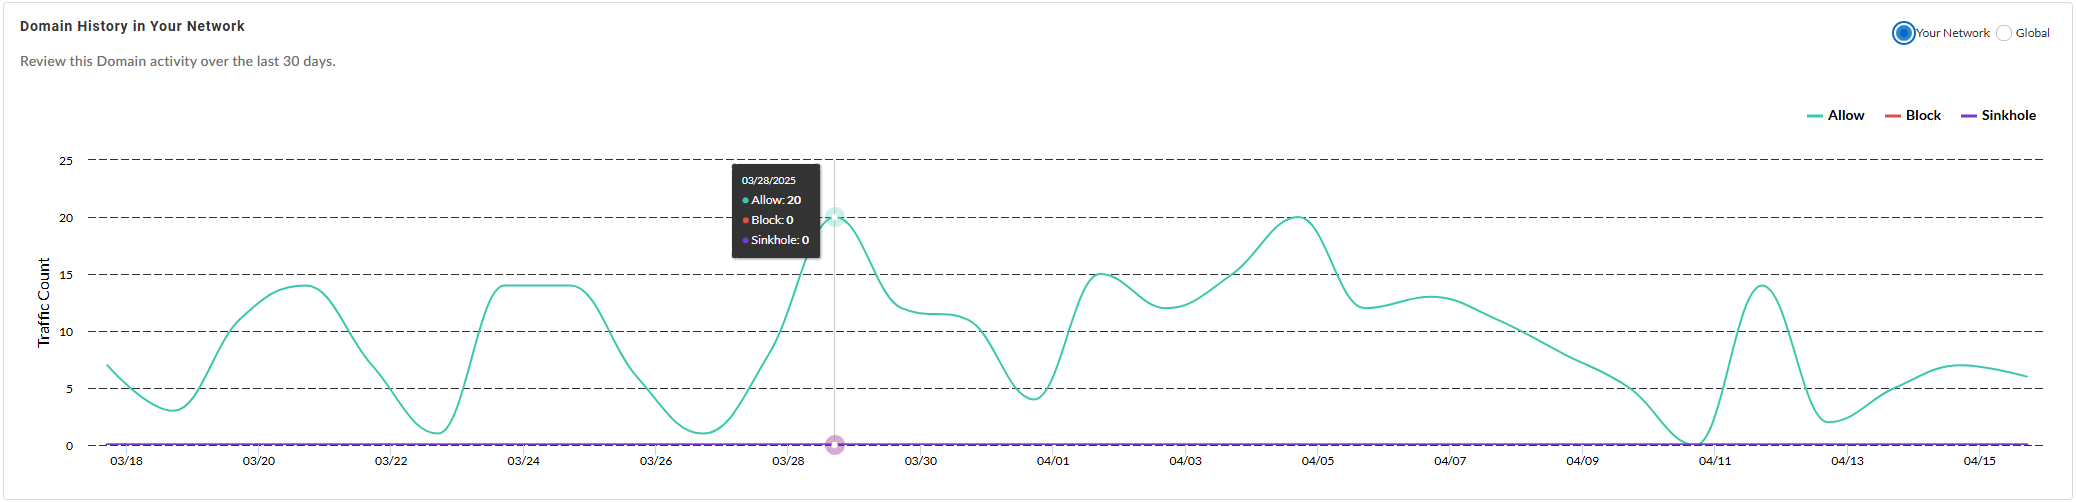
Domain History {in Your Network | Globally}—Shows the
number of times the domain was accessed by endpoints in your
network (or globally, depending on the widget setting)
during the past 30 days.
Globally:
In Your Network:
| |
|
Passive DNS History —Review the passive DNS history of
DNS traffic records associated with the domain. That can
allow you to examine how domains have been resolved in the
past, track changes in DNS configurations, and identify
potentially malicious activities.
You can configure the fields displayed in the passive DNS
history table based on the following fields:
| |
|
Whois Information —Displays general domain information
based on the resource's publicly available registration
details.
|
URL
Learn about the URL’s activity across all traffic Palo Alto Networks analyzes.
The search results include:
|
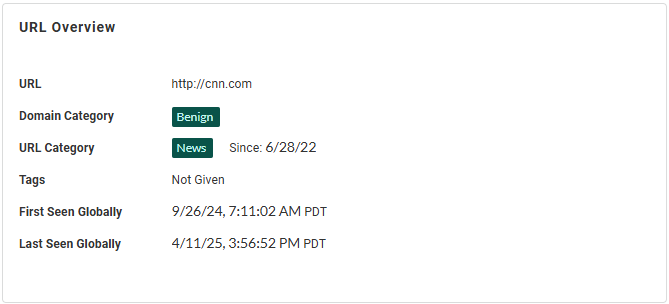
URL Overview—View general information about the URL,
including the domain and URL categories as determined by the
Advanced DNS Security and Advanced URL Filtering services,
respectively, the category tags, and, if the IP address has
been analyzed previously, the timestamp when it was
initially and last observed, globally.
| |
|
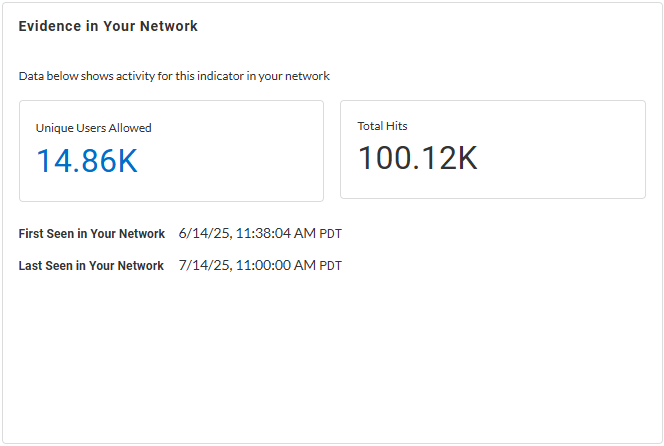
Evidence in Your Network—Learn about
detection reasons with timestamps when it was initially and
last observed in your network, unique allowed users, and
total hits data for the web request.
| |
|
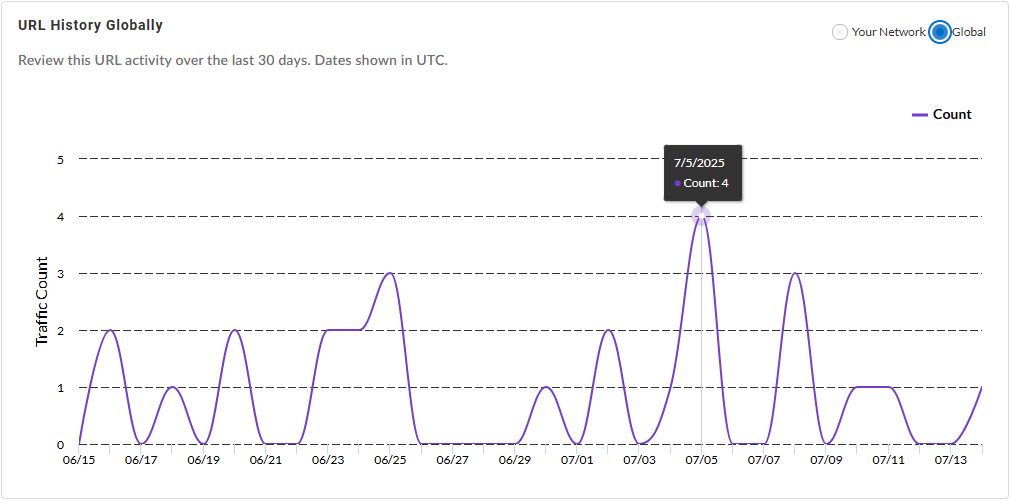
URL History {in Your Network | Globally}—Shows the
number of times the URL was accessed by endpoints in your
network (or globally, depending on the widget setting)
during the past 30 days.
Globally:
In Your Network:
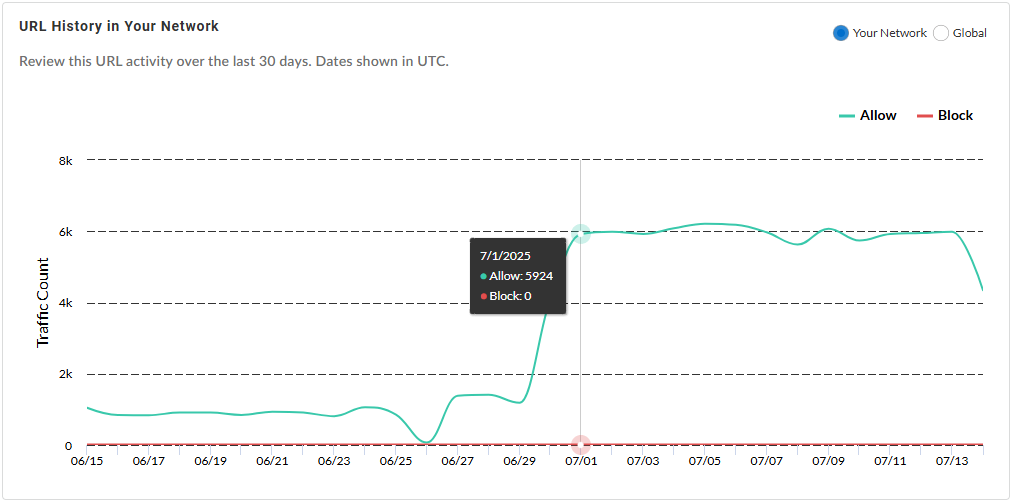
| |
|
Passive DNS History —Review the passive DNS history of
DNS traffic records associated with the URL. That can allow
you to examine how domains have been resolved in the past,
track changes in DNS configurations, and identify
potentially malicious activities.
You can configure the fields displayed in the passive DNS
history table based on the following fields:
| |
|
Whois Information —Displays general URL information
based on the resource's publicly available registration
details.
|
File Hash
File hash search summarizes the file details in a report based on data generated
during WildFire analysis. You can download the report as a PDF or MAEC file in
cases where the sample is determined to be malicious, phishing, grayware, or
benign. Unknown samples do not generate a report.
WildFire samples that generate a verdict provide file information and session
information at a minimum; while samples that have undergone additional analysis
produce specific analysis data that is relevant to actions taken by the sample.
You can drill down on the search results to review the following information
categories:
|
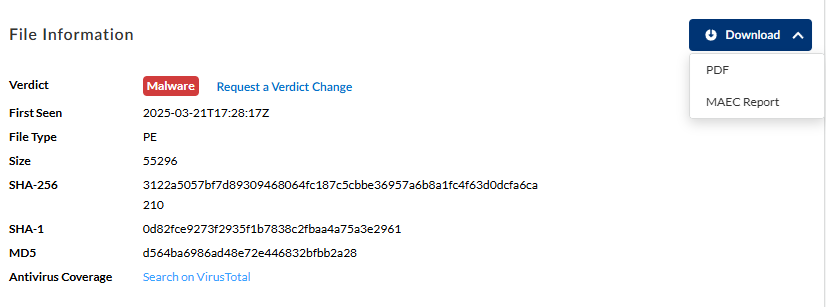
File Information—View general file information,
including the file hash, size, and type, as categorized by
WildFire. You can also the see the verdict of the sample
here. Alternatively, you can search directly on
VirusTotal for additional
information about suspicious files, domains, URLs, IP
addresses using the supplied hash value. If the verdict is
classified incorrectly, request for a verdict change. The
Palo Alto Networks threat team investigates further on the
sample and updates the verdict if found incorrect.
You can also download the WildFire report of the selected
sample hash as a PDF or MAEC file.
| |
|
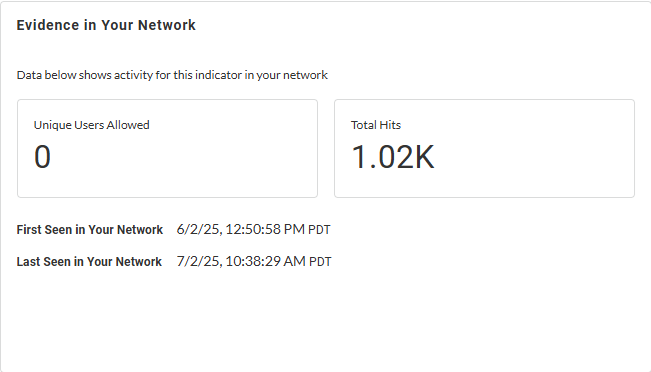
Evidence in Your Network—Learn about
detection reasons, as provided by WildFire, for the given
file hash with timestamps when it was initially and last
observed in your network, unique allowed users, and total
hits data for the web request.
| |
|
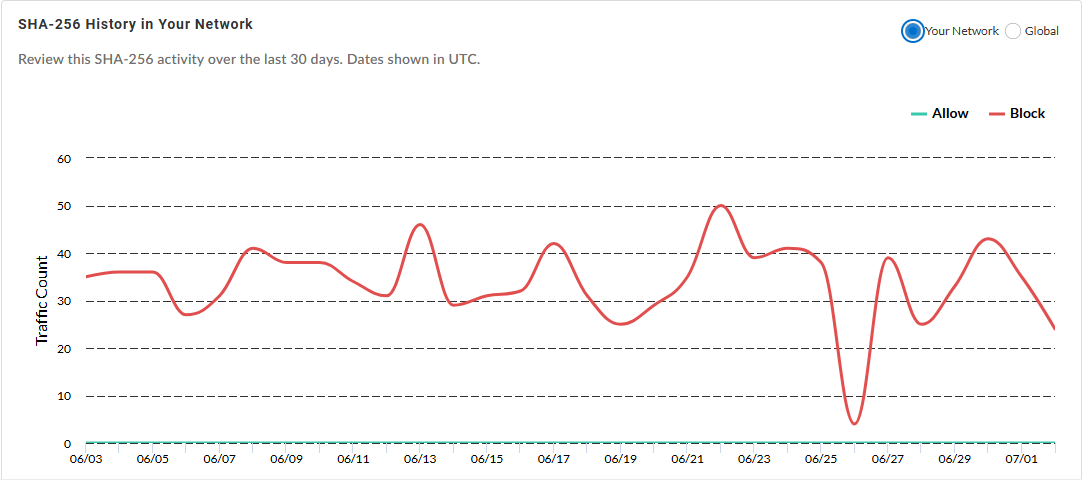
SHA-256 History in Your Network—View
the historical prevalence of the specified file hash in your
network, and globally, based on the allow and block actions
taken by the NGFW.
| |
|
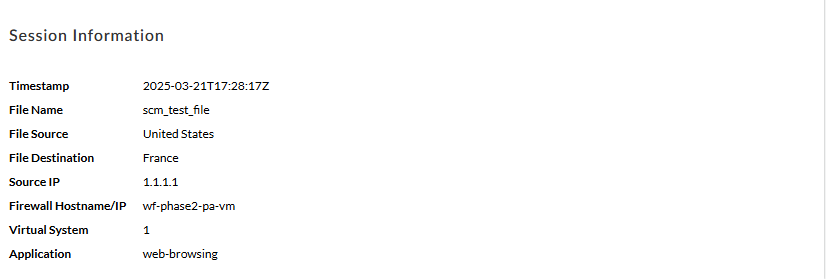
Session Information—Learn about the
network session for a sample. Use this data to learn more
about the context of the threat, know the affected hosts and
clients, and the applications used to deliver the
malware.
| |
|
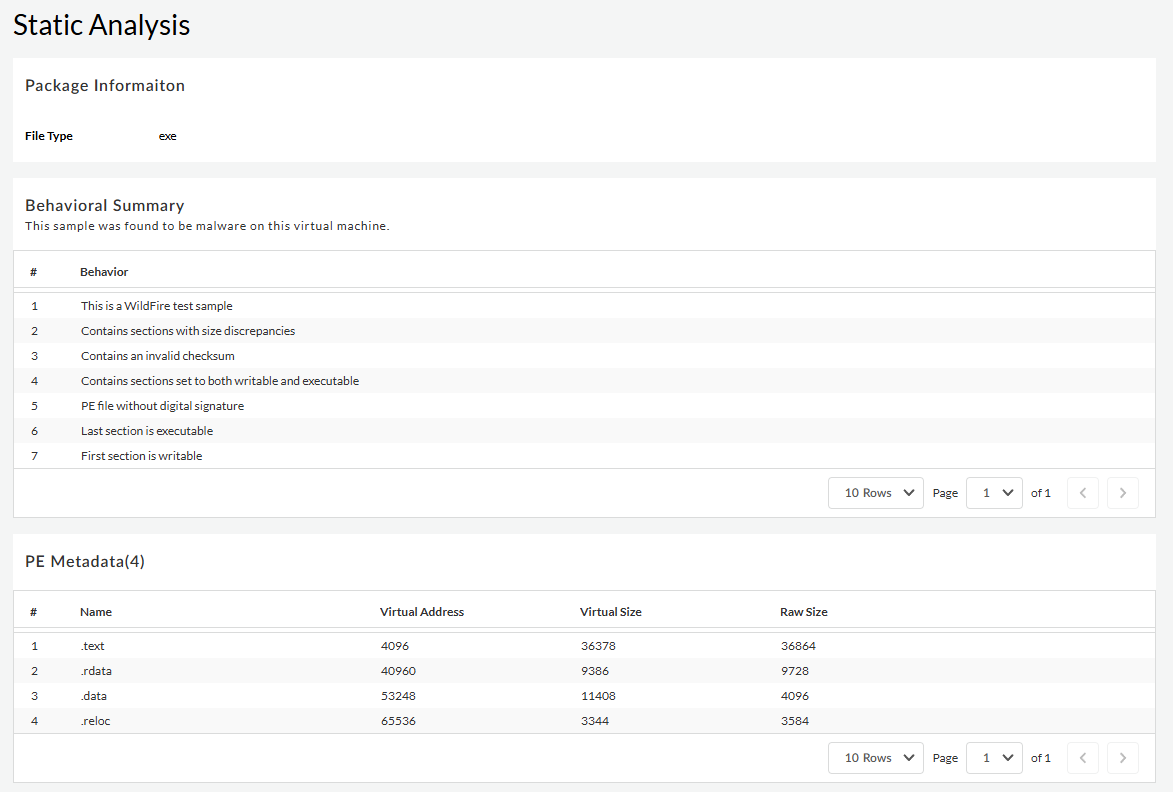
Static Analysis—Static analysis looks at the contents
of a specific file before the file is executed in the
WildFire analysis environment. This also shows the
suspicious file properties, processes, and behaviors
detected during static analysis. The search result varies
depending on the file type.
| |
|
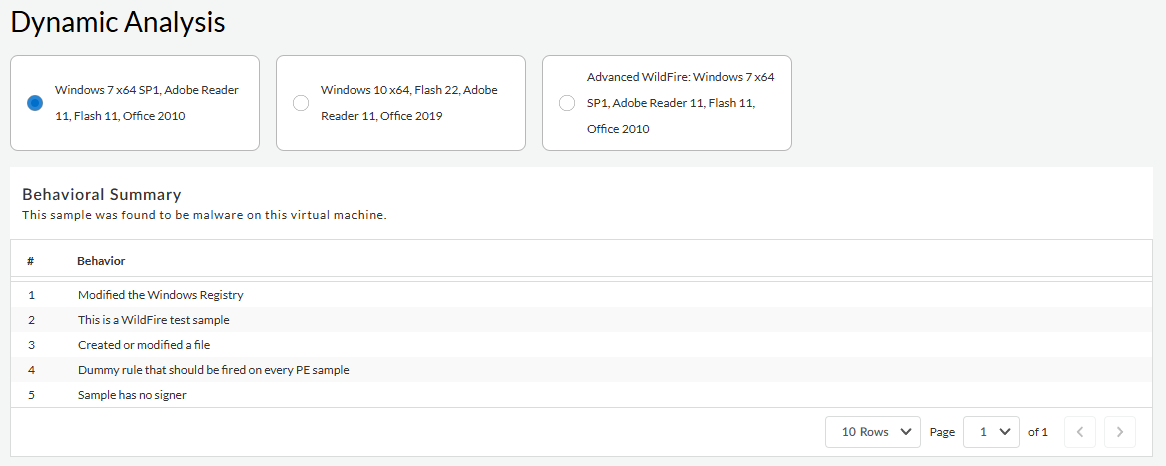
Dynamic Analysis—When WildFire encounters a sample
that requires additional analysis, such as an unknown
sample, the file is forwarded to the Advanced WildFire cloud
an is inspected in detail using WildFire dynamic
analysis. You can pivot between the various
analysis environments used to view the specific analysis
results generated by each. This can include samples analyzed
by Advanced WildFire
techniques (Intelligent Run-time Memory Analysis
analysis, hypervisor Dynamic Analysis, Dependency Emulation,
etc.), a cloud-based engine that detects and prevents highly
evasive malware threats. You can view the observed behaviors
and use this information for post execution analysis. You
can check the process activities involved, and the sequence
of events that took place in your system while executing the
file.
| |
|
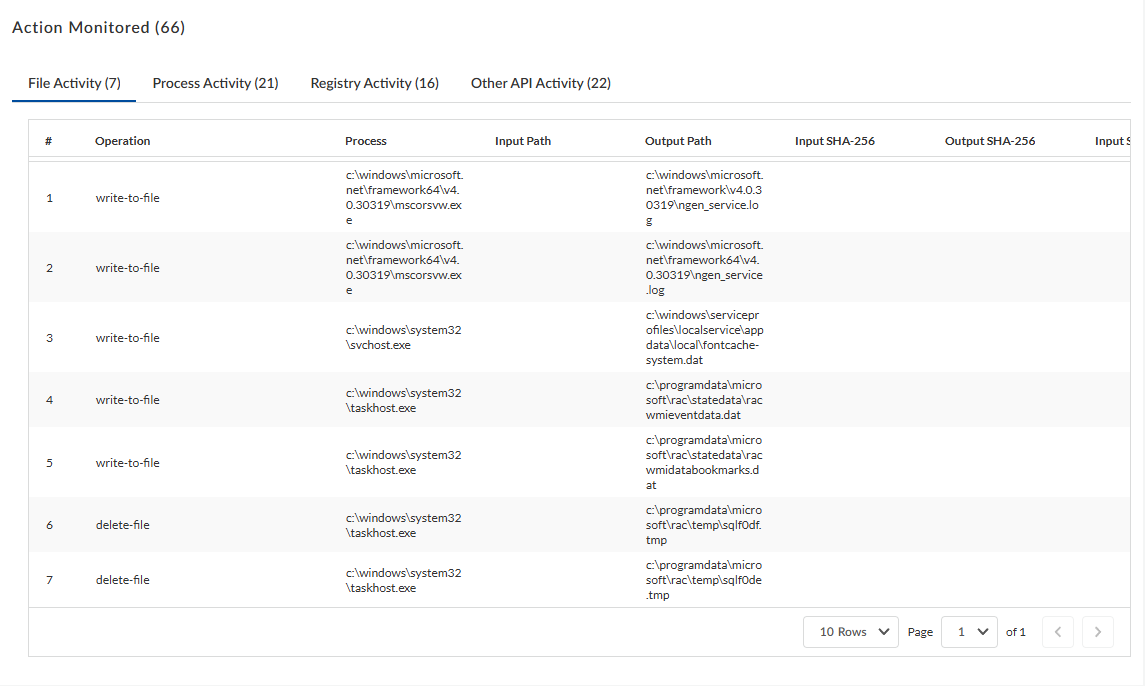
Actions Monitored —Review various sample process
activity details that WildFire recorded during sample
analysis.
|