Enterprise DLP
View an Enterprise DLP Incident
Table of Contents
View an Enterprise DLP Incident
View the DLP incident for sensitive traffic that matches traffic that matches your
data profiles.
On May 7, 2025, Palo Alto Networks is introducing new Evidence Storage and Syslog Forwarding service IP
addresses to improve performance and expand availability for these services
globally.
You must allow these new service IP addresses on your network
to avoid disruptions for these services. Review the Enterprise DLP
Release Notes for more
information.
| Where Can I Use This? | What Do I Need? |
|---|---|
|
Or any of the following licenses that include the Enterprise DLP license
|
Enterprise Data Loss Prevention (E-DLP) generates an incident when traffic matches data pattern match
criteria your Enterprise DLP data profiles. Data security administrators can filter
and view the incident details for the detected traffic, such as matched data patterns,
the source and destination of the traffic, the file, and file type. Additionally, the
incident displays the specific data pattern that the traffic matched and also displays
the total number of unique and total occurrences of the data pattern matches.
Data security administrators can view the matched sensitive data in the form of a
snippet. A snippet is evidence or identifiable information associated with a
pattern match. For example, if you specified a data pattern of Credit Card Number, the
managed firewall returns the credit card number of the user as the snippet that was
matched. By default, the enforcement point returns snippets.
Enterprise DLP uses data masking to mask the data in the snippets. By
default, the DLP incident displays the last four digits of the value in cleartext
(partial masking). For example, a DLP incident displays a snippet of a credit card
number as XXXX-XXXX-XXXX-1234. You can also specify the
data to be completely displayed in cleartext or to fully mask the data and hide all
values.
Additionally, you can configure syslog forwarding for Enterprise DLP
incidents to your third-party security information and event management (SIEM), Security
Orchestration, and Response (SOAR), or other automated ticketing systems. This enables
your SOC Analysts and Incident admins to effectively triage, review, and resolve data
security risks that occur in your organization.
- Strata Cloud Manager—View incidents generated by traffic forwarded to Enterprise DLP by NGFW, Prisma Access tenants, Prisma Browser, Email DLP, and Data Security (SaaS API) on Strata Cloud Manager.
- Panorama—View incidents generated by traffic forwarded to Enterprise DLP by NGFW and Prisma Access tenants on Panorama.
- Email DLP in SaaS Security—View incidents generated by traffic forwarded to Enterprise DLP by Email DLP in SaaS Security.
- Endpoint DLP—View incidents generated by traffic forwarded to Enterprise DLP for Endpoint DLP on Strata Cloud Manager.
Snippets are available for regular expression (regex)-based patterns only.
View Enterprise DLP Incident Details on Strata Cloud Manager
View the incident details for traffic that matches your Enterprise Data Loss Prevention (E-DLP) data
profiles on Strata Cloud Manager.
- Log in to Strata Cloud Manager.(Optional) Configure syslog forwarding for Enterprise DLP incidents.Select .Filter and group the Incidents list to narrow down the DLP incidents you want to investigate.
- Scan Date—Enterprise DLP supports filtering DLP incidents generated in the Past 60 Minutes, Past 3 Hours, Past 24 Hours, Past 7 Days, Past 30 Days, or Past 90 Days.
- Add Filters—Add additional filters to narrow down the scope of DLP incidents.Palo Alto Networks recommends using the Data Profile filter. This filter displays all DLP incidents triggered by a specific data profile.For the Regions filter, Enterprise DLP generates incidents in the Region where the Public Cloud Server is located.For Prisma Access (Managed by Strata Cloud Manager) and NGFW (Managed by Strata Cloud Manager), Enterprise DLP automatically resolves to the closest Public Cloud Server to where the inspected traffic originated.When Palo Alto Networks introduces a new Public Cloud Server, Enterprise DLP automatically resolve to it if it’s closer to where the inspected traffic originated.This might mean that new DLP incidents generated after the release of a new Public Cloud Server are generated in a different Region.
- Group By—Group the DLP incidents based on the Incident Assignee, Source, Destination, Asset, or Product (enforcement channel).
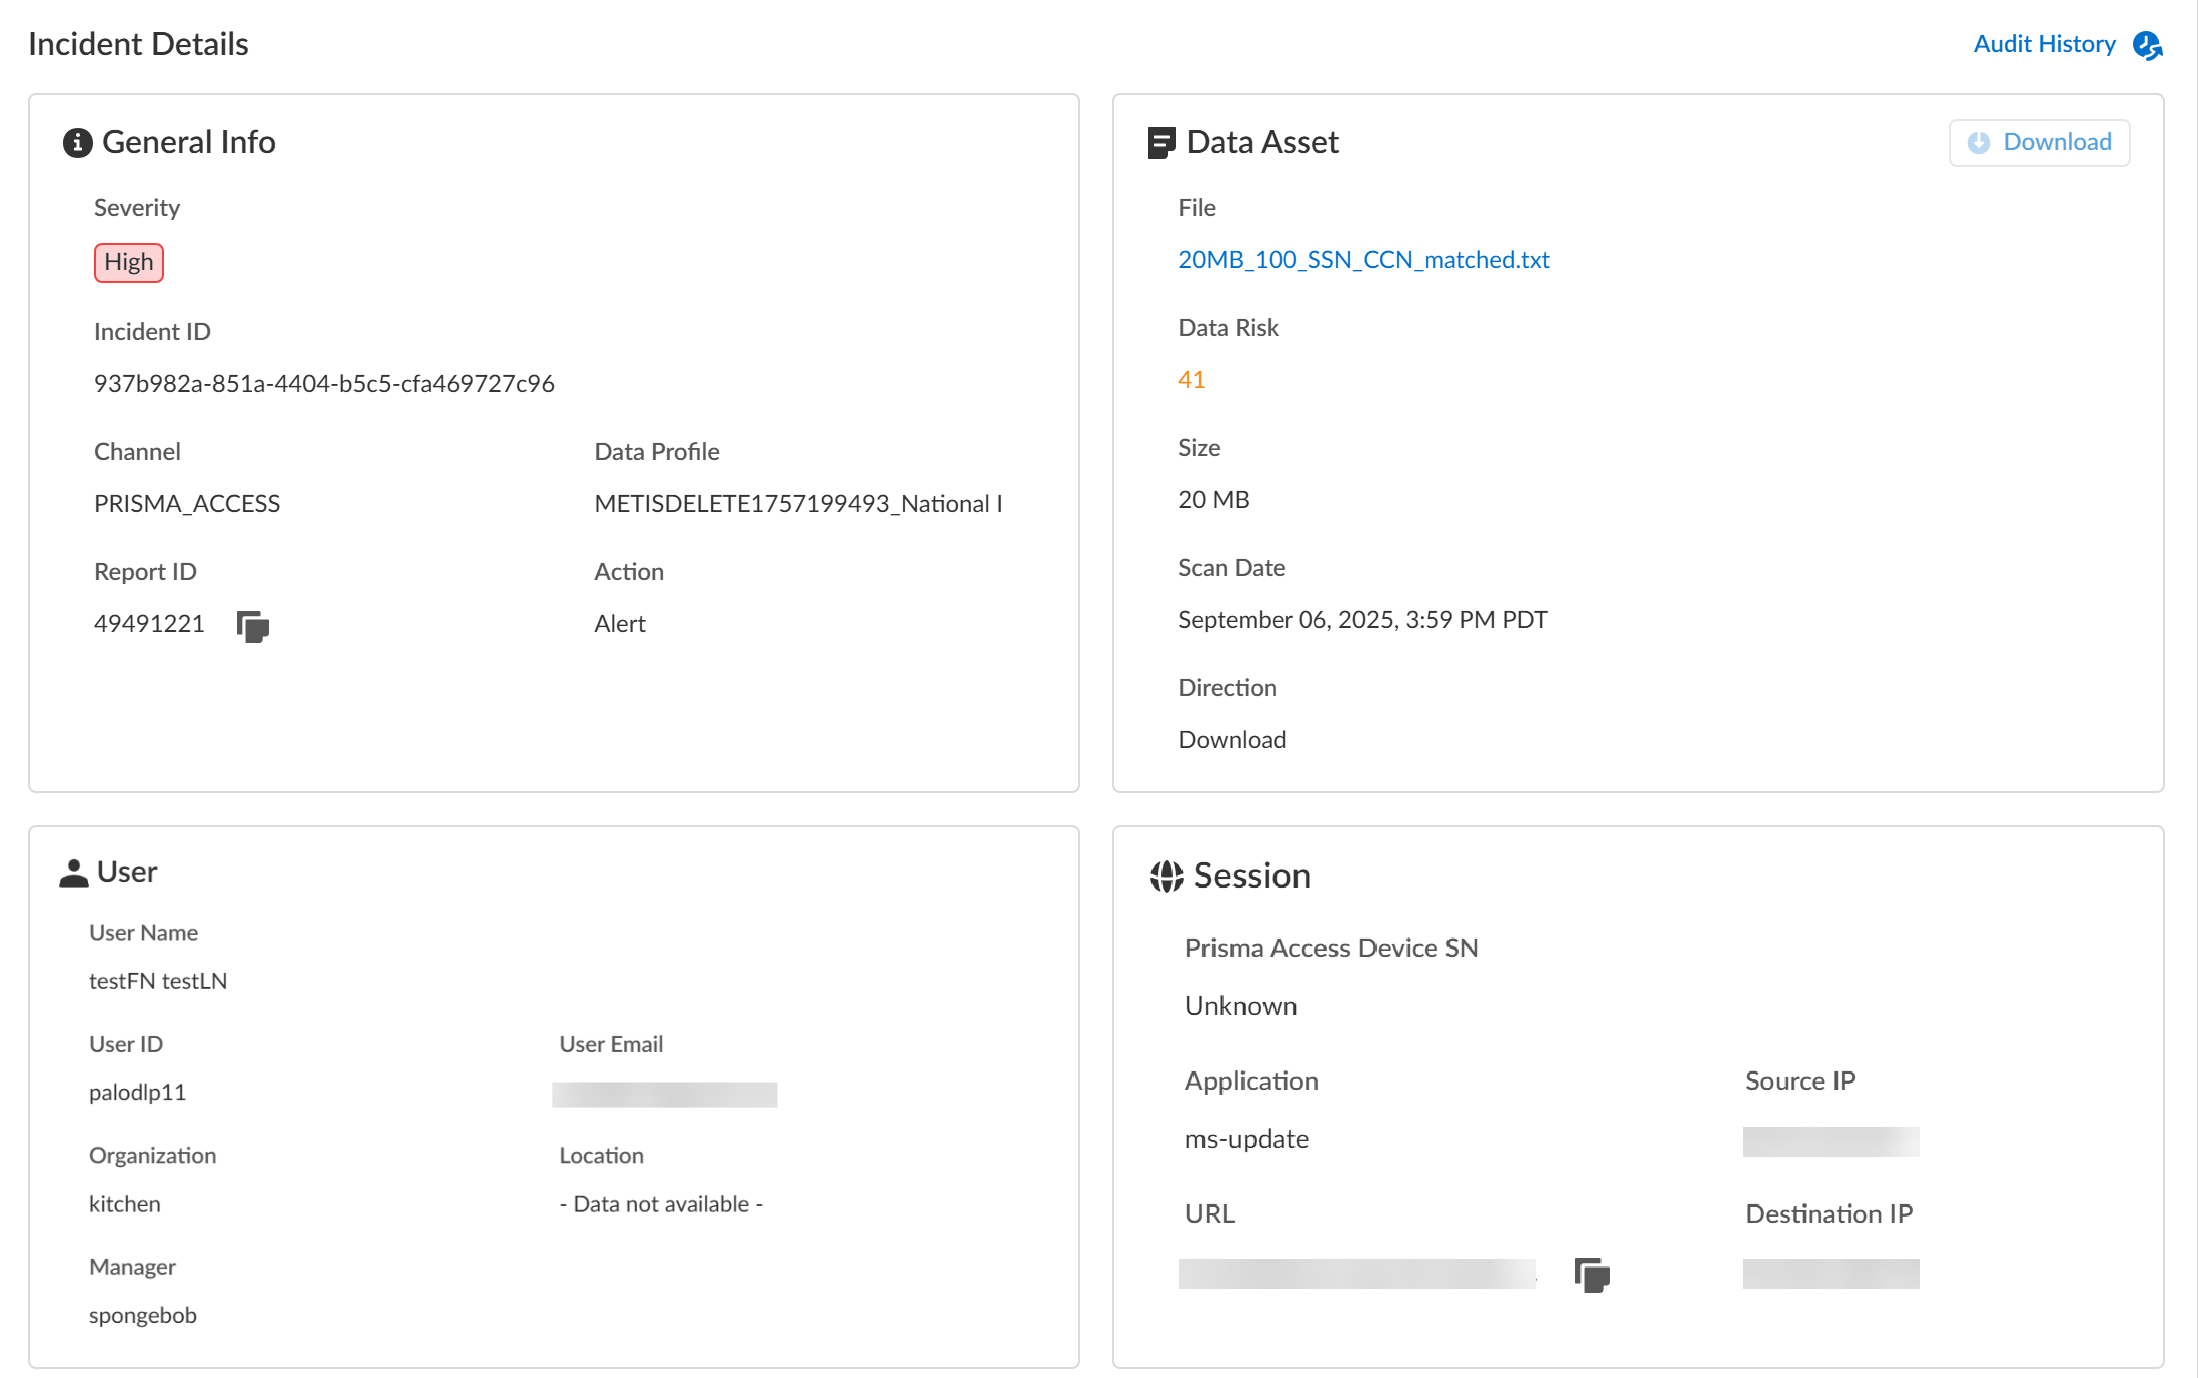
Review the Incidents list and click the Incident ID to view the DLP incident details.You can also select and assign one or more incidents to a specific data security administrator to investigate and resolve as part of y our Enterprise DLP incident case management process from this list.Review the Incident Details to review specific incident details.Make note of the Report ID for the DLP incident if you have not already done so. Use the Report ID to view additional Traffic log details regarding the DLP incident.- General InfoThe General Info panel displays high-level information about the DLP incident.
- Severity—The incident severity configured in the DLP rule (Strata Cloud Manager) or the data filtering profile (Panorama).
- Incident ID—Unique ID for the DLP incident.
- Channel—The enforcement point that forwarded traffic to Enterprise DLP through which the incident occurred.
- Data Profile—Data profile that traffic matched against that generated the incident.
- Report ID—Unique ID used to view additional Traffic log details regarding the DLP incident.
- Action—The action Enterprise DLP took on the traffic that matched your DLP rule.
- Data Asset
- File—Name of the file containing sensitive data that generated the incident. For non-file inspection, the filename is http-post-put.
- Data Risk—The data risk score associated with the incident. The data risk score provides quantifiable metrics to measure the overall data risk for your organization.
- Size—Size of the file or non-file traffic that generated the DLP incident.
- Scan Date—Date and time Enterprise DLP inspected the matched traffic and generated the DLP incident.
- Direction—Indicates whether the matched traffic was a Download or an Upload when the incident occurred.
- Download—If you have Evidence Storage configured, you can Download the file that generated the DLP incident for further investigation.
- UserUser data requires integration with Cloud Identity Engine (CIE) to display. The User data displayed correspond to Palo Alto Networks Attributes that correlate to specific directory provider fields in CIE.
- User Name—Name of the user as configured in CIE that generated the DLP incident.Corresponding Palo Alto Networks Attribute is Name.
- User ID—ID of the user who generated the DLP incident.The User ID field does not require CIE integration. However, the corresponding Palo Alto Networks Attribute is User Principal Name.
- User Email—Email of the user who generated the DLP incident.Corresponding Palo Alto Networks Attribute is Mail.
- Organization—Organization the user who generated the DLP incident is associated with.Corresponding Palo Alto Networks Attribute is Department.
- Location—Location of the user who generated the DLP incident.Corresponding Palo Alto Networks Attribute is Location.
- Manager—Manager of the user who generated the DLP incident.Corresponding Palo Alto Networks Attribute is Manager.
- Session
- Prisma Access Device SN—Serial number of the Prisma Access tenant that blocked traffic or generated an alert.
- Source IP—Upload or download IP address of the app or user source.
- Destination IP—Target upload or download IP address of the app or user.
- Application—App-ID for the target app.
- URL—Fully Qualified Domain Name (FQDN) of the target app or user.
- Case ManagementManually manage your DLP incidents to efficiently handle data security incident resolution across your security channels.
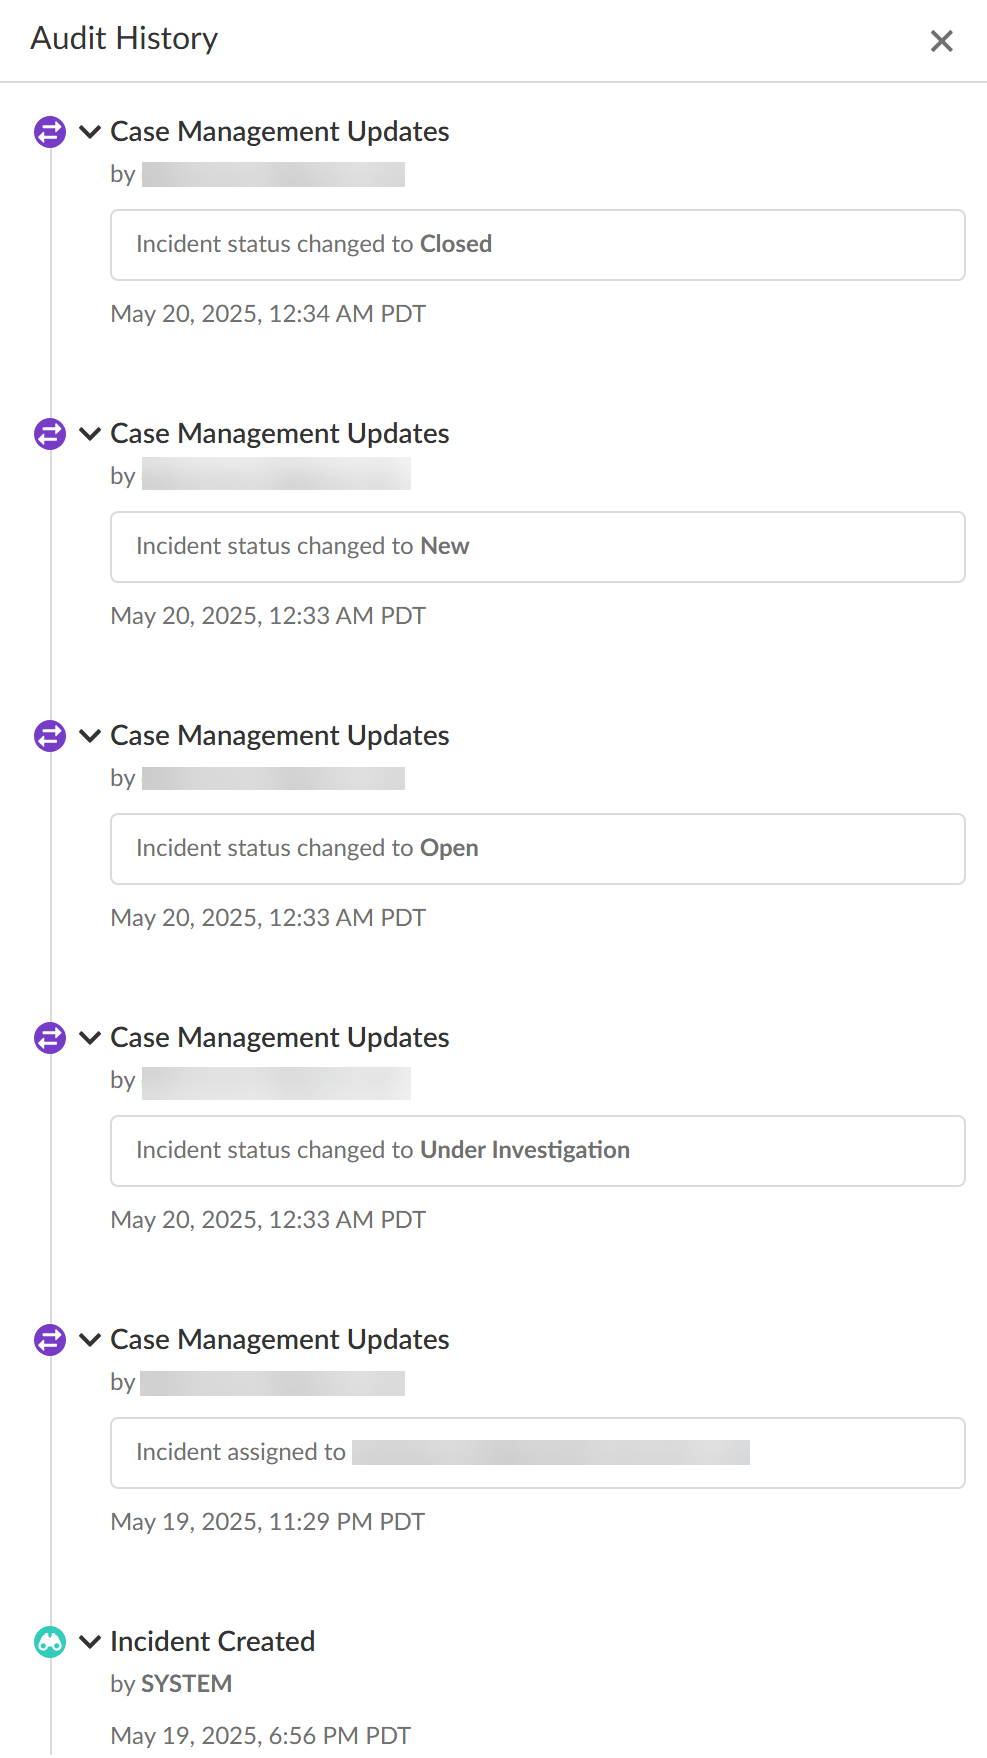
- Audit HistoryThe Audit History shows you the full Incident Case Management history for the specific DLP incident. It outlines every step of the case management process and the specific action taken by each user from when the incident case was assigned to when it was closed.
![]()
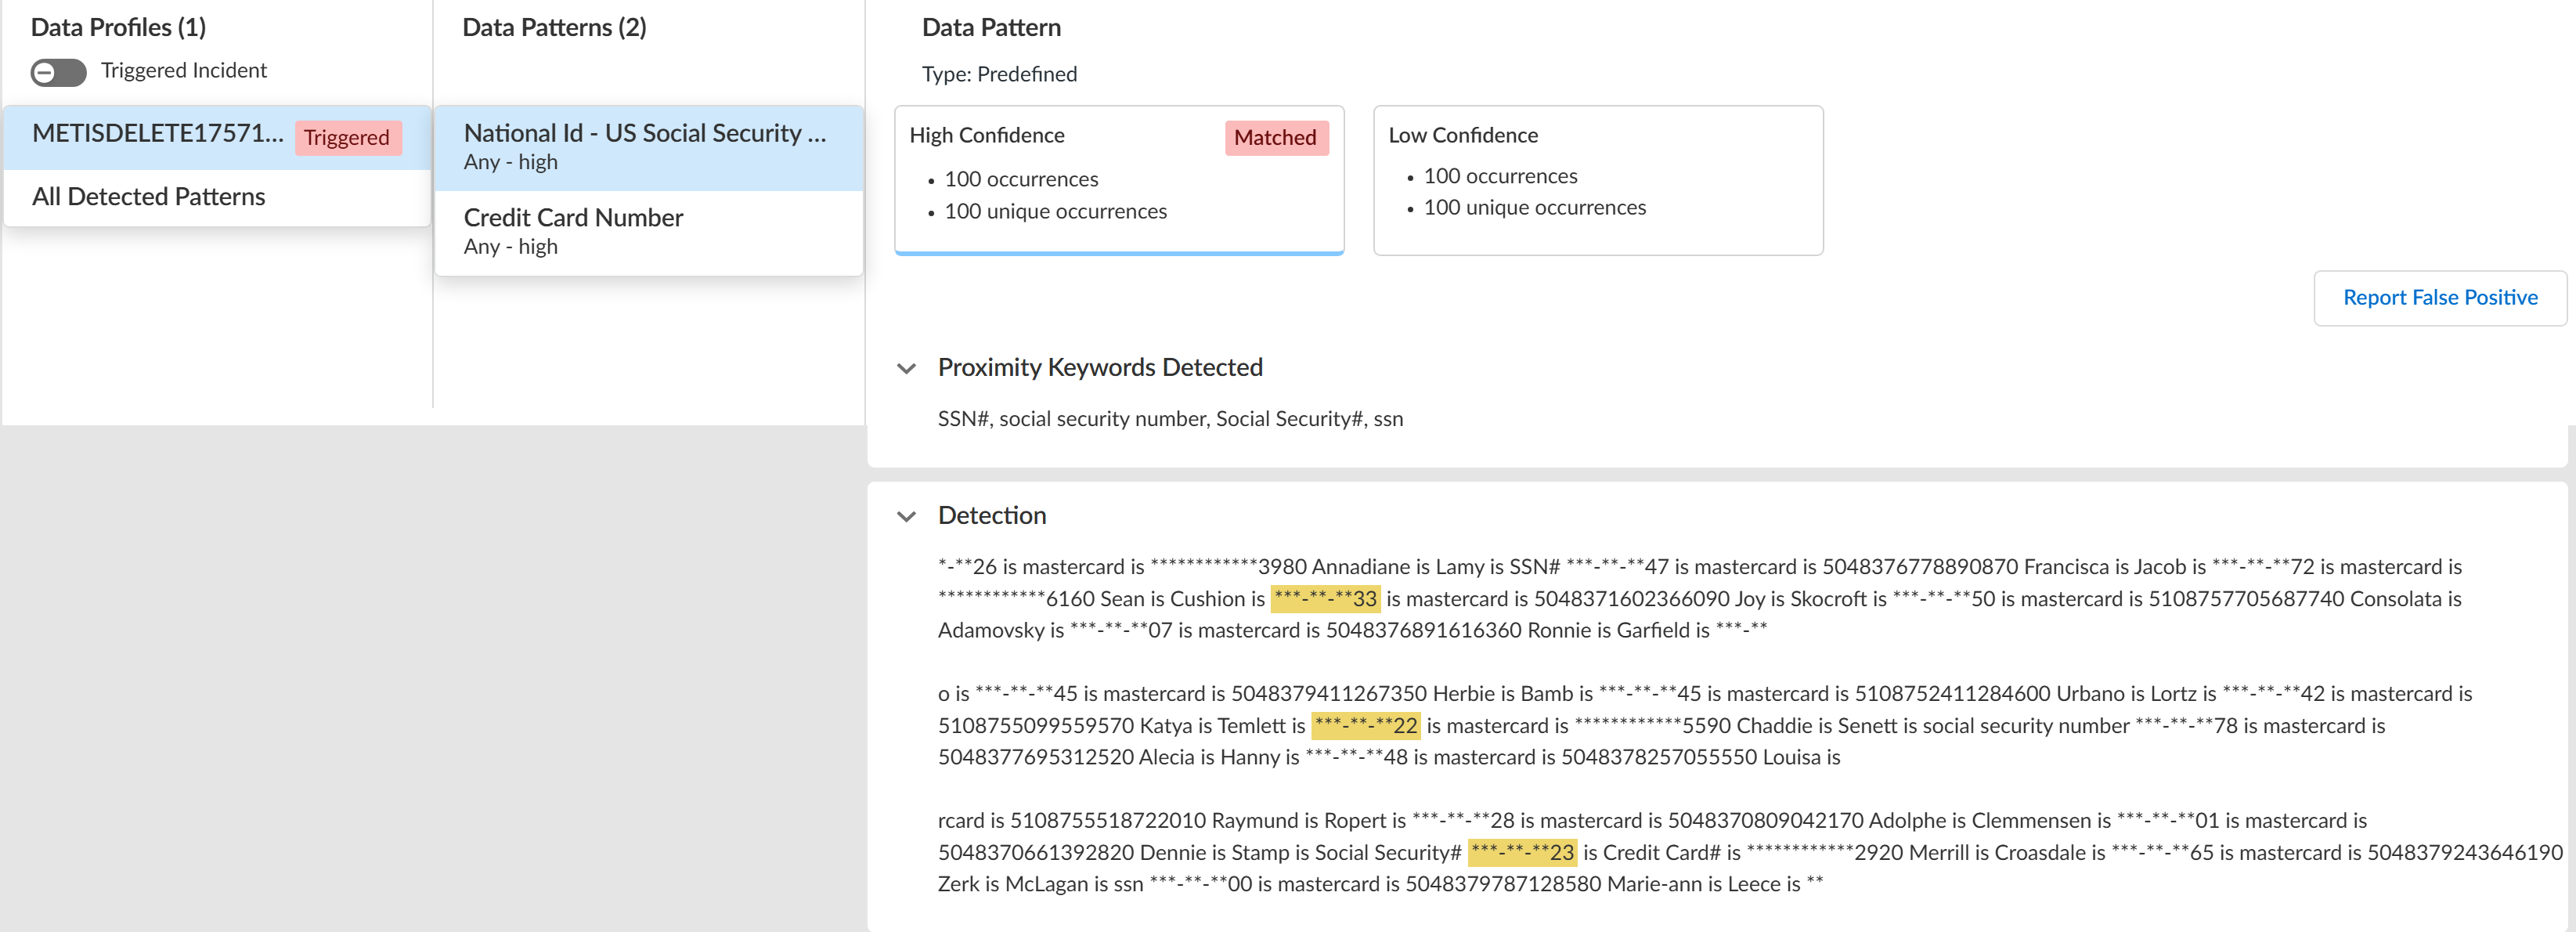
![]() Review the Matches within Data Profiles to review snippets of matching traffic and the data patterns that matched the traffic to better understand what sensitive data Enterprise DLP detected.Toggle the Triggered Incidents to display only the data patterns that contain matched criteria.
Review the Matches within Data Profiles to review snippets of matching traffic and the data patterns that matched the traffic to better understand what sensitive data Enterprise DLP detected.Toggle the Triggered Incidents to display only the data patterns that contain matched criteria.- Enterprise DLP generates an audit log when a user accesses a DLP incident and reviews the associated snippet.
- Enterprise DLP displays the proximity keyword and the corresponding snippet of sensitive data that generated the DLP incident.Proximity keywords for predefined data patterns are case insensitive and display exactly as detected in the snippet. Proximity keywords for custom data patterns and data dictionaries are case sensitive.For custom regex data patterns, Enterprise DLP displays only the first proximity keyword for sensitive data with a High Confidence match.
- (Nested and Granular Data Profiles) Enterprise DLP displays Triggered by each data profile containing match criteria in the data profile that inspected traffic matched against.
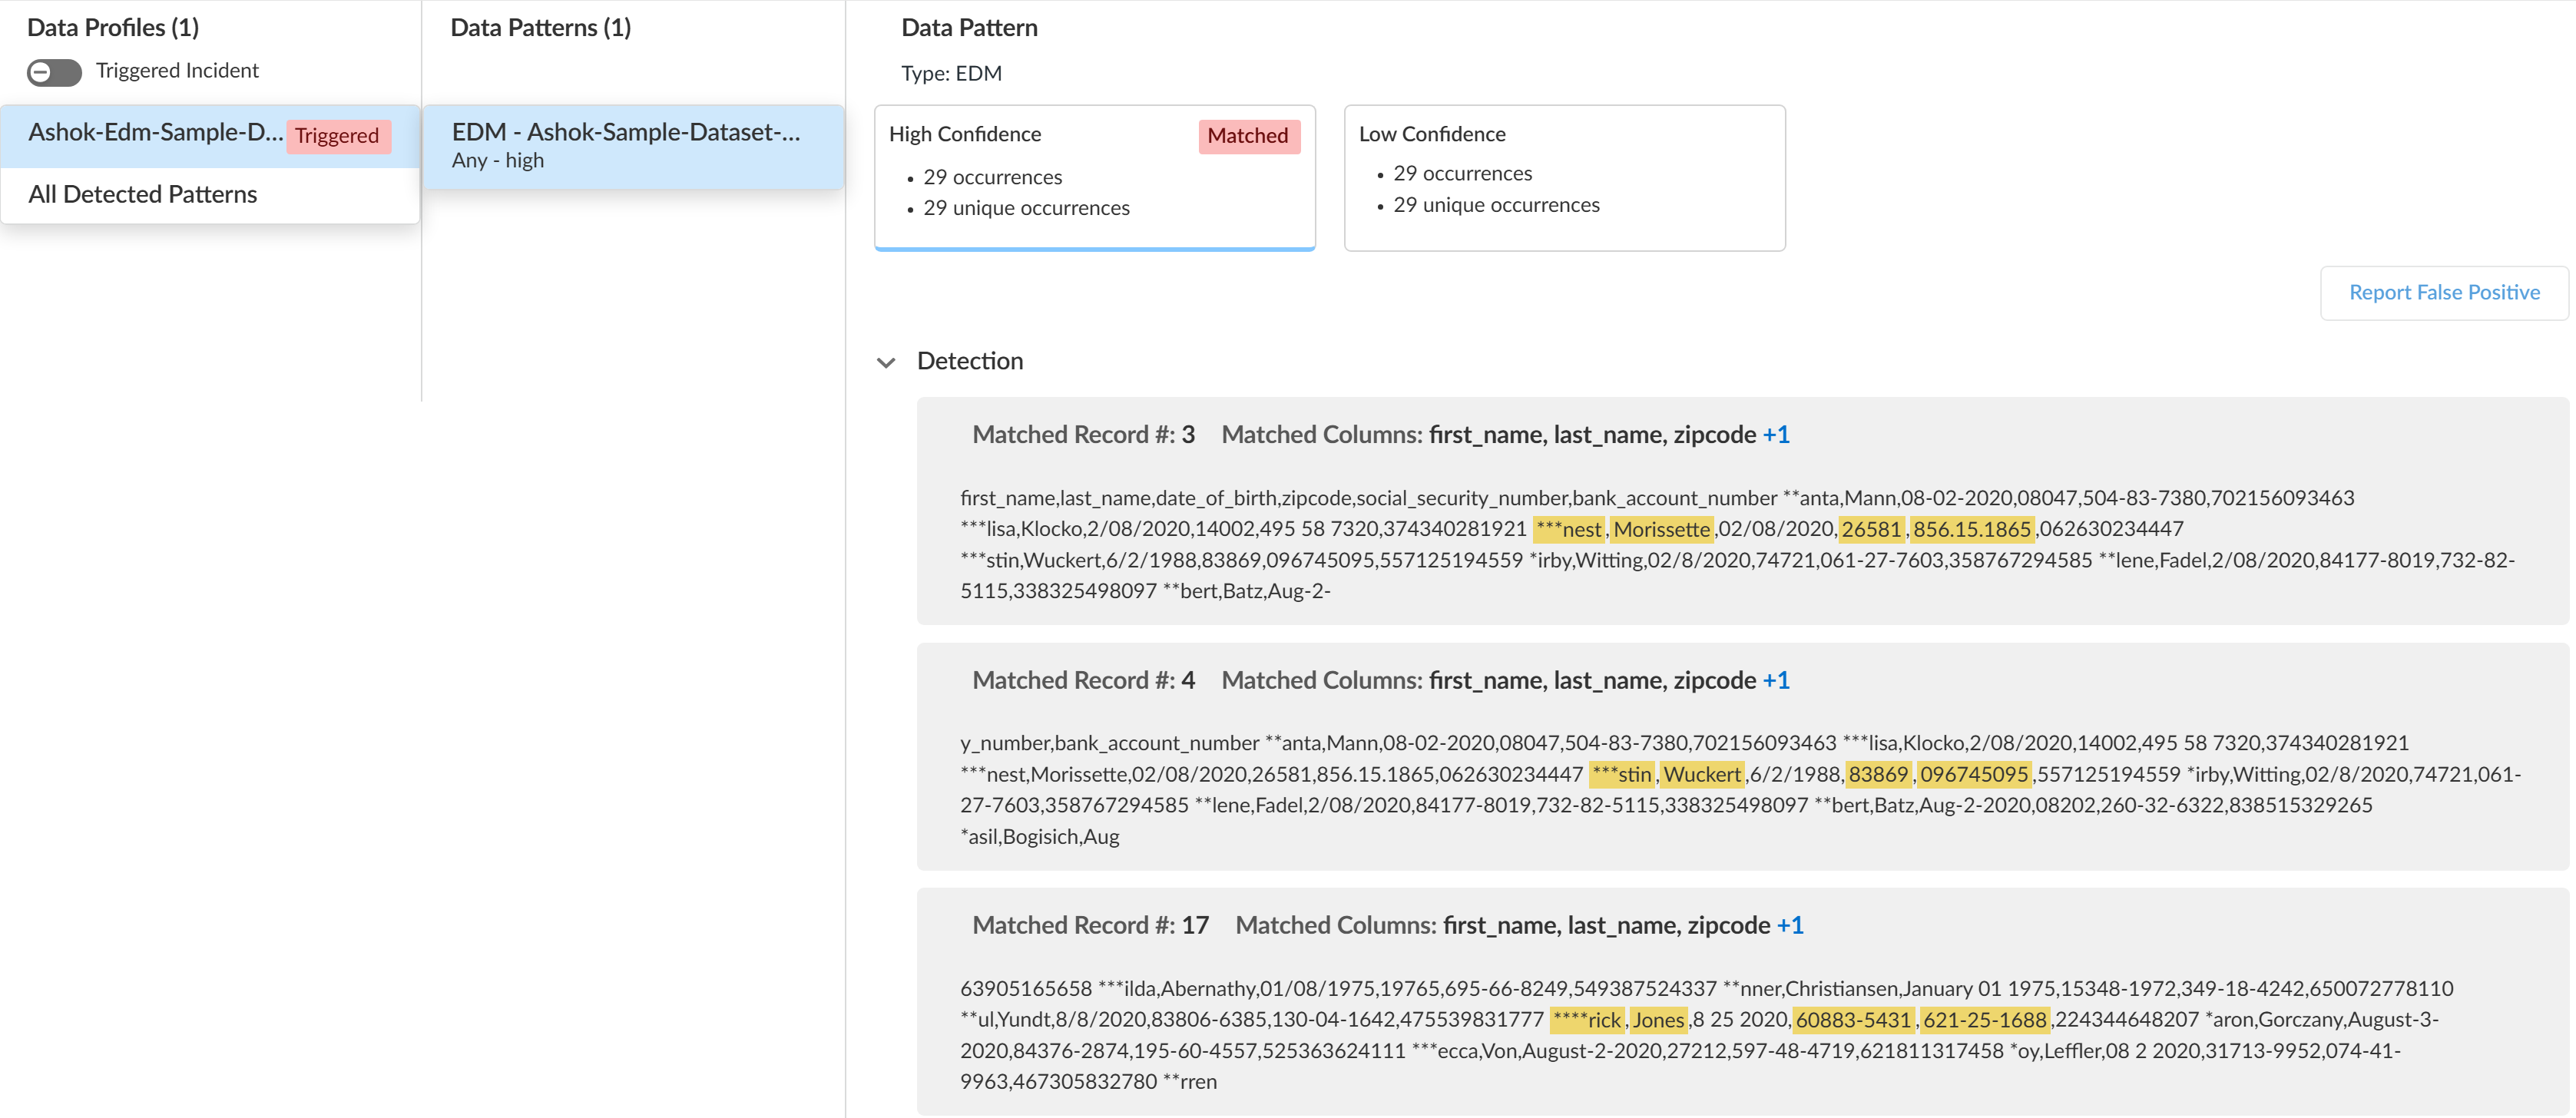
- When viewing a data pattern, Enterprise DLP displays the total number of Occurrences as well as the number of Unique Occurrences for all High, Medium, and Low Confidence detections.
- (EDM data sets) Enterprise DLP displays the column header of the EDM data set that matches the detected sensitive data. Enterprise DLP displays multiple column headers when sensitive data is detected in multiple different columns.
- Click Report False Positive if Enterprise DLP incorrectly detected and took action on the file or network traffic that it should not have. This is referred to as a false positive detection. Report a false positive detection to Palo Alto Networks to improve Enterprise DLP detection accuracy for yourself and other Enterprise DLP users.
General Example![]() EDM Data Set Example
EDM Data Set Example![]() Review the file log to learn about the traffic data for the DLP incident.
Review the file log to learn about the traffic data for the DLP incident.- Select .From the Firewall drop-down, select File.Filter to view the file log for the DLP incident using the Report ID.Report ID = <report-id>Review the file log to learn more about the traffic data for the DLP incident.Manage your Enterprise DLP incidents.
Panorama
View the log details for traffic that matches your data profiles on firewalls that are using Enterprise Data Loss Prevention (E-DLP) on the Panorama® management server.- Log in to the Panorama web interface.(Optional) Configure syslog forwarding for Enterprise DLP incidents.Select and Filter the data filtering logs by entering ( subtype eq dlp ).View more details about the file including file snippets.
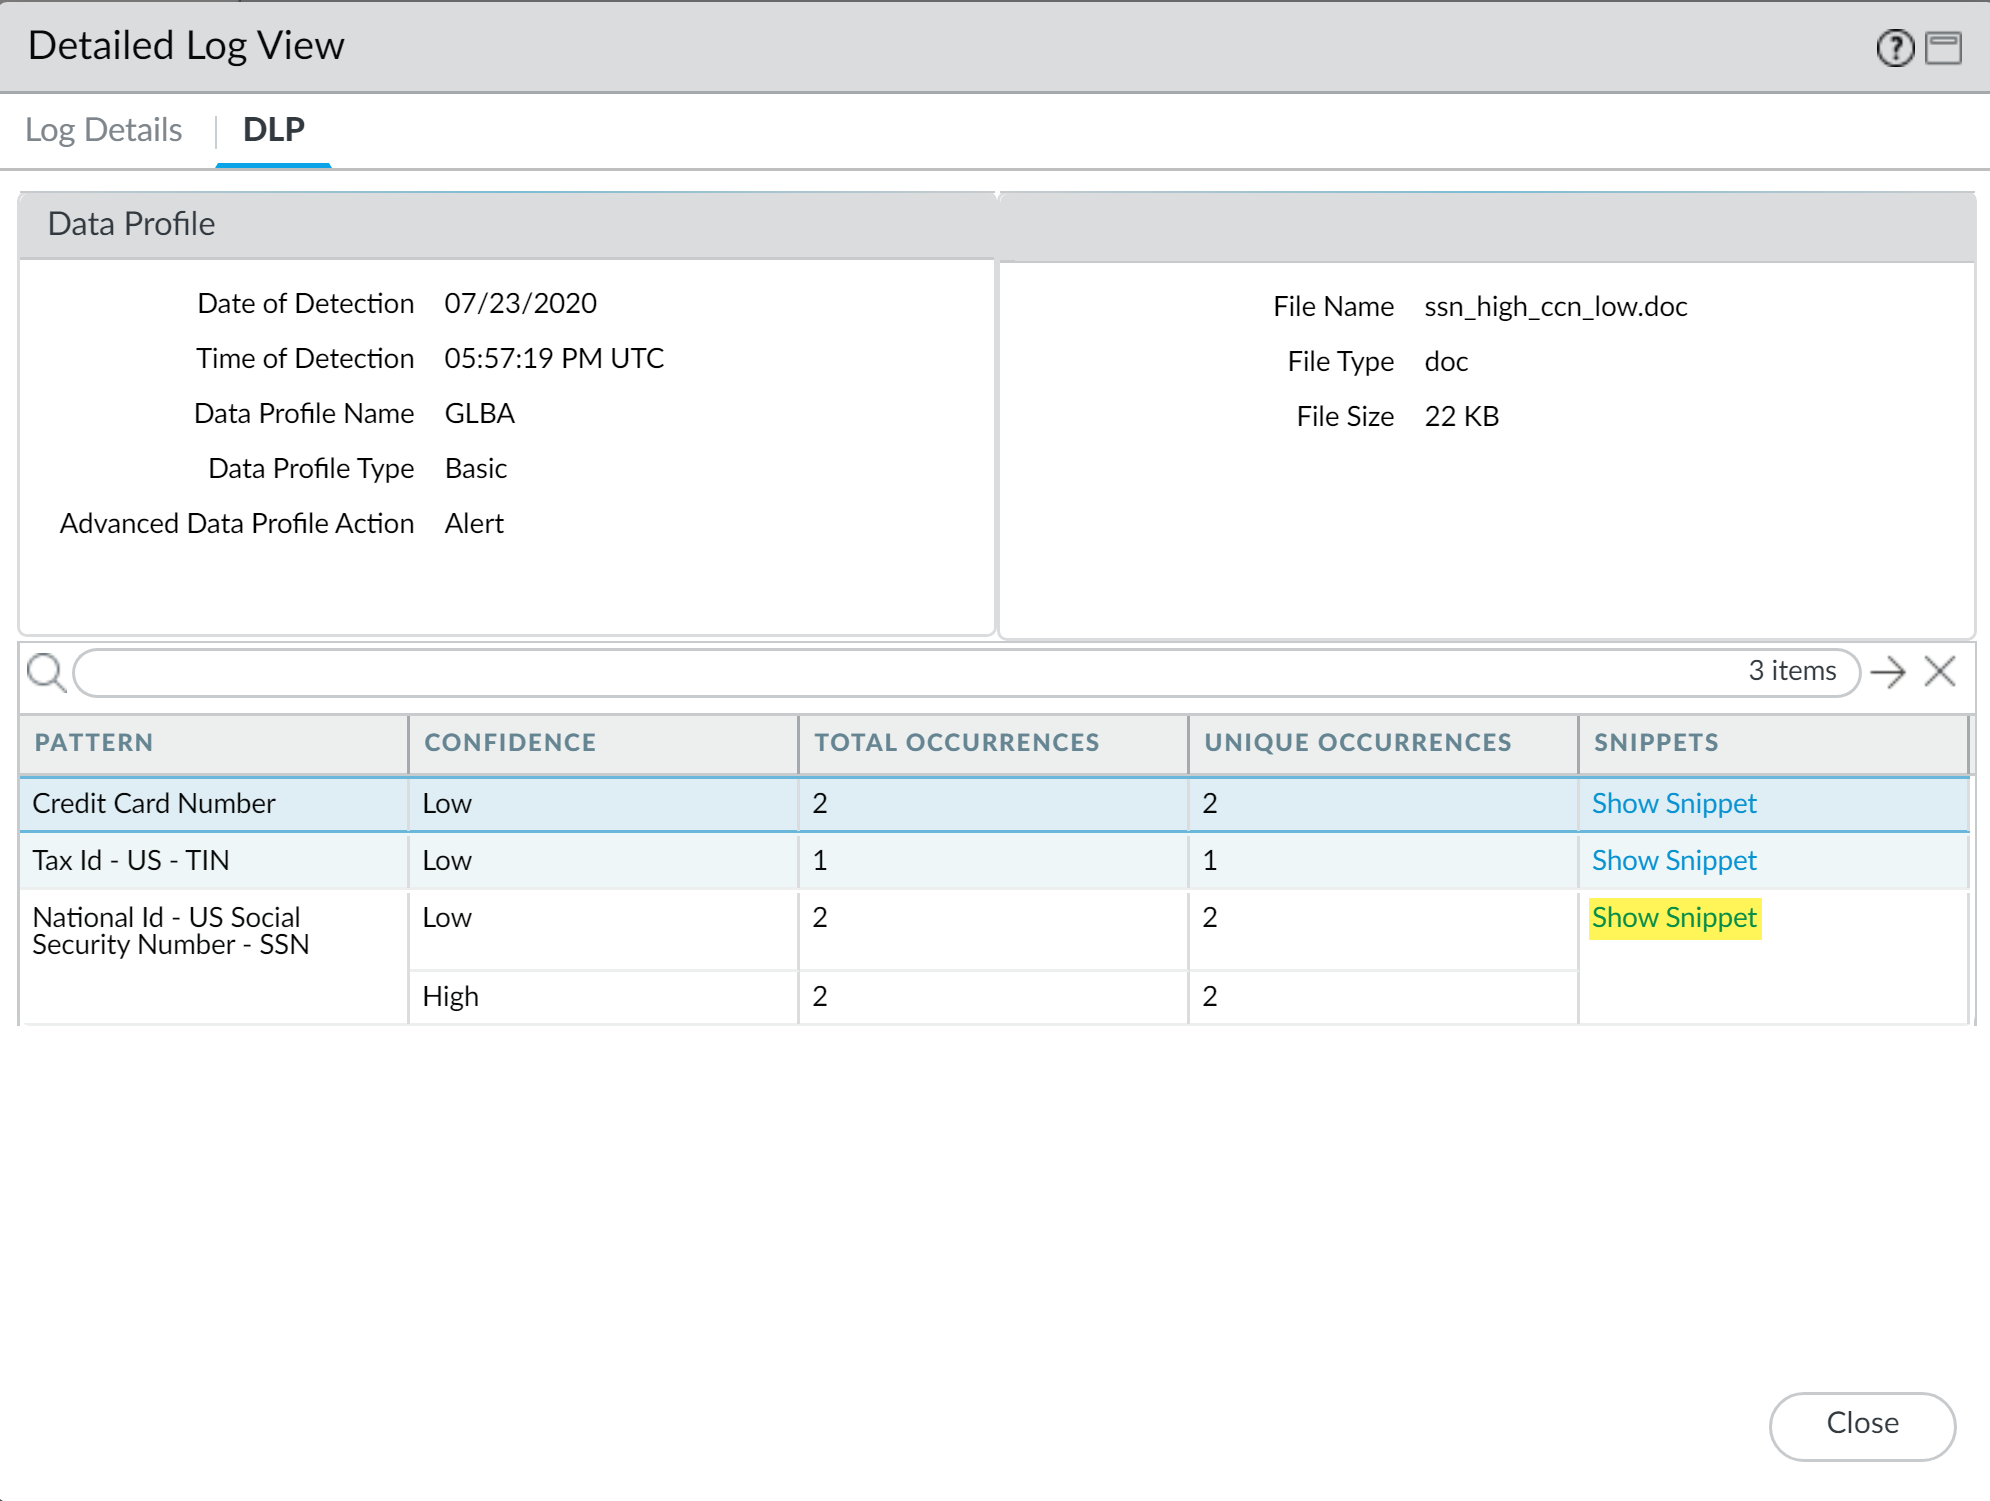
- Clickto the left of the specific log entry for which you want to view more details.
![]() Select DLP to view the pattern details.Show Snippet to view a snippet of the data that matched the specific data pattern.For nested data profiles, Enterprise DLP displays the name of the nested data profile and not the specific data profile containing the match criteria that matched inspected traffic. For example, you create a nested data profile called DataProfile and you add Profile1, Profile2, and Profile3. Enterprise DLP inspects traffic that matches Profile2 and blocks it. In this scenario, the Data Profile Name in the DLP incident logs displays DataProfile.
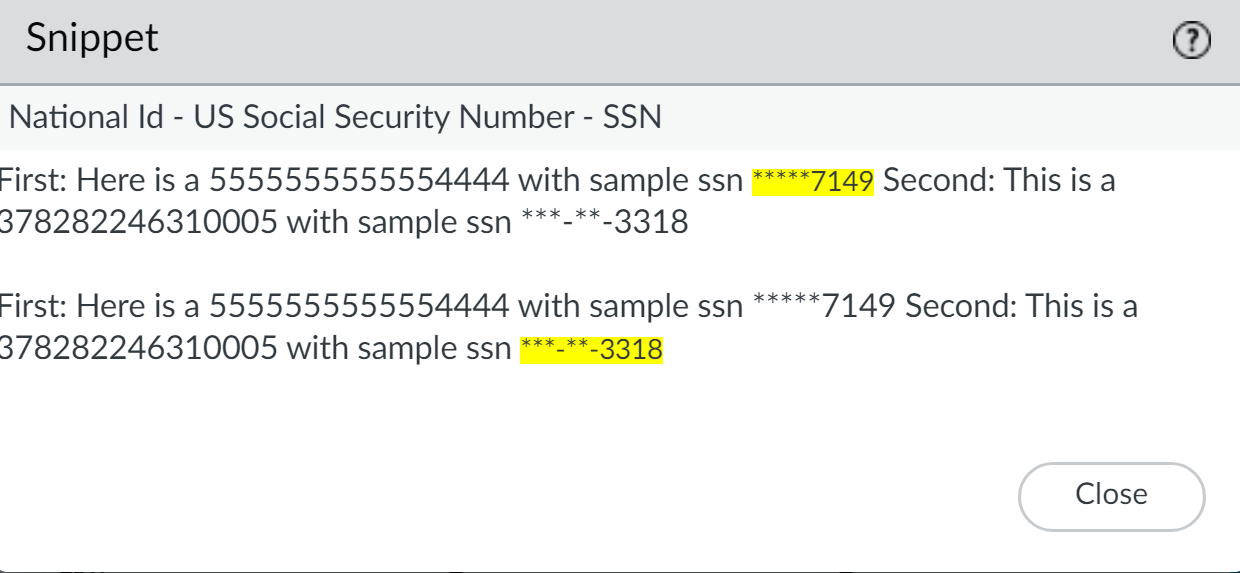
Select DLP to view the pattern details.Show Snippet to view a snippet of the data that matched the specific data pattern.For nested data profiles, Enterprise DLP displays the name of the nested data profile and not the specific data profile containing the match criteria that matched inspected traffic. For example, you create a nested data profile called DataProfile and you add Profile1, Profile2, and Profile3. Enterprise DLP inspects traffic that matches Profile2 and blocks it. In this scenario, the Data Profile Name in the DLP incident logs displays DataProfile.![]() Review the masked snippet to understand what sensitive data Enterprise DLP detected.
Review the masked snippet to understand what sensitive data Enterprise DLP detected.![]() Manage your Enterprise DLP incidents.
Manage your Enterprise DLP incidents.View Enterprise DLP Log Details for Email DLP
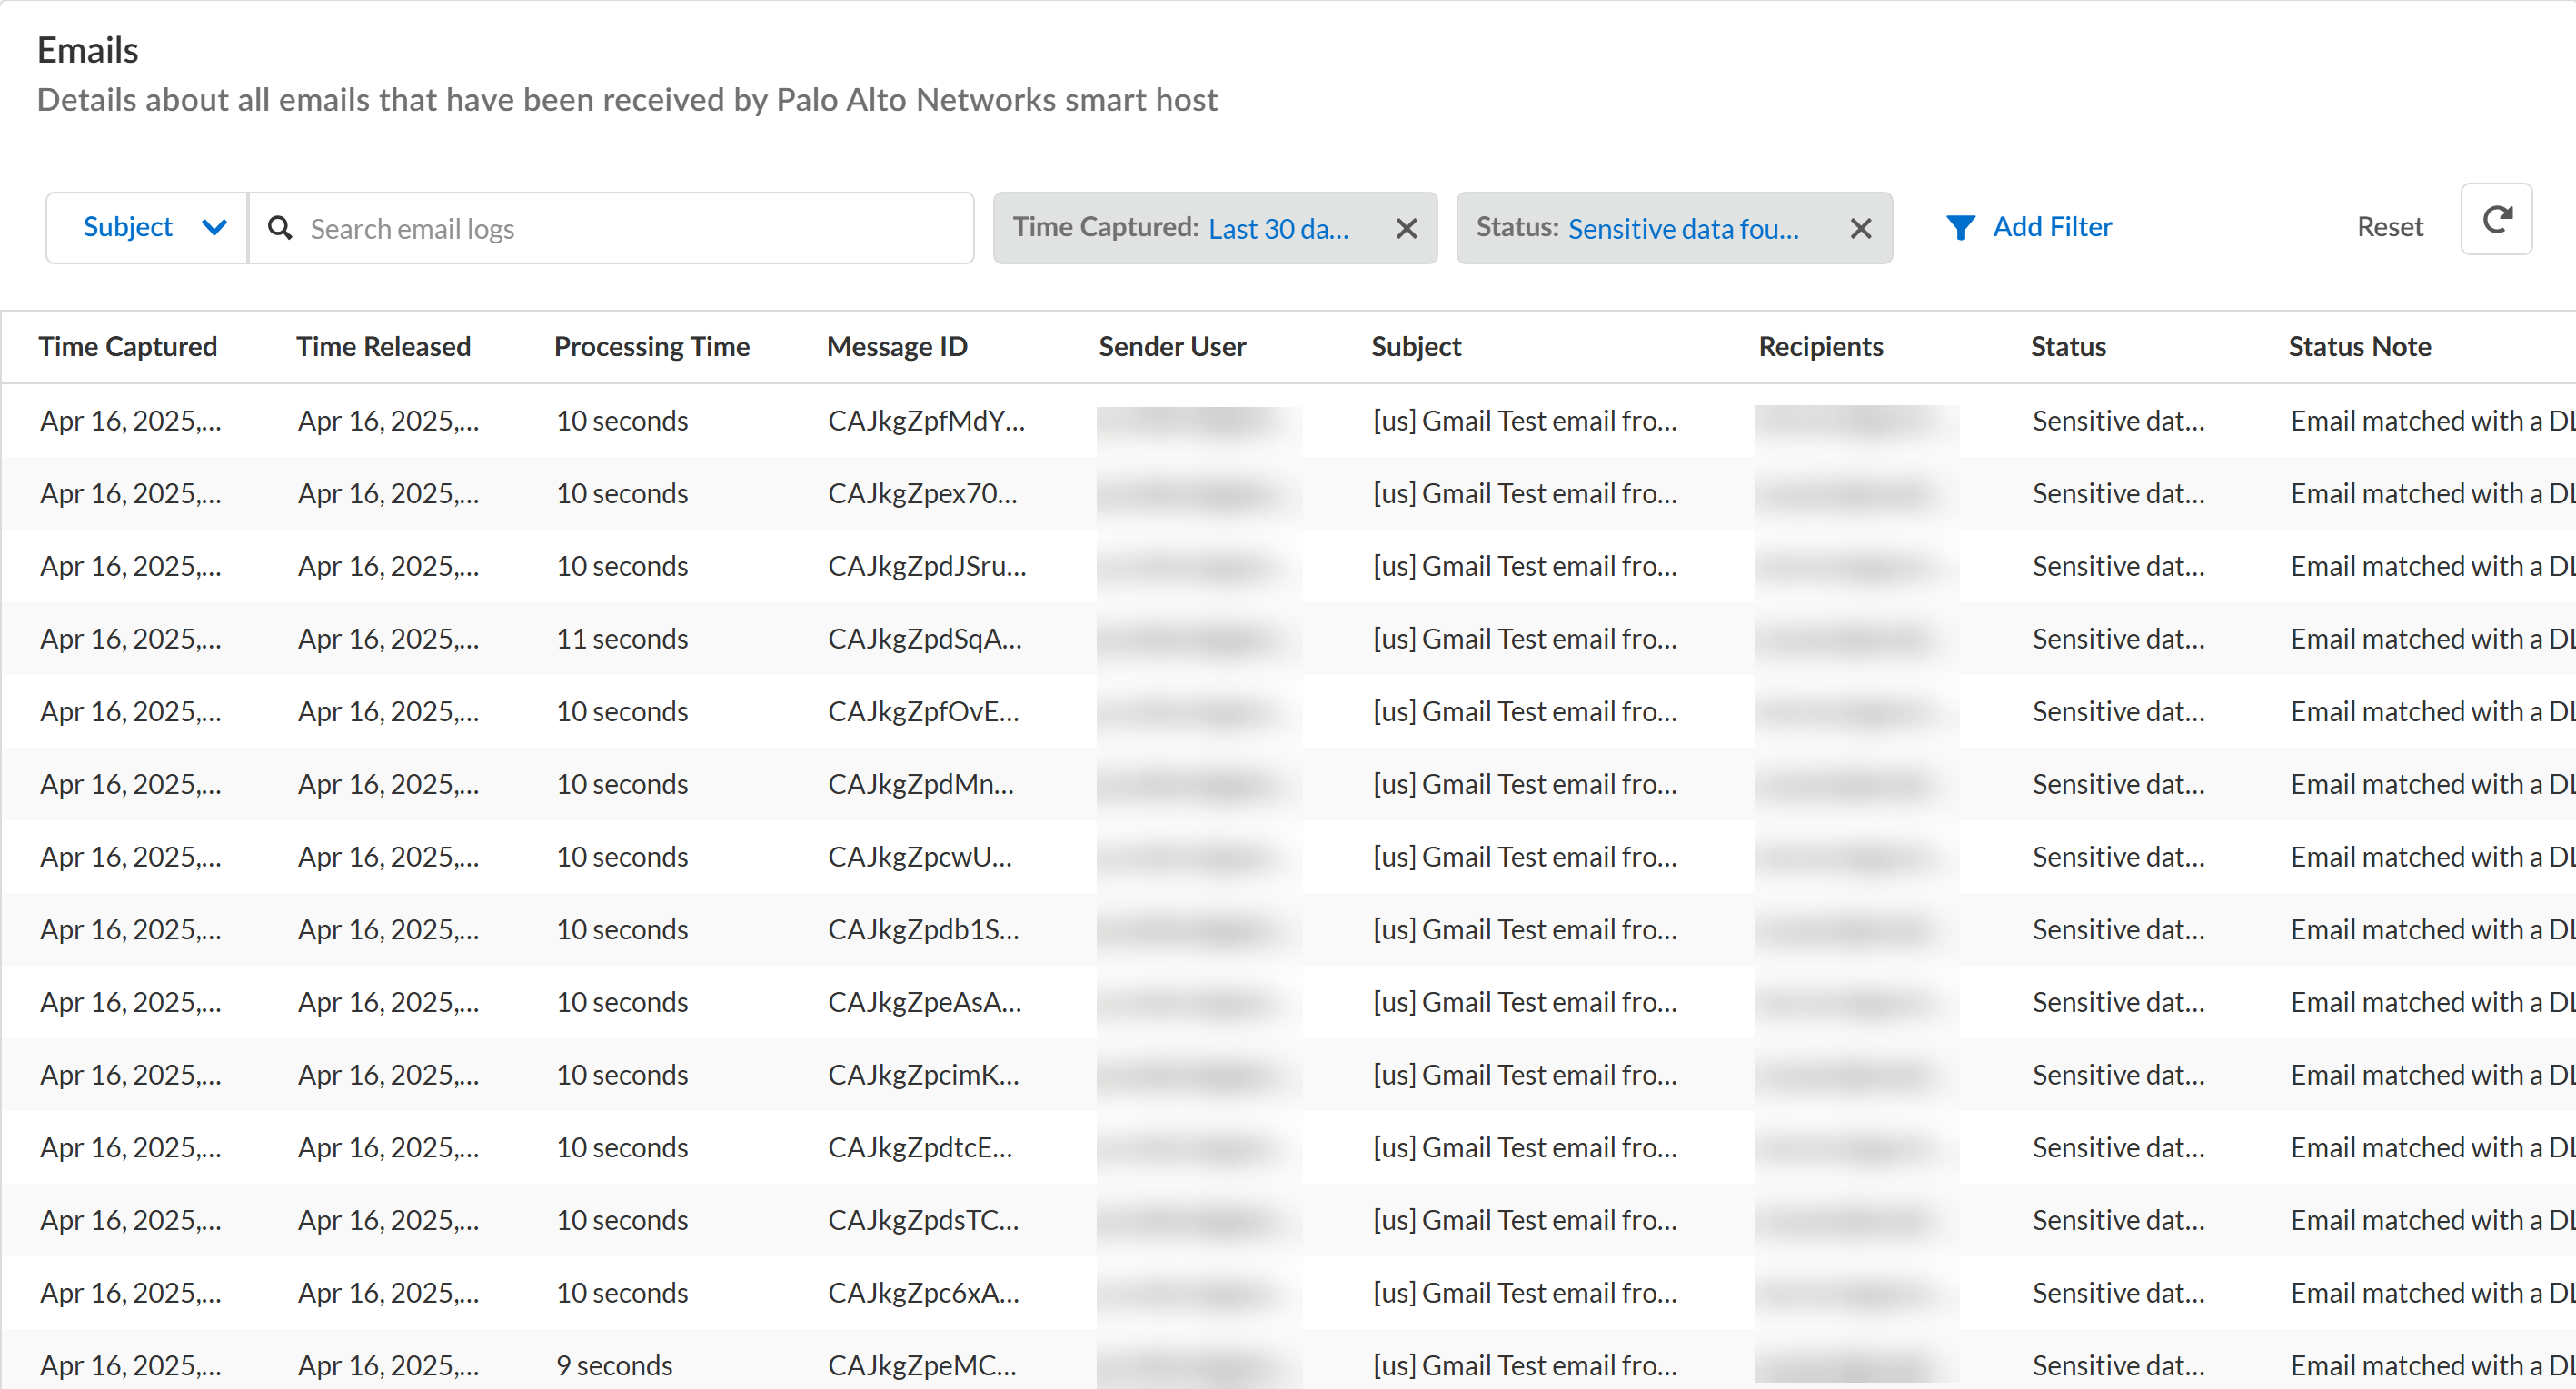
View the log details for traffic that matches your Enterprise Data Loss Prevention (E-DLP) data profiles for Email DLP on Strata Cloud Manager.- Log in to Strata Cloud Manager.Select .Click View Logs for Email DLP Logs.Filter your Email DLP logs as needed.
- You can search for specific Email DLP logs based on the email Subject, Message ID, Sender email, or Recipient email.
- Click Add Filter and filter your Email DLP logs based on:
- Processing Time—Time it took the Email DLP to scan and forward email back to your Microsoft Exchange or Gmail relay host. The processing time is the Time Released minus the Time Captured.
- Status—The Enterprise DLP inspection status indicating whether sensitive data was detected and whether the forwarded email was bounced.Common scenarios that cause Email DLP to return a bounce log are typically related to incorrect relay host settings when your connected Microsoft Exchange or Gmail, or networking issues affecting your email server relay host:
- Recipient Issues
- Recipient's email address is incorrect, their mailbox doesn't exist or isn't accepting new emails.Resolution—Verify the recipient's email address and ensure their account is active.
- Recipient's inbox is
full.Resolution—Reduce the email or email attachment size, or ask the recipient to free space in their inbox
- Invalid recipient email
address.Resolution—The recipient's email address might be in the wrong format or not allowed by the receiving email server's policies. Review the email address for typos or errors.
- Authentication and Configuration Issues
- Authentication issues such as incorrect login credentials or missing authentication.Resolution—Ensure you're using the correct username and password and that you properly configured authentication for your email server.
- Domain Name Server (DNS) configuration and
resolution issues.Resolution—Verify you configured your DNS records correctly and that the email server can resolve the recipient's domain.
- Email Server Policy Issues
- Anti-spam policies might have anti-spam policies
blocking your email. Resolution—Ensure your domain and IP address are not blacklisted and that your email meets the requirements of anti-spam policies.
- Poor sender reputation leading to automated email blocks.Resolution—Improve your sender reputation by sending legitimate emails and following best practices for email marketing.
- IP address or domain blacklisting causing your emails to be blocked.Resolution—Check if your IP address or domain is listed on any blacklists and take steps to remove them if necessary.
- Anti-spam policies might have anti-spam policies
blocking your email.
- Status Note—Detailed note populated by Enterprise DLP further describing the Enterprise DLP inspection Status.
- Time Captured—Date and time Email DLP captured the forwarded email.
- Time Released—Date and time Email DLP returned the forwarded email back to the sender's email server.
![]()
View Enterprise DLP Log Details for Endpoint DLP
View the log details for traffic that matches your Enterprise Data Loss Prevention (E-DLP) data profiles for Endpoint DLP on Strata Cloud Manager.No data profile or snippet is displayed for a Peripheral Control Endpoint DLP policy rule. A peripheral control policy rule controls an endpoint device's access to a peripheral device (block or alert). As a result, no data profile is required because no traffic inspection occurs.Multiple DLP Incidents () can be generated for a single file move operation from the endpoint and peripheral device. Some examples of when this may occur are:- Extracting the file contents of a compressed file from the endpoint to a peripheral device.
- An application that generates any artifact files when writing to a peripheral device. For example, the Microsoft BITSAdmin tool generates multiple .tmp files when writing to a peripheral device.
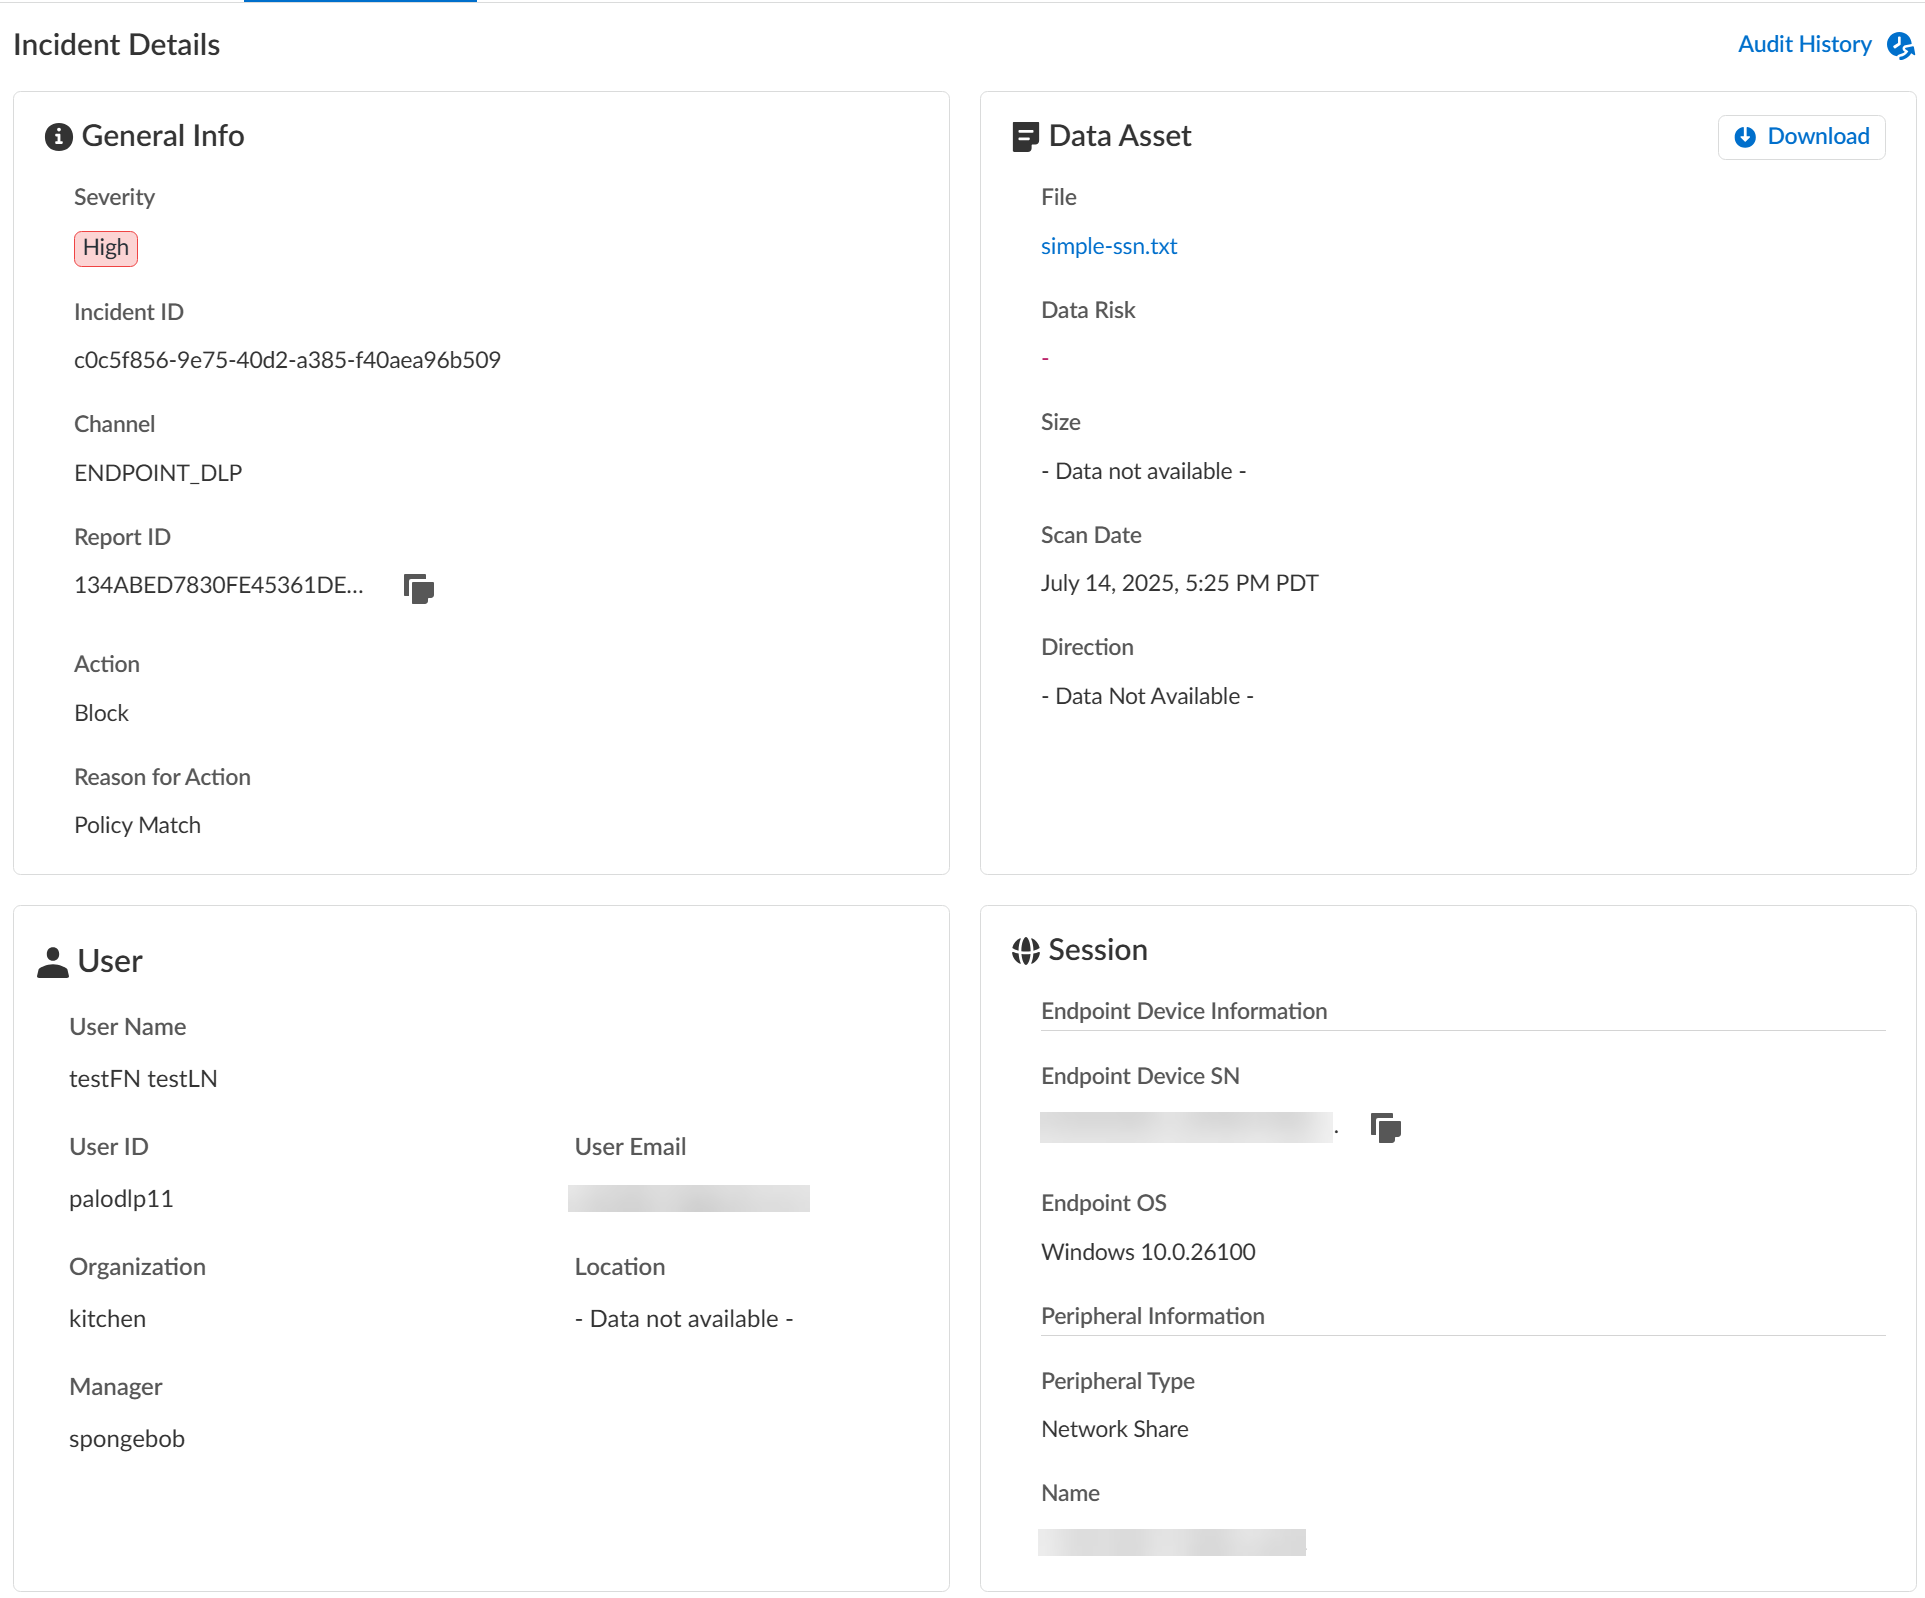
To prevent exfiltration of sensitive data, Enterprise DLP inspects every file associated with the file move operation from the endpoint to the peripheral device. This ensures that all impacted files are captured in your logs and analyzed. However, this may result in the creation of unnecessary DLP Incidents.- Log in to Strata Cloud Manager.(Optional) Configure syslog forwarding for Enterprise DLP incidents.Select .Select a Scan Date and Region to filter the DLP incidents.Enterprise DLP Incidents are generated in the Region where the Public Cloud Server is located.For Prisma Access (Managed by Strata Cloud Manager) and NGFW (Managed by Strata Cloud Manager), Enterprise DLP automatically resolves to the closest Public Cloud Server to where the inspected traffic originated.When a new Public Cloud Server is introduced, Enterprise DLP automatically resolve to it if it’s closer to where the inspected traffic originated.This might mean that new DLP Incidents generated after the release of a new Public Cloud Server are generated in a different Region.Add Filter and select the Action to filter for the specific Endpoint DLP policy rule action you want to investigate.For example, select only Block if you wanted to investigate all Endpoint DLP incidents where access to a peripheral device or file movement from the endpoint to the peripheral device was blocked.Review the Incidents and click the Incident ID to review detailed information for a specific incident.Review the Incident Details to review specific incident details.Make note of the Report ID for the DLP incident if you have not already done so. Use the Report ID to view additional Traffic log details regarding the DLP incident.
- InfoThe Info panel displays general information about the DLP incident.
- Severity—The incident severity configured in the Endpoint DLP policy rule.
- Incident ID—Unique ID for the DLP incident.
- Channel—The enforcement point using Enterprise DLP through which the incident occurred. This field always displays ENDPOINT_DLP.
- Report ID—Unique ID used to view additional Traffic log details regarding the DLP incident.
- Action—The action Enterprise DLP took on the traffic that matched your Endpoint DLP policy rule.
- Reason for Action—Provides a specific reason Prisma Access Agent took an Action.
- Data Asset
- File—Name of the file containing sensitive data that generated the incident.
- Data Risk—Not supported for Endpoint DLP. Displays -.
- Size—Size of the file that generated the DLP incident. Displays Data Not Available for an Endpoint DLP Peripheral Control policy rule.
- Direction—Not supported for Endpoint DLP. Displays -.
- Scan Date—Date and time Enterprise DLP generated the DLP incident.
- Download—If you have Evidence Storage configured, you can Download the file that generated the DLP incident for further investigation.
(Printing from a Windows device only) The file downloaded from your evidence storage bucket to the endpoint device will not contain the .pdf file extension and as a result you will not be able to open the downloaded file.To open the file, navigate to the location on the endpoint where the file was downloaded and edit the file name to append .pdf. Editing the file name to add the .pdf file extension will allow you to open the file. - UserUser data requires integration with Cloud Identity Engine (CIE) to display. The User data displayed correspond to Palo Alto Networks Attributes that correlate to specific directory provider fields in CIE.
- User Name—Name of the user as configured in CIE that generated the DLP incident.Corresponding Palo Alto Networks Attribute is Name.
- User ID—ID of the user who generated the DLP incident.The User ID field does not require CIE integration. However, the corresponding Palo Alto Networks Attribute is User Principal Name.
- User Email—Email of the user who generated the DLP incident.Corresponding Palo Alto Networks Attribute is Mail.
- Organization—Organization the user who generated the DLP incident is associated with.Corresponding Palo Alto Networks Attribute is Department.
- Location—Location of the user who generated the DLP incident.Corresponding Palo Alto Networks Attribute is Location.
- Manager—Manager of the user who generated the DLP incident.Corresponding Palo Alto Networks Attribute is Manager.
- Session
- Endpoint Device SN—Serial number of the endpoint that generated the DLP incident.
- Endpoint OS—Operating system and version running on the endpoint that generated the DLP incident.
- Peripheral Type—The specific type of peripheral against which Enterprise DLP generated the DLP incident.
- Name—Name of the peripheral device you added that generated the DLP incident.
- Case ManagementManually manage your DLP incidents to efficiently handle data security incident resolution across your security channels.
- Audit HistoryThe Audit History shows you the full Incident Case Management history for the specific DLP incident. It outlines every step of the case management process and the specific action taken by each user from when the incident case was assigned to when it was closed.
![]()
![]() (Data in Motion only) Review the Matches within Data Profiles to review snippets of matching traffic and the data patterns that matched the traffic to better understand what sensitive data Enterprise DLP detected.Toggle the Triggered Incidents to display only the data patterns that contain matched criteria.
(Data in Motion only) Review the Matches within Data Profiles to review snippets of matching traffic and the data patterns that matched the traffic to better understand what sensitive data Enterprise DLP detected.Toggle the Triggered Incidents to display only the data patterns that contain matched criteria.- Enterprise DLP generates an audit log when a user accesses a DLP incident and reviews the associated snippet.
- Enterprise DLP displays the proximity keyword and the corresponding snippet of sensitive data that generated the DLP incident.Enterprise DLP displays proximity keywords for sensitive data detected in unstructured data only. Enterprise DLP does not support displaying proximity keywords for sensitive data detected in structured content.For custom regex data patterns, Enterprise DLP displays only the first proximity keyword for sensitive data with a High Confidence match.
- (Nested and Granular Data Profiles) Enterprise DLP displays Triggered by each data profile containing match criteria in the data profile that inspected traffic matched against.
- When viewing a data pattern, Enterprise DLP displays the total number of Occurrences as well as the number of Unique Occurrences for all High, Medium, and Low Confidence detections.
- (EDM data sets) Enterprise DLP displays the column header of the EDM data set that matches the detected sensitive data. Enterprise DLP displays multiple column headers when sensitive data is detected in multiple different columns.
- Click Report False Positive if Enterprise DLP incorrectly detected and took action on the file or network traffic that it should not have. This is referred to as a false positive detection. Report a false positive detection to Palo Alto Networks to improve Enterprise DLP detection accuracy for yourself and other Enterprise DLP users.
General Example![]() EDM Data Set Example
EDM Data Set Example![]() Review the file log to learn about the traffic data for the DLP incident.
Review the file log to learn about the traffic data for the DLP incident.- Select .From the Firewall drop-down, select File.Filter to view the file log for the DLP incident using the Report ID.Report ID = <report-id>Review the file log to learn more about the traffic data for the DLP incident.Manage your Enterprise DLP incidents.