Enterprise DLP
View Enterprise DLP Log Details for Endpoint DLP
Table of Contents
View Enterprise DLP Log Details for Endpoint DLP
View the log details for traffic that matches your Enterprise Data Loss Prevention (E-DLP) data
profiles for Endpoint DLP on Strata Cloud Manager.
No data profile or snippet is displayed for a Peripheral Control Endpoint DLP
policy rule. A peripheral control policy rule controls an endpoint device's
access to a peripheral device (block or alert). As a result, no data profile
is required because no traffic inspection occurs.
Multiple DLP Incidents () can be generated for a single file move operation from the
endpoint and peripheral device. Some examples of when this may occur
are:
- Extracting the file contents of a compressed file from the endpoint to a peripheral device.
- An application that generates any artifact files when writing to a peripheral device. For example, the Microsoft BITSAdmin tool generates multiple .tmp files when writing to a peripheral device.
To prevent exfiltration of sensitive data, Enterprise DLP inspects every file
associated with the file move operation from the endpoint to the peripheral
device. This ensures that all impacted files are captured in your logs and
analyzed. However, this may result in the creation of unnecessary DLP
Incidents.
- Log in to Strata Cloud Manager.
- Select .
- Select a Scan Date and Region to filter the DLP Incidents.Enterprise DLP Incidents are generated in the Region where the Public Cloud Server is located.For Prisma Access (Managed by Strata Cloud Manager)and NGFW (Managed by Strata Cloud Manager), Enterprise DLP automatically resolves to the closest Public Cloud Server to where the inspected traffic originated.When a new Public Cloud Server is introduced, Enterprise DLP automatically resolve to it if it’s closer to where the inspected traffic originated.This might mean that new DLP Incidents generated after the release of a new Public Cloud Server are generated in a different Region.
- Add Filter and select the Action to filter for the specific Endpoint DLP policy rule action you want to investigate.For example, select only Block if you wanted to investigate all Endpoint DLP incidents where access to a peripheral device or file movement from the endpoint to the peripheral device was blocked.
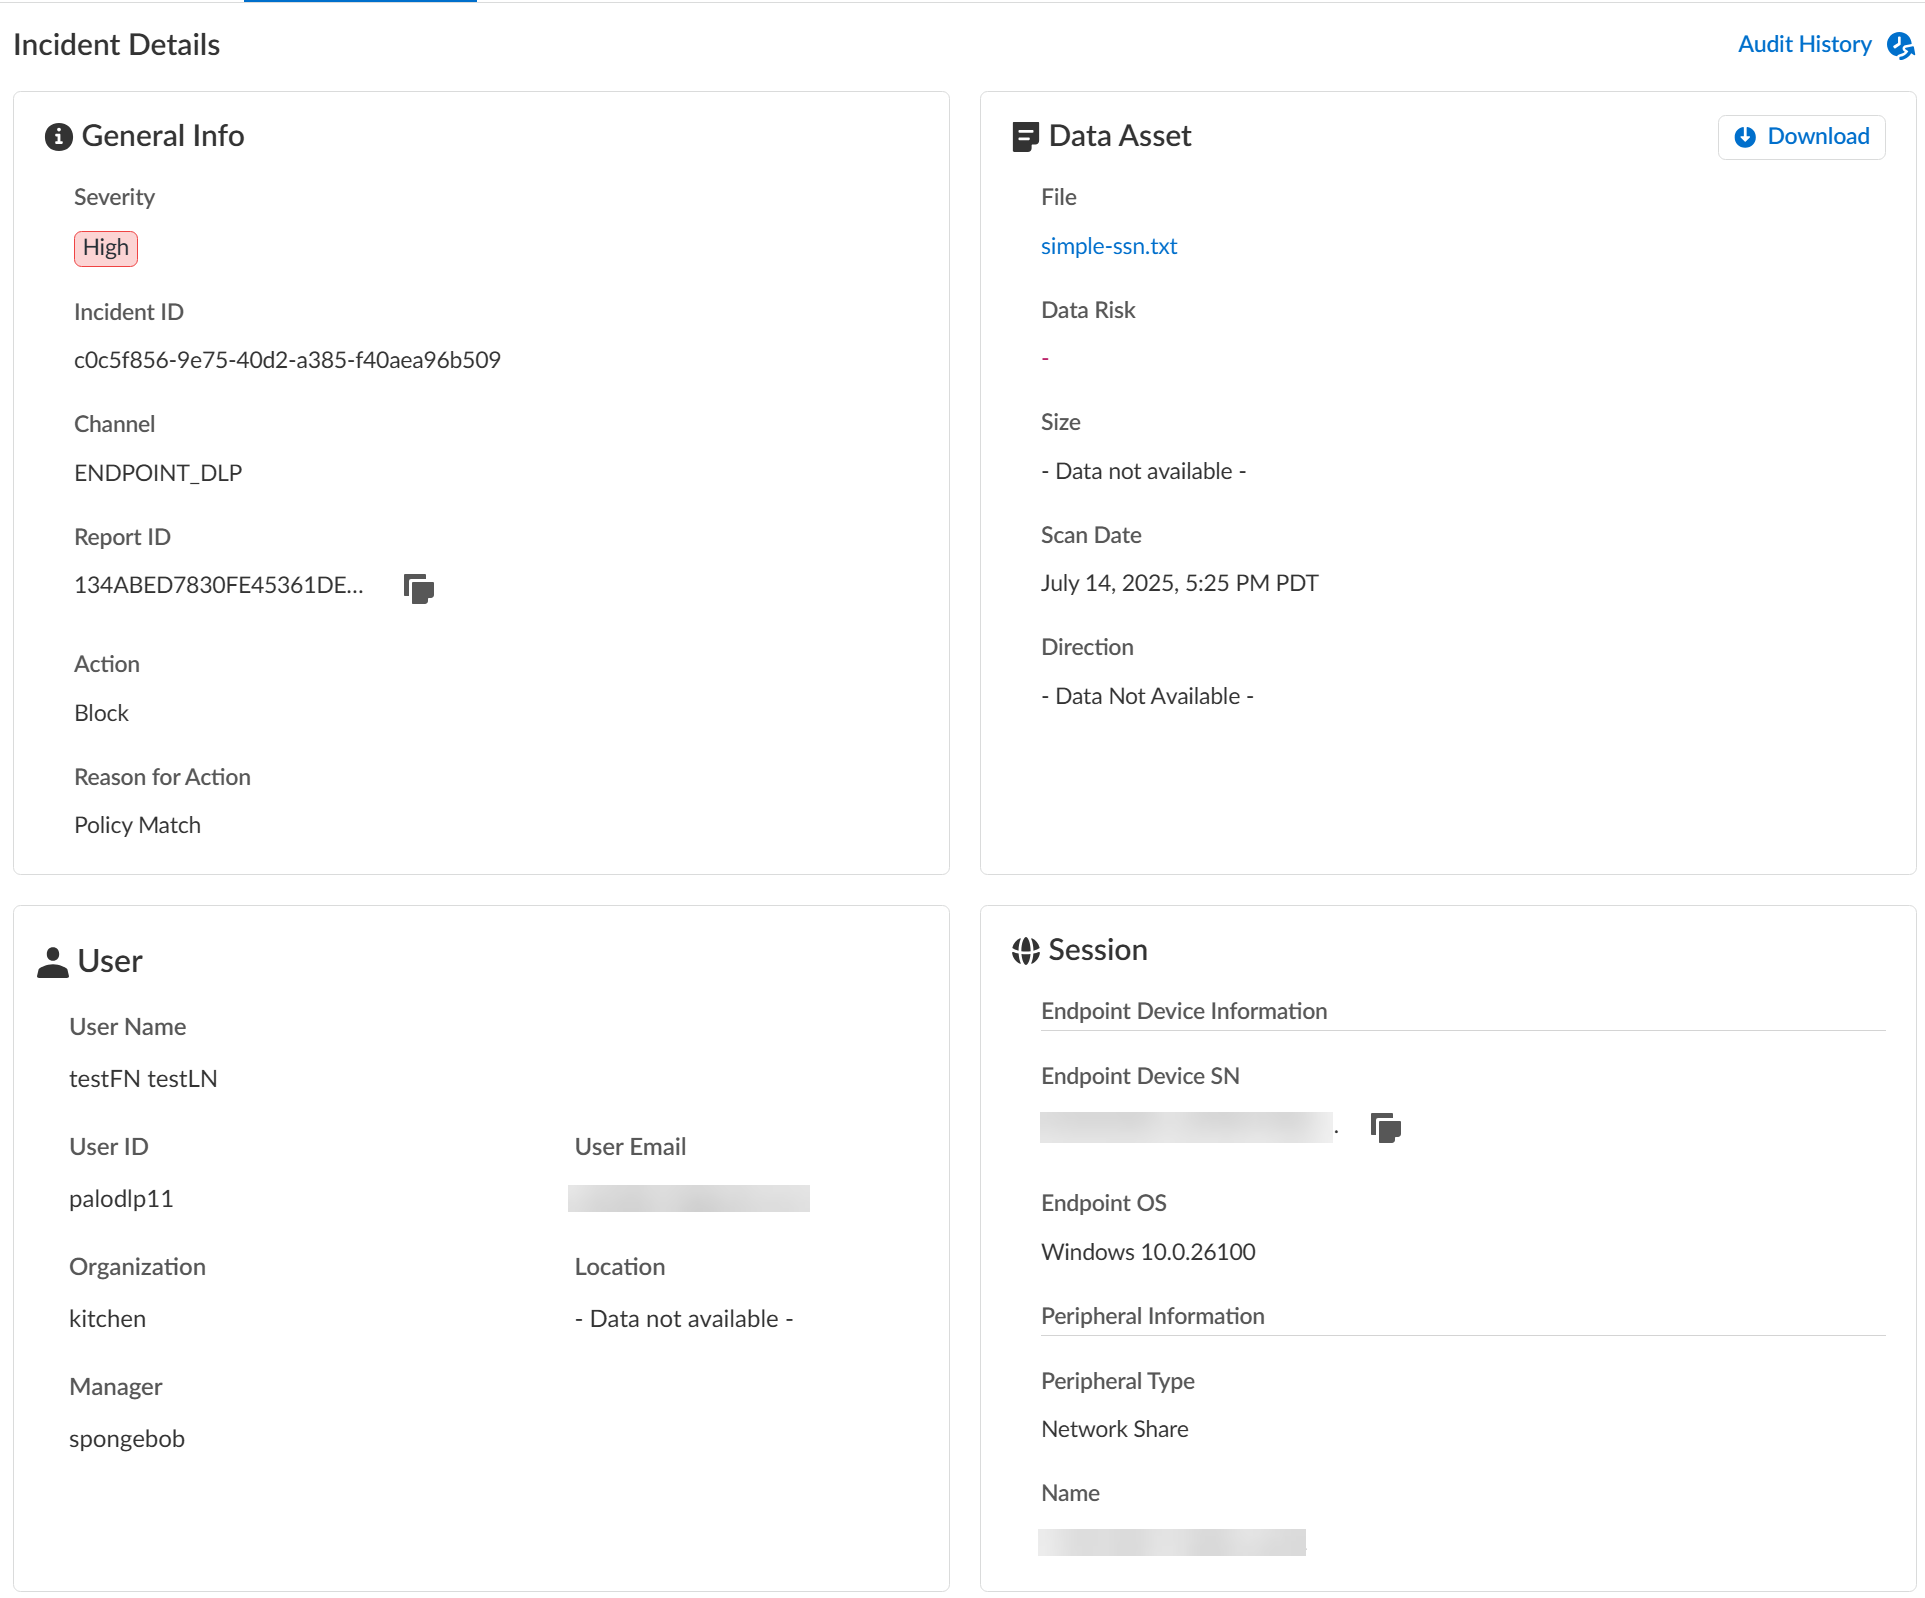
- Review the Incidents and click the Incident ID to review detailed information for a specific incident.

- Review the Incident Details to review specific file upload details.Make note of the Report ID for the DLP incident if you haven’t already done so. The Report ID is used to view additional Traffic log details regarding the DLP incident.
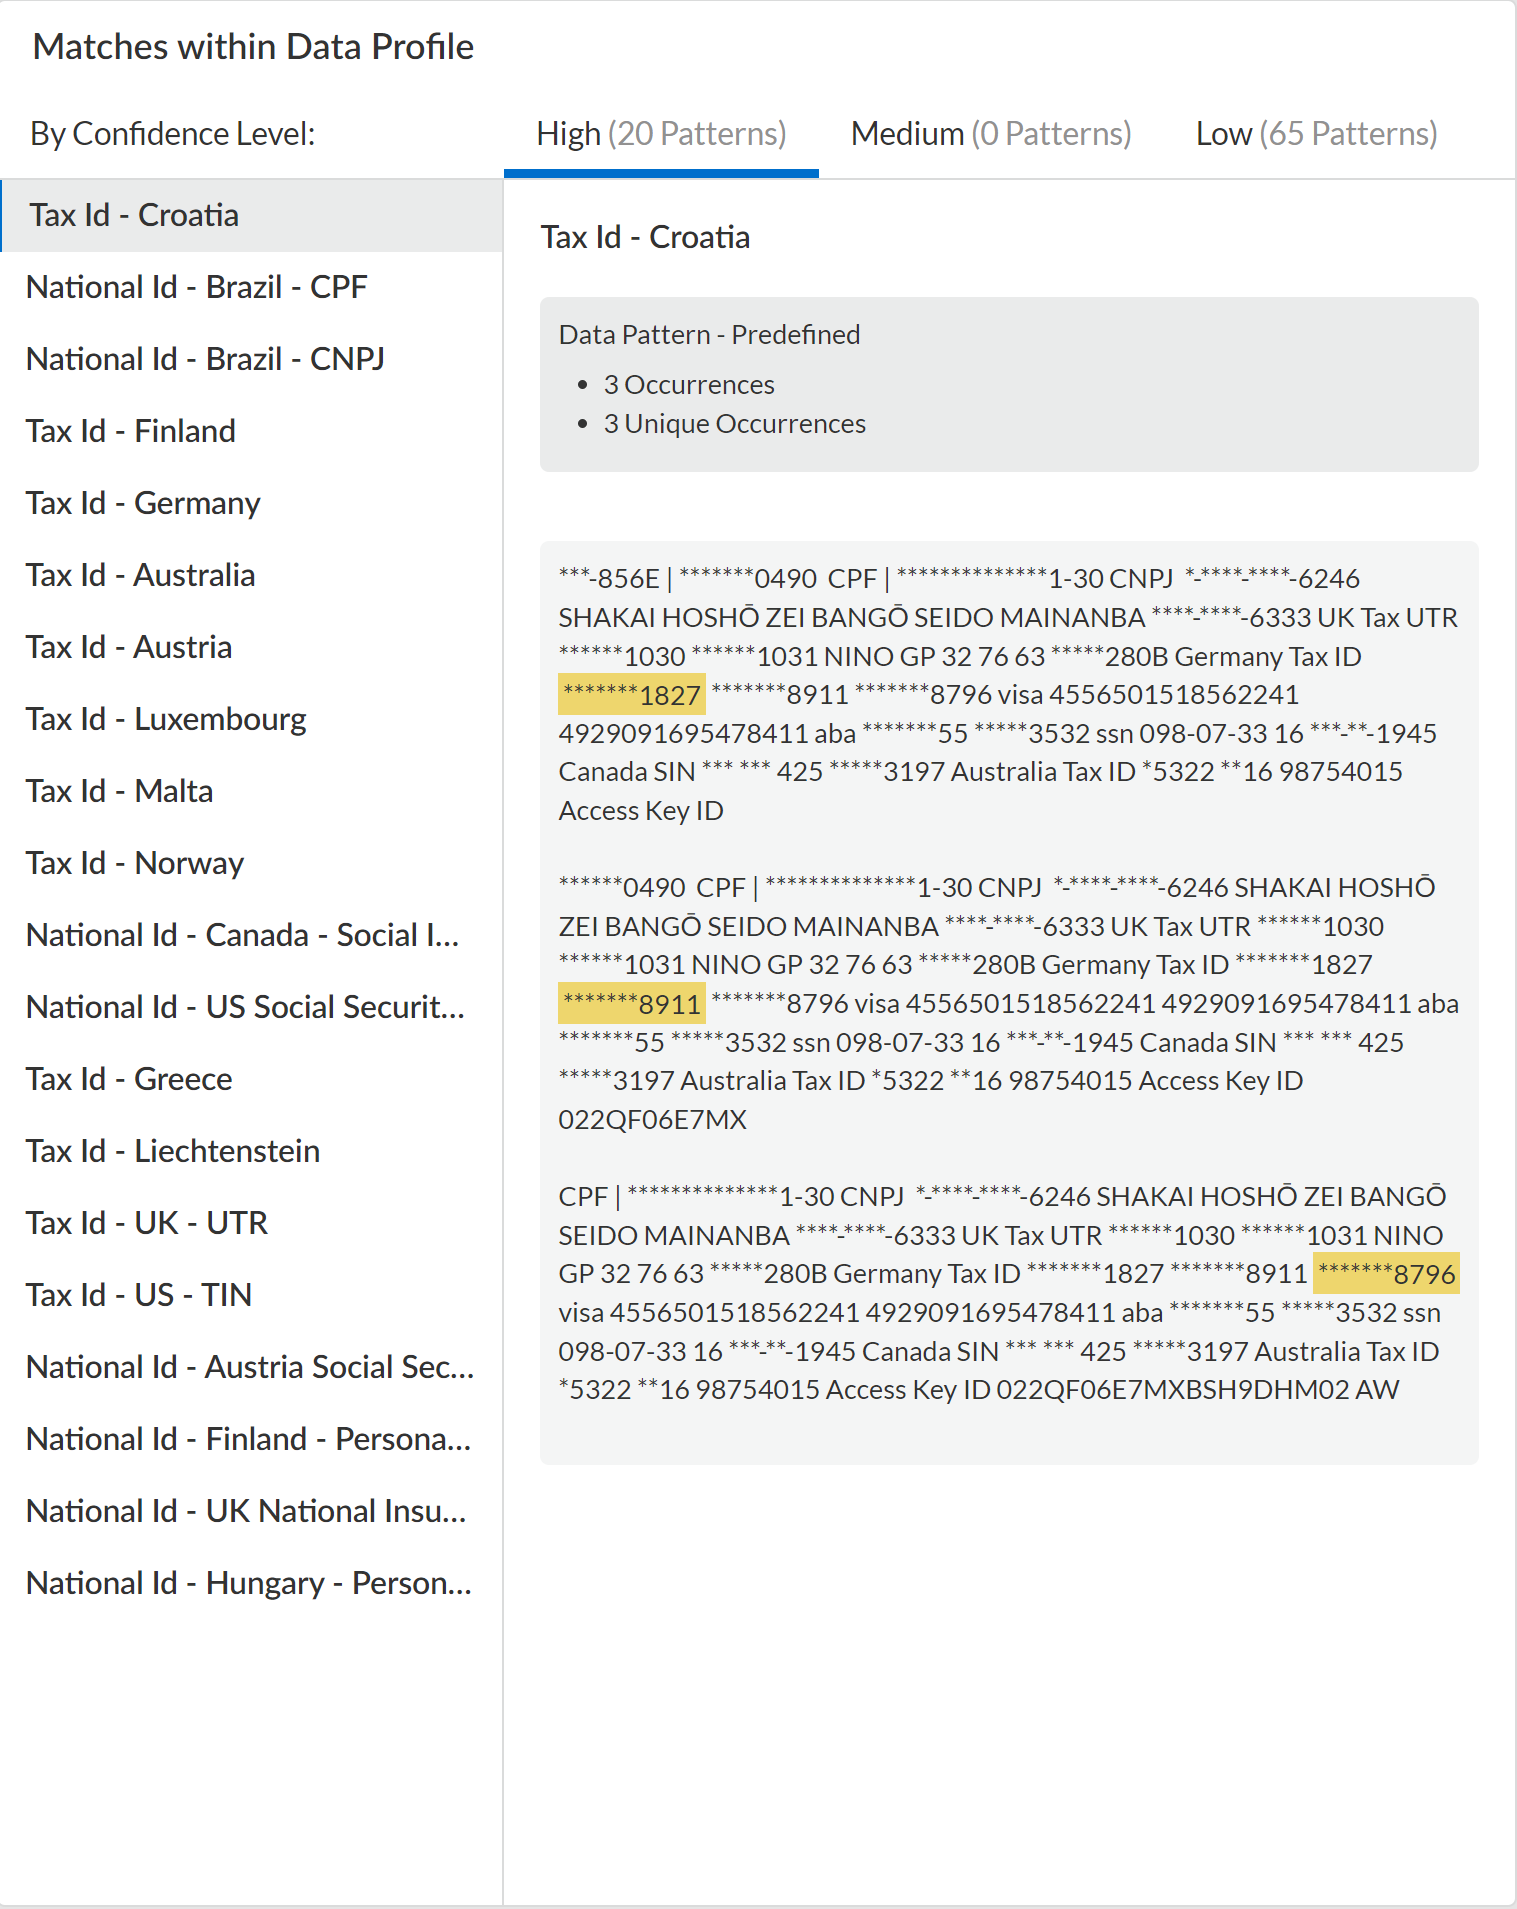
- (Data in Motion only) Review the Matches within Data Profiles to review snippets of matching traffic and the data patterns that matched the traffic to better understand what detected data.For nested data profiles, Enterprise DLP displays the name of the nested data profile and not the specific data profile containing the match criteria that matched inspected traffic. For example, you create a DataProfile, with the nested profiles Profile1, Profile2, and Profile3. Enterprise DLP inspects traffic that match Profile2 and blocks it. In this scenario, the Matches within Data Profile displays DataProfile.Additionally, you can filter the Matches within Data Profile for a nested data profile to display traffic matches against specific associated data profiles.
- Review the file log to learn about the traffic data for the DLP incident.
- Select .
- From the Firewall drop-down, select File.
- Filter to view the file log for the DLP incident using the Report ID.Report ID = <report-id>
- Review the file log to learn more about the traffic data for the DLP incident.